Zhenfeng Wei* | Xiaohua Zhang
© 2021 IIETA. This article is published by IIETA and is licensed under the CC BY 4.0 license (http://creativecommons.org/licenses/by/4.0/).
OPEN ACCESS
The new retail is an industry featured by online ecommerce. One of the key techniques of the industry is the product identification based on image processing. This technique has an important business application value, because it is capable of improving the retrieval efficiency of products and the level of information supervision. To acquire high-level semantics of images and enhance the retrieval effect of products, this paper explores the feature extraction and retrieval of ecommerce product images based on image processing. The improved Fourier descriptor was innovatively into a metric learning-based product image feature extraction network, and the attention mechanism was introduced to realize accurate retrieval of product images. Firstly, the authors detailed how to acquire the product contour and the axis with minimum moment of inertia, and then extracted the shape feature of products. Next, a feature extraction network was established based on the metric learning supervision, which is capable of obtaining distinctive feature, and thus realized the extraction of distinctive and classification features of products. Finally, the authors expounded on the product image retrieval method based on cluster attention neural network. The effectiveness of our method was confirmed through experiments. The research results provide a reference for feature extraction and retrieval in other fields of image processing.
image processing, ecommerce, image feature extraction, image retrieval
In recent years, e-commerce has brought great convenience to consumers [1-3]. A variety of products are sold online by ecommerce providers. The publicity images of the products carry much more diverse and accurate visual information than text. Therefore, the product identification based on image processing emerges as a key technique of the new retail. This technique boasts an important business application value, because it is capable of improving the retrieval efficiency of products and the level of information supervision [4-7].
With the recent progress in deep learning, the image identification by convolutional neural networks (CNNs) has become increasingly accurate. However, the relevant algorithms need to be further improved to solve the following defects: poor classification effect, inefficient use of data, and difficulty in engineering application.
Domestic and foreign scholars have achieved fruitful results on image processing of ecommerce products [8-10]. To extract the exact text information in ecommerce images, Wasim et al. [11] proposed an image text character positioning method based on grayscale clustering and layer decomposition, and applied it to recognize each Chinese character of complex fonts based on multi-layer CNN; the proposed method achieved good recognition effect and strong generalization ability. Based on traditional image text detection algorithm, Miao et al. [12] presented an improved detection algorithm, which optimizes the text box merging and refining according to text height, and solves the detection box offset induced by inconsistent text height during text detection. To recognize inclined text in images more accurately, Massaro et al. [13] developed a low time-complexity, perspective transform correction algorithm for the distorted images after text detection, which achieved a desirable mean recognition accuracy on the corrected text region in images. Facing the high complexity and inefficient recognition of the current automatic product identification algorithm, Syberfeldt and Vuoluterä [14] constructed a fine-grained product image feature extraction and monitoring module based on a network with balanced performance between metric learning and performance accuracy, and introduced the inception module and a series of streamlined units, thereby effectively learning product features and accelerating product detection.
In terms of product recognition, Byambasuren et al. [15] constructed a deep cascading embedded network good at learning difficult samples, selected A-softmax to measure the loss of recognition performance, and completed network training and testing on real-world ecommerce product image sets; their network achieved a mean recall of >99%. The accurate retrieval of target products has also attracted much attention in the academia. To realize automatic product recognition, Therrell [16] built up a dataset of 30 types of products in the field of new retail, screened the candidate regions of interests (ROIs) based on the location information of the dataset, and verified that the candidate products determined by the proposed significance-based unsupervised ecommerce target product retrieval algorithm largely overlap the true target products.
In ecommerce websites, almost all items are displayed intuitively as images. For a consumer to purchase the needed product, the key determinant is the accurate retrieval of product images with a high similarity [17-19]. In terms of product retrieval, Moorthy et al. [20] put forward a target retrieval algorithm for cross-domain beauty products based on multi-attentional mechanism, which realizes accurate retrieval of real beauty products in two steps: all candidate box features of the products were characterized by channel weighted generalized mean pooling features, and the attention mechanism was adopted to learn the description of fine-grained features. Based on the extraction of global and local features, Anai et al. [21] developed a dual-layer image retrieval technique that fits in for offline product image retrieval. Hazawa et al. [22] developed a cross-media retrieval model for ecommerce platforms that fuses absolute and relative sorting results, and demonstrated that the model is much more accurate than the traditional single mode image retrieval method.
Sorting out the relevant literature, it was clear that the current image feature extraction methods for image retrieval focus on depicting shallow features like texture, failing to mine high-level semantics of images. That is why none of them can achieve an ideal retrieval performance. This paper innovatively introduces the improved Fourier descriptor into a metric learning-based product image feature extraction network, and incorporates the attention mechanism to realize accurate retrieval of product images. Section 2 details how to acquire the product contour and the axis with minimum moment of inertia, and extracts the shape feature of products. Section 3 establishes a feature extraction network based on the metric learning supervision, which is capable of obtaining distinctive feature, and then extracts the distinctive and classification features of products. Section 4 expounds on the product image retrieval method based on cluster attention neural network. Finally, experiments were carried out to verify the effectiveness of our method.
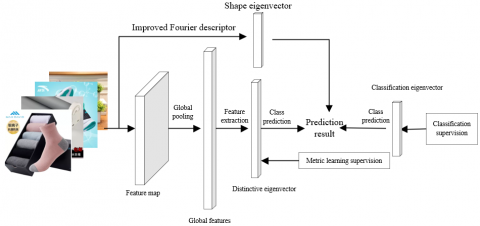
To acquire accurate features of ecommerce product images, this paper firstly extracts the shape feature of product features with the improved Fourier descriptor, and then mines the distinctive and classification features of products, using a feature extraction network based on the metric learning supervision.
Figure 1. Feature extraction procedure of ecommerce product images
First, the target color image was converted into a grayscale image, and removed of noises through grayscale adaptive thresholding. After contour extraction, the centroid of the product image was determined according to the coordinates of the contour. Then, equal chord length interpolation was performed to obtain the coordinates of contour interpolation points. Finally, the shape feature of the product was obtained through Fourier transform of the start point of product contour.
2.1 Contour extraction
The feature extraction of ecommerce product image aims to facilitate product image retrieval. Therefore, the contour extraction of product image should satisfy two goals: perverse the attributes of the product image, and minimize the data volume of the image. This paper performs edge detection on the product image with Canny operator. After grayscale transform, the product image needs Gaussian smoothing in both directions a and b. The corresponding Gaussian operator can be expressed as:
$G\left( a,b,\varepsilon \right)={{e}^{-\frac{{{a}^{2}}+{{b}^{2}}}{2{{\varepsilon }^{2}}}}}$ (1)
Following direction filtering and gradient operation, the grayscale product image needs to be convoluted by smooth Gaussian template:
$\left\{ \begin{matrix} {{G}_{a}}=-\frac{a}{{{\varepsilon }^{2}}}{{e}^{-\frac{{{a}^{2}}+{{b}^{2}}}{2{{\varepsilon }^{2}}}}} \\ {{G}_{b}}=-\frac{b}{{{\varepsilon }^{2}}}{{e}^{-\frac{{{a}^{2}}+{{b}^{2}}}{2{{\varepsilon }^{2}}}}} \\\end{matrix} \right.$ (2)
The convolution in formula (2) is equivalent to solving the partial derivatives in directions a and b separately, with the aim to derive the partial derivative matrix (3) for the calculation of gradient amplitude and direction:
$\left\{ \begin{matrix} \gamma \left( a,b \right)=\sqrt{G_{a}^{2}\left( a,b \right)+G_{b}^{2}\left( a,b \right)} \\ {{\alpha }_{\gamma }}=acrtan\left( \frac{{{G}_{b}}}{{{G}_{a}}} \right) \\\end{matrix} \right.$ (3)
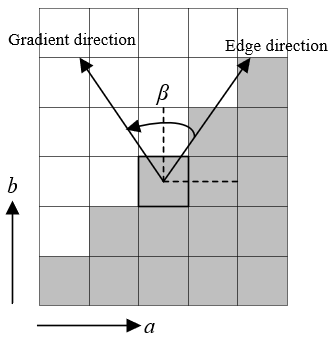
Figure 2. Centroid attribute of ecommerce product image
Figure 2 shows the gradient vector, edge direction, and azimuth angle of the centroid of ecommerce product image. The gradient was simply divided into four directions: the horizontal, vertical, 45° and 135°. The gradient angle is limited to [0°, 25°] and [155°, 180°] in the horizontal direction, [69°, 114°] in the vertical direction, [25°, 69°] in the 45° direction, and [114°, 155°] in the 135° direction.
To reduce the gradient of edge points and noise points in the gradient matrix, it is necessary to traverse very point in the matrix, find the two points from the eight neighborhoods sharing the same gradient direction of each matrix point, and compare their gradients with the gradient of the matrix point: if the matrix point has a greater gradient than the two points, then the point must be an edge point.
Indiscriminate parameterization could result in an uneven distribution of data points. To smooth the product contour curve, equidistance interpolation was implemented on edge points of the product through the parameterization of cumulative chord length, which can characterize the distribution of data points relative to chord length. Let A=A(r) and B=B(r) be the quadratic spline interpolations constructed from the product contour. Then, the quadratic parameterized spline curve can be obtained by interpolating A=A(r) and B=B(r) into point sets (ri,Ai) and (ri,Bi):
$SC=\left[ A\left( r \right),B\left( r \right) \right]$ (4)
The cumulative chord length between the spline curve attribute points SCi(Ai, Bi) and SCI can be expressed by:
$\left\{ \begin{matrix} {{r}_{0}}=0 \\ {{r}_{1}}={{d}_{1}}=\sqrt{{{\left( {{A}_{1}}-{{A}_{0}} \right)}^{2}}+{{\left( {{B}_{1}}-{{y}_{0}} \right)}^{2}}} \\ {{r}_{2}}={{d}_{1}}+{{d}_{2}}=\sqrt{{{\left( {{A}_{1}}-{{A}_{0}} \right)}^{2}}+{{\left( {{y}_{1}}-{{y}_{0}} \right)}^{2}}}+\sqrt{{{\left( {{A}_{2}}-{{A}_{1}} \right)}^{2}}+{{\left( {{B}_{2}}-{{B}_{1}} \right)}^{2}}} \\ \begin{matrix} \vdots \\ {{r}_{I}}=\sum\limits_{i=1}^{I}{{{d}_{i}}}=\sum\limits_{i=1}^{I}{\left| S{{C}_{i-1}}S{{C}_{i}} \right|=\sum\limits_{i=1}^{I}{\sqrt{{{\left( {{A}_{i}}-{{A}_{i-1}} \right)}^{2}}+{{\left( {{B}_{i}}-{{B}_{i-1}} \right)}^{2}}}}} \\\end{matrix} \\\end{matrix} \right.$ (5)
The interpolation function can be expressed as:
$\left\{ \begin{matrix} A=A\left( r \right) \\ B=B\left( r \right) \\\end{matrix} \right.$ (6)
2.2 Determination of the axis with minimum moment of inertia
The start point of the product contour can be located by the identifying specific geometry and shape. Let (ai, bi) and δi be the coordinates and pixel value of image pixels, respectively; S1 be the start point of product contour. Then, the centroid of the product image can be calculated by:
$\left\{ \begin{matrix} {{a}_{gc}}=\frac{\sum{{{\delta }_{i}}{{a}_{i}}}}{\sum{{{\delta }_{i}}}} \\ {{b}_{gc}}=\frac{\sum{{{\delta }_{i}}{{b}_{i}}}}{\sum{{{\delta }_{i}}}} \\\end{matrix} \right. $ (7)
The minimum moment of inertia only appears when the rigid body with axis symmetry and uniform mass distribution rotates about its symmetric axis. Hence, each pixel in the grayscale image composed of pixel set δ={(ai,bi)|i∈[1,Mp]} can be viewed as a mass microelement. In this paper, the start point of product contour is defined as the farthest intersection between the axis with minimum moment of inertia of the centroid and the product contour. Let (agc,bgc) be the coordinates of product centroid; β be the angle between the main coordinate axis and the line connecting the contour pixels divided equally into Mp groups and δgc. Then, the axis with minimum moment of inertia can be obtained by integrating the mass microelement of each pixel:
$\begin{align} & I=\sum\limits_{i=1}^{{{M}_{p}}}{d_{i}^{2}} \\ & =\sum\limits_{i=1}^{{{M}_{p}}}{{{\left[ \frac{\left| b-\left( a-{{a}_{gc}} \right)tan\beta -{{b}_{gc}} \right|}{\sqrt{1+tan{{\beta }^{2}}}} \right]}^{2}}} \\ \end{align}$ (8)
Further, it is necessary to implement normalization, because the first point described by the Fourier descriptor contains high-frequency information that cannot characterize product contour. Since the horizontal direction is the main direction λ for shape normalization of the Fourier descriptor, the phase influence e-j2πτ/P of the angle β on the moving arc length of boundary start point can be estimated to eliminate the phase effect of the boundary start point:
$\frac{Q'\left( 1 \right)}{\left\| Q'\left( 1 \right) \right\|}=\frac{\eta {{e}^{j\lambda }}{{e}^{-j\frac{2\pi }{P}\tau }}}{\left\| \eta {{e}^{j\lambda }}{{e}^{-j\frac{2\pi }{P}\tau }}s\left( 1 \right) \right\|}={{e}^{j\lambda }}{{e}^{-j\frac{2\pi }{P}\tau }}$ (9)
The normalized Fourier descriptor can be expressed as:
$f'\left( k \right)=\frac{Q'\left( I \right){{e}^{j\beta }}}{\left\| Q\left( 1 \right) \right\|}$ (10)
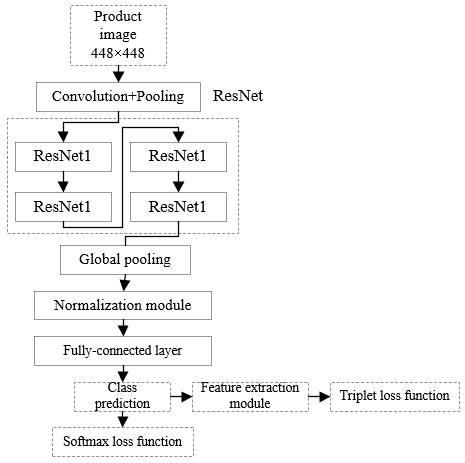
Unlike face recognition, product identification needs to extract distinctive feature. This paper constructs a feature extraction network based on the metric learning supervision capable of acquiring distinctive feature, in an attempt to extract decisive fixed-dimensional eigenvectors from the rich semantics of the input product image. Figure 3 shows the workflow of the proposed network. It can be seen that the network is composed of three parts: a pretrained backbone network for extracting basic features and advanced semantics of the image; a feature extraction module for compressing high-dimensional eigenvectors and accelerating network training; a classification module for predicting the class of output features.
Figure 4 details the structure of distinctive and classification feature extraction network based on metric learning. To enable the network learn more distinctive descriptions of product image, this paper integrates the metric learning loss of the supervision network in eigenvector classification with the loss of the network in feature classification. The former is measured by improved Triplet loss function, and the latter by Softmax loss function.
Figure 3. Workflow of feature extraction network
Figure 4. Structure of distinctive and classification feature extraction network based on metric learning
(1) Triplet loss function
The feature extraction network is essentially a mapping from the image space to a U-dimensional hyper spherical feature space. The mapping can be described as $h \beta(a) \in R^{U}$, with $\left\|h_{\beta}(a)\right\|_{2}=1$. The distance between two image features can be defined by Euclidean distance:
$DI{{S}_{i,j}}=DIS\left( {{h}_{\beta }}\left( {{a}_{i}} \right),{{h}_{\beta }}\left( {{a}_{j}} \right) \right)=\left\| {{h}_{\beta }}\left( {{a}_{i}} \right)-{{h}_{\beta }}\left( {{a}_{j}} \right) \right\|_{2}^{2}$ (11)
To solve the nearest neighbors classification, it is necessary to make the characterization of the loss function closer to characteristic spacing between the same class of product images, and away from that between different classes of product images. Hence, the loss function of the constructed network can be defined as:
$Loss\left( \beta \right)=\left( 1-\upsilon \right)Los{{s}_{tow}}\left( \beta \right)+\upsilon Los{{s}_{awa}}\left( \beta \right)$ (12)
The above formula shows that, the loss function is composed of two terms: Losstow(β) and ccccLossawa(β). The former keeps each feature point close to neighboring points of the same class $\Gamma(i)$, while the latter keeps each feature point away from neighboring points of a different class. Specifically, Losstow(β) can be expressed as:
$Los{{s}_{tow}}\left( \beta \right)=\sum\limits_{i,j\in \Gamma \left( i \right)}{DI{{S}_{i,j}}}$ (13)
Let [Z]+=max(0,1-Z) be the folding loss function that excludes the correctly classified features from the loss calculation. Then, Lossawa(β) can be expressed as:
$Los{{s}_{awa}}\left( \beta \right)=\sum\limits_{{{b}_{ap}}\ne {{b}_{-}}}{{{\left[ o+DI{{S}_{ap,T\left( ap \right)}}-DI{{S}_{ap,-}} \right]}_{+}}}$ (14)
Loss(β) was further improved to adapt the constructed loss function to the identification of public product images. A triplet was designed, which includes an anchor sample Cap, a positive sample C+ in the same class with the anchor sample, and a negative sample C- in a different class from the anchor sample. The characterization of the loss function for the triplet is to narrow the distance from the anchor sample to the negative sample, while increasing the distance from the anchor sample to the negative sample. Let TC be the set of triplets formed by the elements in the training set. Then, the distances from the anchor sample to positive and negative samples must satisfy the following margin conditions:
$\begin{align} & \left\| {{h}_{\beta }}\left( a_{ap}^{i} \right)-{{h}_{\beta }}\left( a_{+}^{i} \right) \right\|_{2}^{2}-\left\| {{h}_{\beta }}\left( a_{ap}^{i} \right)-{{h}_{\beta }}\left( a_{-}^{i} \right) \right\|_{2}^{2}>\sigma \\ & \text{ }\forall \left( {{h}_{\beta }}\left( a_{ap}^{i} \right),{{h}_{\beta }}\left( a_{+}^{i} \right),{{h}_{\beta }}\left( a_{-}^{i} \right) \right)\in TC \\ \end{align}$ (15)
Then, the loss function of the triplets can be expressed as:
$Los{{s}_{triplet}}\left( \beta \right)=\sum\limits_{\text{ }{{b}_{ap}}={{b}_{+}}\ne {{b}_{-}}}{{{\left[ o+DI{{S}_{ap,+}}-DI{{S}_{ap,-}} \right]}_{+}}}$ (16)
Formula (16) shows that, the triplet loss Losstriplet(β) does not need to approach a fixed feature point, but needs to traverse all triplets in T. If the dataset is large, the number of triplets will grow exponentially, making the network training rather lengthy. Many randomly sampled triplets will also hinder the deep learning and improvement of the network, and even cause overfitting. To speed up network training and avoid overfitting, this paper improves Losstriplet(β) following the ideas of difficult sample mining:
$Los{{{s}'}_{triplet}}\left( \beta ,V \right)={{\sum\limits_{i=1}^{X}{\sum\limits_{ap=1}^{Y}{\left[ \begin{align} & o+\underset{+=1...Y}{\mathop{\max }}\,DIS\left( {{h}_{\beta }}\left( a_{ap}^{i} \right),{{h}_{\beta }}\left( a_{+}^{i} \right) \right) \\ & -\underset{\begin{smallmatrix} j=1...X \\ -=1...Y \\ \text{ }j\ne ap \end{smallmatrix}}{\mathop{\min }}\,D\left( {{h}_{\beta }}\left( a_{ap}^{i} \right),{{h}_{\beta }}\left( a_{-}^{j} \right) \right) \\ \end{align} \right]}}}_{+}}$ (17)
where, X and Y means the batched random sampling of Y images of X classes of products during training, resulting in X×Y image samples; V is the data of the small batch that represents the m-th image of the vnm-th class products.
The improved Losstriplet(β) consists of the maximum spacing between a sample in a batch from the samples in the same class, and the minimum spacing between that sample from the samples in another class. The improved version accelerates network training and convergence through the mining of difficult samples, and updates the network through full utilization of the data in each batch.
(2) Joint loss function
The product image features classified by our network are extracted in the Softmax loss supervision feature extraction network. Let $\Phi_{j}$ be the j-th column of the weight matrix $\Phi$ in the fully-connected layer, and $\Psi$ be the bias of that layer. Then, the probability that the i-th product image feature Fi belongs to the q-th class qi can be calculated by:
${{p}_{i}}=\frac{{{e}^{\Phi _{{{q}_{i}}}^{T}{{F}_{i}}+{{\Psi }_{{{q}_{i}}}}}}}{\sum\nolimits_{j=1}^{q}{{{e}^{\Phi _{j}^{T}{{F}_{i}}+{{\Psi }_{j}}}}}}$ (18)
Suppose MRS image samples are randomly collected for each training batch. Every sample qi was assigned a label i. Then, the classification loss in each training batch can be likened to the mean Softmax loss of using the sample data in that batch:
$Los{{s}_{cp}}=-\frac{1}{{{M}_{RS}}}\sum\limits_{i=1}^{{{M}_{RS}}}{{{q}_{i}}\log {{p}_{i}}}$ (19)
Combining formulas (17) and (19), the joint loss function of our feature extraction network can be established as:
$Los{{s}_{total}}=Los{{s}_{cp}}+\rho Los{{s}_{triplet}}$ (20)
where, ρ is the balance factor to strike a balance between metric learning supervision and classification supervision.
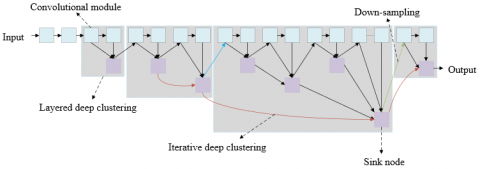
This paper obtains accurate product image features, with the aid of the improved Fourier descriptor and metric learning feature extraction network. As shown in Figure 5, the product image retrieval is realized in three steps: normalizing product image features, similarity measurement and result output, and effect evaluation. In this paper, the multi-attentional multi-class constrained loss function is combined with the cluster attention neural network into a product image retrieval algorithm. Figure 6 shows the structure of the cluster attention neural network, which is improved from the deep clustering network in Figure 7. The obtained product image features can be expressed as:
$F=[{{F}_{1}},\ldots ,{{F}_{E}}]\in {{R}^{W*H*E}}$ (21)
where, F1, ..., FE are the E feature maps corresponding to the input product image.
The feature maps of distinctive feature and shape feature, which are obtained by two network branches, are synthetized by the basic neural network, and then summarized. Then, the summation result is subject to Mask transform by Sigmoid function:
$Mas{{k}_{j}}\left( F \right)=sigmoid\left( \sum\nolimits_{i=1}^{E}{{{F}_{i}}} \right)$ (22)
After Mask transform, every point of each feature map is multiplied with a suitable attention value to obtain the final output:
$AT{{T}_{j}}=\sum\nolimits_{i=1}^{E}{\left( {{F}_{i}}\cdot Mas{{k}_{j}} \right)}$ (23)
Figure 5. Procedure and evaluation of ecommerce product image retrieval
Figure 6. Structure of the proposed neural network
Figure 7. Structure of deep clustering network
In the proposed multi-attentional neural network, the loss function is a multi-attentional multi-class constrained function capable of effectively identifying fine-grained targets. Therefore, the network receives the acquired product image features, and outputs the result of the multi-attentional multi-class constrained loss function. For every data on product image features, it is assigned a unique attention, which contains a class attribute and a serial number attribute, after the entry into the network. In each batch processing of gradient descent, the output attentions are classified based on the attributes. Then, four different sets can be established: the set Wss of samples with the same attention and same class; the set Wsd of samples with the same attention and different classes; the set Wds of samples with different attentions and the same class; the set Wdd of samples with different attentions and different classes.
The set of samples with the same attention and different classes can be expressed as:
$AT{{T}_{+ss}}={{W}_{ss}},AT{{T}_{-ss}}={{W}_{sd}}\bigcup {{W}_{ds}}\bigcup {{W}_{dd}}$ (24)
The set of samples with the same attention and different classes can be expressed as:
$AT{{T}_{+sd}}={{S}_{sd}},AT{{T}_{-sd}}={{S}_{dd}}$ (25)
The set of samples with different attentions and the same class can be expressed as:
$AT{{T}_{+ds}}={{W}_{ds}},AT{{T}_{-ds}}={{W}_{dd}}$ (26)
The Softmax loss function can be combined with the multi-attentional multi-class constrained loss function to obtain the loss function of the entire network:
$Los{{s}_{Sea}}=Los{{s}_{Sof}}+\theta \left( Loss_{ss}^{+-}+Loss_{sd}^{+-}+Loss_{ds}^{+-} \right)$ (27)
where, Loss+-ss, Loss+-sd, and Loss+-ds are three N-pair loss functions:
$Los{{s}^{+-}}=\frac{1}{N}\sum{_{e_{i}^{j}\in \Omega }}\left[ \sum{_{{{e}^{+}}\in AT{{T}^{+}}}\log \left( \text{1}+\sum{_{{{e}^{-}}\in AT{{T}^{-}}}}{{e}^{e{{_{i}^{j}}^{T}}\cdot {{e}^{-}}-e{{_{i}^{j}}^{T}}\cdot {{e}^{+}}}} \right)} \right]$ (28)
Figure 8 shows the image retrieval process based on the constructed neural network. Based on the image features obtained in the previous section, the attention of each sample can be extracted by the cluster attention neural network. The top M attentions in terms of the similarity with attention 1, and the top N attentions in terms of the similarity with attention 2, can be outputted as the retrieval result.
Figure 8. Workflow of ecommerce product image retrieval algorithm
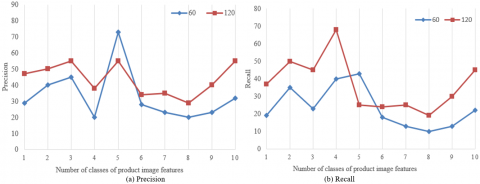
The experiments aim to optimize the dimension of product image eigenvector under different parameter and algorithm scenarios. The image retrieval effect was mainly evaluated by the mean precision and recall. The parameter refers to the number of Fourier descriptor, which determines the similarity of description to product shape. Figure 9 presents the influence of number of Fourier descriptors on retrieval results. The x axis stands for the number of classes of product image features, and the y axis stands for precision or recall. Obviously, the most accurate retrieval was achieved in the presence of 120 Fourier descriptors.
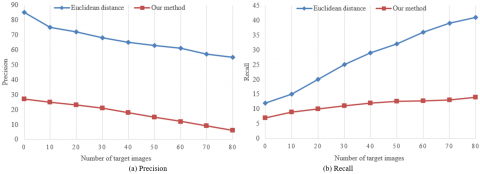
The selection of a reasonable similarity measure is critical to the retrieval effect of product image matching. Figure 10 compares the retrieval results of several similarity measures. It can be seen that the improved Euclidean distance adopted here achieved the highest retrieval accuracy. Further, Figure 11 compares the retrieval results of our feature description algorithm with those of traditional Fourier descriptor and shape context descriptor, both of which can depict the image shape feature. It can be seen that our algorithm with improved Fourier descriptor realized the best accuracy and recall.
In addition, comparative experiments were designed to verify the influence of the parameter setting of triplet loss function on the identification and retrieval of ecommerce products. Table 1 shows the experimental results on the image retrieval precisions at different number of product classes, number of image samples, and value of o. Obviously, the optimal retrieval accuracy was achieved at o=0.4, X=9, and Y=5.
Additional comparative experiments were conducted to reveal how the basic structure of the proposed feature extraction network affects the retrieval accuracy. During the experiments, the dimension of the eigenvector was set to the ideal value. The results in Table 2 shows that the densely connected network achieved a slightly higher (0.1-0.2%) retrieval accuracy than the deep clustering network and widened deep clustering network. Hence, it is reasonable to choose the densely connected network as the basic structure, due to its low overhead in training and testing.
Finally, the retrieval performance of our algorithm was compared with that of multiple image retrieval algorithms. As shown in Table 3, our algorithm realized higher mean average precision (MAP) (0.813%) than traditional hash retrieval, locality-sensitive hash retrieval, minimum loss hash retrieval, hash retrieval with binary reconstructive embeddings, CNN-based hash retrieval, and deep CNN-based hash retrieval. Therefore, it is effective to retrieve ecommerce product images, using the deep clustering network coupled with attention mechanism.
Table 1. Influence of the parameter setting of triplet loss function on retrieval accuracy
|
o |
X |
Y |
Retrieval accuracy |
|
0.1 |
9 |
5 |
95.83% |
|
0.2 |
96.11% |
||
|
0.3 |
96.56% |
||
|
0.4 |
96.74% |
||
|
0.5 |
95.89% |
||
|
0.3 |
5 |
7 |
94.93% |
|
0.3 |
14 |
3 |
95.77% |
Table 2. Influence of deep clustering network structures on retrieval accuracy
|
Network structure |
Image size |
Eigenvector dimension |
Retrieval accuracy |
|
Deep clustering network |
224×224 |
2,048 |
95.42% |
|
1,024 |
95.11% |
||
|
Widened deep clustering network |
448×448 |
2,048 |
96.42% |
|
1,024 |
96.21% |
||
|
Densely connected network |
224×224 |
2,048 |
97.41% |
|
1,024 |
96.52% |
Table 3. Retrieval performance of different algorithms
|
Algorithms |
Product image library |
||
|
24-bit |
48-bit |
Best performance |
|
|
Traditional hash retrieval |
0.2215 |
0.2566 |
0.12743 |
|
Locality-sensitive hash retrieval |
0.2879 |
0.3145 |
0.3246 |
|
Minimum loss hash retrieval |
0.2746 |
0.2934 |
0.2945 |
|
Hash retrieval with binary reconstructive embeddings |
0.4833 |
0.5525 |
0.5733 |
|
CNN-based hash retrieval |
0.6314 |
0.6875 |
0.6954 |
|
Deep CNN-based hash retrieval |
0.7329 |
0.7784 |
0.7603 |
|
Our algorithm |
|
|
0.813% |
Figure 9. Influence of number of Fourier descriptors on retrieval results
Figure 10. Influence of similarity measures on retrieval results
Figure 11. Influence of feature description algorithms on retrieval results
Focusing on the feature extraction and retrieval of ecommerce product images, this paper innovatively introduces the improved Fourier descriptor into a metric learning-based product image feature extraction network, and adopts the attention mechanism to realize accurate retrieval of product images. Specifically, the authors detailed how to acquire the product contour and the axis with minimum moment of inertia, and constructed a feature extraction network based on the metric learning supervision, thereby extracting the shape, distinctive, and classification features of the target product image. After that, the authors expounded on the product image retrieval method based on cluster attention neural network, and verified the proposed retrieval algorithm through contrastive experiments. The results show that our algorithm achieved higher MAP than other methods, and the improved Fourier descriptor led to good precision and recall. Therefore, the deep clustering network coupled with attention mechanism can effectively retrieve ecommerce product images.
The second batch of teaching reform research projects in the 13th Five-Year Plan of Zhejiang Higher Education.
(1) Research on the innovation strategies of teachers' Teaching Reform for the "High-level" Professional Group of E-commerce (NO.: jg20190892).
(2) Research and Practice of Network Entrepreneurship practical teaching system based on "Integration of learning and entrepreneurship" (NO.: jg20190894).
[1] Chen, F., Zabalza, J., Murray, P., Marshall, S., Yu, J., Gupta, N. (2020). Embedded product authentication codes in additive manufactured parts: Imaging and image processing for improved scan ability. Additive Manufacturing, 35: 101319. https://doi.org/10.1016/j.addma.2020.101319
[2] Wang, X.Q. (2019). Computer image processing and Nc carving methods for complex ceramic products. Proceedings-2019 12th International Conference on Intelligent Computation Technology and Automation, ICICTA, Xiangtan, China. https://doi.org/10.1109/ICICTA49267.2019.00143
[3] Chen, Y.B. (2019). Image processing algorithms of Hartmann aberration automatic measurement system based on tensor product network. International Journal of Wireless Information Networks, 26(3): 158-164. https://doi.org/10.1007/s10776-019-00435-w
[4] Hoffmann, R., Notni, G. (2019). Production of a favorable calibration target for the determination of distortions of lenses in image processing. In Photonics and Education in Measurement Science 2019, 11144: 111441C. https://doi.org/10.1117/12.2532544
[5] Greiner, P., Bogatsch, T., Jahn, N., Martins, L., Linß, G., Notni, G. (2019). Requirements for web-based integrated management systems in the production of image processing components. In Photonics and Education in Measurement Science 2019, 11144: 111441D. https://doi.org/10.1117/12.2532572
[6] Murthad, A.Y., Yaseen, A.A., Al-Dabagh, M.Z.N. (2019). Deformation detection and classification system for car parts products using image processing algorithms. In IOP Conference Series: Materials Science and Engineering, 518(4): 042006.
[7] Abbas, H.M.T., Shakoor, U., Khan, M.J., Ahmed, M., Khurshid, K. (2019). Automated sorting and grading of agricultural products based on image processing. In 2019 8th International Conference on Information and Communication Technologies (ICICT), pp. 78-81. https://doi.org/10.1109/ICICT47744.2019.9001971
[8] Muniategui, A., de la Yedra, A.G., del Barrio, J.A., Masenlle, M., Angulo, X., Moreno, R. (2019). Mass production quality control of welds based on image processing and deep learning in safety components industry. In Fourteenth International Conference on Quality Control by Artificial Vision, 11172: 111720L. https://doi.org/10.1117/12.2520578
[9] Jung, H.K., Park, G. (2019). Rapid and non-invasive surface crack detection for pressed-panel products based on online image processing. Structural Health Monitoring, 18(5-6): 1928-1942. https://doi.org/10.1177/1475921718811157
[10] Palacios, D., Gregor, D., Arzamendia, M., Cikel, K., Santacruz, M. (2019). Determination of a computational parameter of quantitative production of crops in hydroponic greenhouses through digital image processing. In 2019 IEEE CHILEAN Conference on Electrical, Electronics Engineering, Information and Communication Technologies (CHILECON), pp. 1-7. https://doi.org/10.1109/CHILECON47746.2019.8987719
[11] Wasim, A., Siddique, M.R., Sajid, M., Hussain, S., Jahanzaib, M., Khan, A.M. (2019). Stress assessment based on Ergonomics coupled with image-processing tools and techniques for lean product design and development. Journal of the Chinese Institute of Engineers, 42(5): 367-376.
[12] Miao, Y.J., Jeon, J.Y., Park, G. (2020). An image processing-based crack detection technique for pressed panel products. Journal of Manufacturing Systems, 57: 287-297. https://doi.org/10.1016/j.jmsy.2020.10.004
[13] Massaro, A., Panarese, A., Dipierro, G., Cannella, E., Galiano, A., Vitti, V. (2020). Image processing segmentation applied on defect estimation in production processes. In 2020 IEEE International Workshop on Metrology for Industry 4.0 & IoT, 565-569. https://doi.org/10.1109/MetroInd4.0IoT48571.2020.9138278
[14] Syberfeldt, A., Vuoluterä, F. (2020). Image processing based on deep neural networks for detecting quality problems in paper bag production. Procedia CIRP, 93: 1224-1229. https://doi.org/10.1016/j.procir.2020.04.158
[15] Byambasuren, B.E., Baasanjav, T., Myagmarjav, T., Baatar, B. (2020). Application of image processing and industrial robot arm for quality assurance process of production. In 2020 IEEE Region 10 Symposium (TENSYMP), pp. 526-530. https://doi.org/10.1109/TENSYMP50017.2020.9230977
[16] Therrell, G. (2019). More product, more process: metadata in digital image collections. Digital Library Perspectives. https://doi.org/10.1108/DLP-06-2018-0018
[17] Fan, L. (2019). Image processing algorithm of Hartmann method aberration automatic measurement system with tensor product model. EURASIP Journal on Image and Video Processing, 2019(1): 1-9. https://doi.org/10.1186/s13640-019-0440-9
[18] Kawattikul, K. (2018). Product Recommendation using Image and Text Processing. In 2018 International Conference on Information Technology (InCIT), pp. 1-4. https://doi.org/10.23919/INCIT.2018.8584860
[19] Sarkar, A., Chakraborty, S., Roy, B. K. (2015). Image processing based product label quality control on FMCG products. In 2015 International Conference on Energy, Power and Environment: Towards Sustainable Growth (ICEPE), pp. 1-5. https://doi.org/10.1109/EPETSG.2015.7510126
[20] Moorthy, R., Behera, S., Verma, S., Bhargave, S., Ramanathan, P. (2015). Applying image processing for detecting on-shelf availability and product positioning in retail stores. In Proceedings of the Third International Symposium on Women in Computing and Informatics, pp. 451-457. https://doi.org/10.1145/2791405.2791533
[21] Anai, S., Iwasaki, M., Hano, K., Kuchii, S. (2017). Identification of medical surgical product and object distinction using image processing. In 2017 9th International Conference on Information Technology and Electrical Engineering (ICITEE), pp. 1-4. https://doi.org/10.1109/ICITEED.2017.8250452
[22] Hazawa, H., Yamada, H., Mori, H. (2019). On near-field 2-D target imaging by using Khatri-Rao product extended array processing. In 2019 International Symposium on Antennas and Propagation (ISAP), pp. 1-2.