Ali Arshaghi* | Mohsen Ashourian | Leila Ghabeli
© 2020 IIETA. This article is published by IIETA and is licensed under the CC BY 4.0 license (http://creativecommons.org/licenses/by/4.0/).
OPEN ACCESS
Feature selection is used in machine learning as well as in statistical pattern recognition. This is important in many applications, such as classification. There are so many extracted features in these applications which are either useless or do not have much information. If not removing these features, make raises the computational burden for the main application. In different methods of feature selection, a subset is selected as the answer, which can optimize the value of an evaluation function. In this study, a new algorithm for classification of Dermoscopy images into two types of malignant and benign are presented. To develop the general skin cancer detection system, at first a pre-processing step is applied to enhance image quality. Then the lesion area is removed from the healthy areas using the Otsu threshold method. Nine shape feature and nine color features are extracted from the segmented image using different optimization schema. At the end of the operation, classification was done by SVM, KNN and Decision Tree methods. The results show that combination of buzzard optimization algorithm for feature extraction and SVM classifier accuracy is 94.3%. This result shows the high potential of buzzard optimization algorithm for feature extraction.
skin cancer, skin lesion, Dermoscopy images, shape and color features, Buzzard Optimization (BUZO) algorithm, feature selection
Skin cancer is sample of deadliest cancer that has grown in recent years in worldwide. However, if the cancer is diagnosed at an early stage, the chance of recovery is greatly increased and is often prevented by simple fragmentation [1].
The conventional way of diagnosing skin cancer is to be observed by a dermatologist and then sampled and tested. Because of different types of skin lesions (cancerous and non-cancerous), as well as their similarities in appearance, are sometimes misdiagnosed by skill professionals. On the other hand, sampling and laboratory testing are costly and time consuming and can cause discomfort to the patient. Therefore, a computerized design capable of detecting malignant lesions would be very useful. In a study conducted in 2013, the performance of a computer diagnostic system was compared to that of a skin specialist doctor (dermatologist), and the results showed that the computer system was more accurate [2].
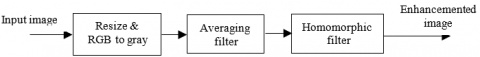
In recent years, many systems and algorithms have been designed to detect malignant or benign lesions using dermoscopic images. Most of these systems have a block diagram of Figure 1 [1].
The feature selection problem is used in machine learning, image processing, statistical pattern recognition. Many extracted features in problem of image processing and machine learning are useless or have little information load, thus if not removing these extra features, the computational burden is increased in the problems [3, 4]. many solutions and algorithms are proposed for problems of the feature selection, and used in the selecting best features.
Some problems have very large datasets and solving the problem is difficult, and have high computational burden [5], for solving these problems proposed algorithms. Several methods of feature selection can find best subset as the answer [6], which applied in optimization the value of an evaluation function.
The features methods choose the best features, these methods are divided into different categories in term of the type of search [7]. the search space becomes smaller in some ways and some ways all possible space is searched. finding the optimal solution is difficult and costly for average and large sets of solutions. By using the classification can be archive and extract information from the image.
Figure 1. Block diagram of malignant skin lesion detection system
One of main problem classification systems is the very number of features and reduce the accuracy of these systems. Also these features have temporal complexity. Therefore, this paper proposes feature selection methods to increase the classification accuracy and reduce their complexity that new feature selection technique is the scavenger (Buzzard) optimization algorithm [8]. We use proposed algorithm in the feature selection section of paper. The results of the simulation of paper are explain. It also examines the feature selection methods that have been applied in the theirs researches in recent years.
There are many Meta-heuristic methods that used in scheduling problems [9, 10], image and video processing [11-18], pattern recognition [19, 20], neural networks tuning [21-27], data clustering [28, 29], and optimal control [30-35], and some of them are inspired by nature [36, 37].
Various approaches optimization algorithm is defined in the group category such as Artificial Fish Swarm Algorithm (AFSA) [38], Artificial Bee Colony (ABC) [39], Ant Colony Optimization (ACO) [40], Particle Swarm Optimization (PSO) [41], Buzzard Optimization Algorithm (BUZO) [8]. Among this method PSO profit from two aspects which particle sets in the search space based on the best personal experience and the best group experience. Implementation of PSO not difficult and its concept is simple, but Buzzard Optimization Algorithm profit from three aspects which particle sets in the search space based on the own Buzzard experience and red-head Turkey vultures experience and predators (wolves and dog) experience. This algorithm is too not difficult and its concept is simple, has low computational cost and high convergence rate and prepare many diversities and exploration rate than to other approaches. This method has initial setting parameters such as initial population particle parameter, inertia weight, smell and vision capability coefficients of each particle. These parameters impact the performance BUZO algorithm.
In this article, a novel way is defined for feature selection by the Buzzard Optimization (BUZO) Algorithm which selects the best feature vector selected from the inputs images. The length of feature vector and dimension of the extracted feature vector are reduced. In this research the Buzzard Optimization (BUZO) Algorithm is described. It is inspired by Buzzard's behavior and method’s prey. The proposed algorithm is similar to PSO.
In the proposed method smell and vision capability of particles are used for regulating inertia weight. the BUZO algorithm has exploration and exploitation mode of optimization that describes in below sections. the proposed method changes the convergence, exploitation and exploration rates of BUZO and in the reason we use the BUZO algorithm for get fit features. The fitness function used for BUZO is F1, F2 defined in section fitness function in this paper. the function applied to the all features. It can obtain the classification rate with this function. We use a learning method after the feature selection step until train the feature subset. Therefore, for these tasks, several classifiers are used such as k-Nearest Neighbor (k-NN), Support Vector Machine (SVM), Decision Tree (DT), and Naıve Bayes (NB) [42].
In this paper, we performed two methods for classifying skin cancer diagnosis, one with a new feature selection method with buzzard optimization algorithm and the other without using this method, which the results of each are presented in the sections of the paper. related works in Section 2. preprocessing in section 3, in section 4 segmentation, in section 5 classification and types of feature extraction methods are explained. The proposed method and the Buzzard Optimization Algorithm (BUZOA) are summarized and illustrated in section 6, and simulation results are expressed in Section 7. Finally, conclusion is described in the last section 8.
Recently proposed methods in field feature selection digital image and studies are done in the feature selection medical image and detection skin cancer. some of them are investigate to feature extraction and feature selection sections. In the bellow section will be stated related works to detection of the skin cancer image.
In 2007, Celie and her colleagues developed a detection system for skin cancer from dermoscopy image [43]. In this study, a method based on JSEG algorithm was applied to detect boundaries lesion. Then two categories of attributes are included color and texture features (GLCM) was extracted from the lesion and then an SVM classification was applied to detection malignancies. This system applied on the database of 655 dermoscopy images and results shown that the accuracy above system is 90%.
In 2010, another algorithm for the diagnosis of skin tumor (melanoma) was presented [44]. In this research used the wavelet transform to upgrades the dermoscopy images (preprocessing). The snake algorithm is used for segmentation of the lesion and then features based on ABCD rules are extracted. These features include irregularity, asymmetry, color scatter, and dependency between colors. MDA_FKT transform was used to reduce the dimension of the features and finally the classification was done by Bayesian method. The proposed heavy-duty identification system detection rate is adjusted between false positive and false negative, and the results show that a false negative rate to measure 1.89% is achievable at an overall accuracy rate of 82.55%.
In the 2013, another algorithm was introduced, in which the fast median filter was used as pre-processing [45]. Then, using the threshold method and maximum entropy, the lesion is removed from the image and features such as contrast, correlation and asymmetry are extracted using GLCM method. Finally, a feed forward neural network performs the classification. The results show that this algorithm has 88% accuracy.
In the year 2013, another study examined the detection of skin cancer in both national and local ways [46]. This research has two goals: determining the best method of detection (global or local) and determining the best features (color or texture features). It is used in the designed experiments of three different classifiers (svm, knn, adaboost) and different features were investigated and significant results were obtained. The results show that using a simple Knn classifier can achieve good results and also the color features perform better performance than to the texture features.
Also, very few features are sufficient for high-precision classification and guarantees an increase in the generality of the system (rather than the use of a large number of features). The results also show that both detection methods (global and local) can produce good results except the local method that requires more time.
In another study conducted in year 2013, the impact of shape features in the classification of dermoscopy images has been investigated [47]. The proposed algorithm includes three steps. First, the image is segmented into manual (by a dermatologist) and automatic (adaptive threshold). Then four types of shape features are obtained of the binary image previous step: Simple shape (SS), Symmetry related (SR), Moment invariants (MI) and Fourier descriptors (FD). then these properties are applied to an Adaboost classifier and the skin lesions are divided into two types of benign and malignant. The results prove that the SS descriptor get the best performance regardless of the type segmentation. Also, by automated segmentation, the best performance is achieved with the simultaneous use of SS and MI descriptors. But when using manually segmentation, the best performance is achieved when using SS, MI and SR features simultaneously, that achieving 92% sensitivity and 78% specificity.
Usually, the dermoscopy images are not very high quality and have different types of noise (Gaussian, impulse, etc.) and many unwanted items (inconsistency of contrast, air bubble and dermoscopy gel and body hair). The above items cause the image segmentation to be incorrect and in addition to the lesion, some of the healthy areas (backgrounds) appear in the segmented image. Therefore, the first step must be made corrections to the input image, including noise removal and artificial effects, contrast adjustment, and so on. Performing a good preprocessing on the original image increases the possibility of high precision segmentation. Different methods and algorithms have been applied to the primary image as pre-processing in the research. In one study, for example, a fast median filter and then contrast adjustment was used to enhance the dermoscopy image [45]. In another study, the Automatic Color Equalization (ACE) algorithm was used to adjust the color of the image [44].
In this study, a three-step pre-processing (Figure 2) was used to enhance the image.
Figure 2. Pre-processing step block diagram
In the first step, size image is evaluated and if the size image is more than 640 x 480 pixels, the size image will be reduced to above size. This task cause increase speeds execution of the algorithm, while not losing much image information. Next step, the color image becomes a gray scale image. Then, a 5x5-dimensional mean filter is exerted to the gray image. By applying this filter, Gaussian noise and sharp edges are eliminated. Finally, a homomorphic filter is used to the image in the frequency domain to eliminate the effect of non-uniform lighting when shooting.
This filter sharpens the edges of the lesion and eliminates the asymmetric lighting effect by weakening the low frequency components. So the image is upgraded and ready for segmentation. Figure 3 shows the results of pre-processing on two sample images.
Figure 3. Image pre-processing results. a) The original image. b) Gray image. c) Enhanced image
At this point, the lesion should be separated from the image. This step is important steps of the algorithm, and the success of next steps (especially feature extraction) depends heavily on this step. For this reason, several studies have examined only the segmentation of the skin lesion. Numerous methods have been used for dermoscopy image segmentation. These include the use of Fuzzy C-Means (FCM) [48], the use of the snake model [49]. use of the threshold fusion model [50], and etc. [51, 52].
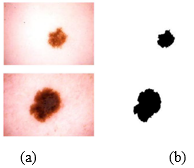
In this study, different segmentation methods including Otsu thresholds, minimum error, maximum entropy and Fuzzy C-Means (FCM) methods were investigated. from the above methods, Otsu and FCM methods have acceptable accuracy and due to the simplicity and speed of the Otsu method, this method was chosen as the segmentation method in this study [53]. because that noise and unwanted effects have been largely eliminated in the pre-processing phase, with a simple threshold, the lesion is well separated from the healthy areas. In fact, proper preprocessing design makes segmentation is done easily and requires no complicated and time consuming algorithms. Post-processing is done after segmentation. First, all the objects in the segmented image are identified, and only the largest ones are considered as lesion (and the rest are deleted). At the end of the cavities created in the image are filled using morphological operators to achieve a uniform image as much as possible. Figure 4 shows the results of applying segmentation to the previous step images.
Figure 4. Image segmentation results. a) The original image. b) binary image
At this point, features of the image must be extracted to perform a high-precision classification operation. In some articles, only ABCD rule-based features (which specialists use to intuitively diagnose skin lesions) have been extracted. Other articles, in addition to the above features, consider other features to improve system performance. In general, the features used can be categorized into several general categories: color-extracted features, region (boundaries lesion)-based features, and texture-based features.
5.1 Survey the shape properties
Extracted the nine shape features from (binary) images. but all have values between zero and one. The relationships between the shape features are given below.
Shape Area: Indicates the ratio of the area of the shape to the all-area of the image.
Centrifugal Indicator: This index is denoted as the ratio of the length of the sub-axis to its main axis.
Circularity Index: This index shows the similarity of the shape to the circular shape.
Length of main and minor axes: Indicates the ratio of the length of the major axes of the figure to the length and width of the whole image.
Rectangular Index: This index is a measure of the similarity of the shape to a rectangle and is expressed as follows.
$Rectangularity=\frac{A s}{A r}$ (1)
where, As is the area of the shape and Ar is the area of the smallest rectangle perimeter to the shape.
Hardness Factor: This coefficient denotes the density or aggregate of the image and is presented as the ratio of the area of the shape to its convex area.
To be.
$Solidity=\frac{\text {Area}}{\text {Convex Area}}$ (2)
Compression Index: This index indicates the degree of irregularity of the boundary shape and is expressed as the ratio of the area of the shape to the area of the circles with the circumference equal to the shape perimeter.
$Compactness =\frac{4 \pi \text { Area }}{\text { pertimeter }^{2}}$ (3)
Convexity: This index expresses the degree of convexity of the shape of the convex state, and is expressed as the ratio of the convex perimeter to the shape perimeter as follows.
$Convexity=\frac{\text { Convexity Pertimeter }}{\text { pertimeter }}$ (4)
To classify images using the above features, 70% of the images were used to train classifier and the rest images were used to test the performance system. By using different classification methods, the effectiveness of the shape features was evaluated, which the results are displayed in Table 1.
As we can see in Table 1, the classification is done using the shape feature, which makes the KNN method more accurate and efficient than the two SVM and Decision Tree methods. And its accuracy reaches 71%. This means that this method recognizes the shape characteristics of skin cancers compared to the two well-compared methods, and where the shape characteristics are important, this KNN classifier can be useful.
Table 1. Classification by shape features
|
Classifier |
Accuracy (%) |
|
KNN (n=5) |
71 |
|
SVM |
63 |
|
Decision Tree |
55 |
5.2 Survey the color properties
First, using the segmented images (binary) and the original images (color), the segmented image of each portion of the RGB color space is obtained. The values of zero were deleted so that for each image, we would have three vectors B, G, and R that were normalized between zero and one and their zero values were eliminated. Then the three mean, minimum and maximum values were extracted from the above three vectors. So we have nine color features for each image. (The variance of each color component was also extracted as an additional feature that was not used because of the reduced classification accuracy). Then, using different classification methods (and percentages mentioned for training and testing), the color features efficiency was evaluated, which the results are presented in the Table 2.
Table 2. Classification by color features
|
Classifier |
Accuracy (%) |
|
KNN (n=5) |
89 |
|
SVM |
93 |
|
Decision Tree |
84 |
As we can see, in Table 2, the classification is done using the color feature, and for each image, we will have three vectors B, G, and R, then for each vector, three characteristics are mean, minimum, and maximum of the above three vectors. Be. So we will have nine color features for each image. The SVM method has better accuracy and performance than the KNN and Decision Tree methods. And its accuracy reaches 93.2%. This means that this method recognizes the color characteristics of skin cancer images better than the two comparative methods, and where color characteristics are important to us, using this SVM classifier will have good performances.
5.3 Simultaneous use of color and shape features
Finally, all the features extracted from the dermoscopy images (including nine color and nine shape features) were evaluated for classification by different methods, which the results are shown in Table 3.
Table 3. Classification by total features (color and shape)
|
Classifier |
Accuracy (%) |
|
KNN (n=5) |
90 |
|
SVM |
94 |
|
Decision Tree |
88 |
As we can see in Table 3, the classification is done using the color and shape feature, and for each image, we have nine the color features and nine the shape features. The SVM method has better accuracy and performance than the KNN and Decision Tree methods. And its accuracy reaches 93.2%. The KNN method has second ranks after the SVM classifier that its accuracy is 91.4%. This means that this method classifies all the features extracted from the dermoscopy images better than the two methods compared. And in matters where color and shape features are important to us, using this SVM classifier can be a good performance.
5.4 Feature selection
the feature vector lengths extracted are very high using the existence methods and may contain irrelevant and extra information. In this reason, feature selection methods are presented. In general, feature selection methods are classified in the four subgroups include of filter, wrapper, embedded and hybrid. Adeli and Broumandnia [42] discussed, an APSO optimization technique for selecting best features of image steganalysis. The BPSO and DAISY feature descriptor used for feature selection when detection handwritten digits [54]. PSO was used to find the best combination of OBFs. PSO can find the global optimal solution, and in this paper used the MD objective function [55].
5.5 Feature extraction for second section paper
In this section of the research we describe some feature extraction methods used in the simulation of this paper. The feature extraction unit is one of the main needed units for image processing applications. The role of the feature extraction module is to reduce the computation volume and eliminate redundancies in the image signal by extracting a limited number of parameters as well as extracting image feature vectors, which are used to characterize the spectral properties of different image signal times. Features extraction is used in various applications such as medical, industrial, machine vision and control, also used in comparison of image based on content-based images. Using mathematical operations, image features such as curves, edges, corners, lines and borders can be extracted, all of features are used in image analysis, making it much easier. At this point, one or more features are selected based on the type of algorithm selected and the properties of the database used. Choosing the right features, depending on the type of images and the type of similarity criterion used, are major challenges in machine vision and image processing. These features can be selected nationally or locally.
In global processing, features are extracted from the whole image. For example, the average brightness intensity of image pixels is a global feature. The advantage of global features is high speed and lower computational load. But these features are incapable of understanding the details of the image and their spatial information. In local processing, features are extracted from a neighborhood of pixels. In some cases, the image is transformed into blocks, the properties of each block individually extracted alongside constitute of the corresponding vector to that image. This actually uses the image location information available. Feature extraction is one of the important steps in machine learning, and if the feature is not well extracted, the decision making algorithm, however it be good, cannot perform well! So it is important to make sure that the appropriate features are presented to the decision maker algorithm (model). In this research we will study several image features extraction methods.
Harris-Stephens algorithm: This algorithm was proposed by Harris and Stephens [56]. This algorithm detects the corners by considering the difference of the prominence corner based on the direct direction. Minimum eigenvalue algorithm: This algorithm was presented by Shi and Tomasi [57] based on the Harris corner detection method but performs slightly better than the original method by slightly changing the selection criterion. MSER Algorithm: This algorithm was presented by Matas et al. [58]. This method is presented for a specific area of the image [59, 60]. FAST algorithm: This algorithm is a corner detection method which it defined by Rosten and Drummond [61], and can be applied to extract feature points. SURF algorithm: This algorithm by Bay et al. [62] was presented as a local feature identifier and its feature is based on Haar wavelet response in the interest point [63, 64]. BRISK algorithm: This algorithm was proposed by Leutenegger et al. [65]. This method has been used to identify, describe, and match key points for a situation where don’t have sufficient background information and camera status. KAZE algorithm: KAZE features are introduced by Alcantarilla et al. in 2012 that use non-linear scale-space by non-linear diffusion filtering [66].
In this paper, feature selection is done based on a new method called of buzzard Optimization algorithm (BUZO) for detecting skin cancer image is defined. This method that defined in three steps: feature selection and fitness function and learning step which will be explained in this section.
6.1 Definitions of buzzard optimization algorithm and feature selection step
The noteworthy contribution in this article is the feature selection stage. There are various feature extraction methods, including SIFT, SURF, KAZE, HOG, MSER, BRISK, LBP, GLCM, MOMENT, etc. that are used for the feature extraction problem. In this paper, we acquire feature vectors by using the feature extraction methods from image datasets. when feature vectors be long, the storage and computation cost of a skin cancer detection system is increase, so must be select the main feature or remove the incompatible feature. In this research, we propose a feature selection method in term of use proposed optimization algorithm for getting fit feature subset. The concept of the BUZO algorithm explain as follows.
BUZO is an optimization algorithm that used the initial population. Buzzards have few characters and we use this character, then create this algorithm in term of its manners and life style of a group buzzard, such as these specifics; flying over the head of the animal which is dying, smelling dead creatures, way of hunting, The defense method. There have strong smell and visual sense. In this group each particle (Buzzard) take the two vectors, the ability vector and the position vector in the search space. New position is depended to the two vectors and achieved best position in three modes [8].
There are three state in the Buzzard algorithm for extra studying refer to [8]. position vector is $l_{i},$ and the $C_{i}$ is vector of the ith particle, the best position of i particle is $C_{i, \text {best}}^{*}$, The best position in the whole particle is $C_{g, \text {best}}^{*}$, achieve the best position of each particle ($C_{i, \text {best}}^{*}$) and best position among all particles ($C_{g, \text {best}}^{*}$), we select the position of each particle as the best location achieved for that particle in the first iteration $(t=1)$ [8].
$C_{i, b e s t}^{*}=L_{i}(t), i=1,2,3, \ldots d$ (5)
$\operatorname{cost}\left(C_{i, b e s t}^{*}\right)=\operatorname{cost}\left(L_{j}(t)\right)$ (6)
The bellow equations are used for changing location and cost of each particle in the process iteration algorithm [8].
$\left\{\begin{array}{l}\text {if } \operatorname{cost}\left(L_{i}(t)\right)<\operatorname{cost}\left(C_{i, \text {best}}^{*}\right) \\ else Not change\end{array}\right.$$\Rightarrow$$\left\{\begin{array}{l}\operatorname{cost}\left(C_{i, b e s t}^{*}\right)=\operatorname{cost}\left(L_{j}(t)\right) \\ C_{i, b e s t}^{*}=L_{i}(t)\end{array}\right.$$i=1,2,3 \dots d$ (7)
buzzard Optimization algorithm for Feature Selection (BUZO-FS) for updating the location of each particle, we use the following equations [8]:
$L_{1}(t)=\alpha_{1} L(t-1)+\alpha_{2} * \operatorname{rand} *\left(C_{i, \text {best}}^{*}-C_{i}(t-1)\right)$ (8)
$\begin{aligned} L_{2}(t)=L_{1}(t)+& \beta * r a n d_{1} *\left(C_{s}(t)-C_{i}(t-1)\right) \\ &+(1-\beta) * r a n d_{2} \\ & *\left(C_{v}(t)-C_{i}(t-1)\right)+\gamma * r a n d_{1} \\ & *\left(C_{g, b e s t}^{*}-C_{i}(t-1)\right)+(1-\gamma) \\ & * \operatorname{rand}_{2} *\left(C_{g, b e s t}^{*}-C_{i}(t-1)\right) \end{aligned}$ (9)
$L_{i}(t)=L_{i}(t-1)+C_{i}(t)$ (10)
$\alpha_{1}$: the inertia weighting factor, used in the insider path $\alpha_{2}$, $\beta$, $\gamma$ define the training constant coefficient. rand1, rand2 are two random number which one of values is between [0 1] and have uniform distribution. Updating the ability vector each particle is defined in term of bellow equation [8]:
$C_{1}(t)=\alpha_{1} C(t-1)+\alpha_{2} *$rand$*\left(C_{i, \text {best}}^{*}-l_{i}(t-1)\right)$ (11)
$\begin{aligned} C_{2}(t)=C_{1}(t)+& \beta * \operatorname{rand} *\left(C_{s}(t)-C_{i}(t-1)\right) \\ &+(1-\beta) * \text { rand } *\left(C_{v}(t)-C_{i}(t-1)\right) \\ &+\gamma * *\left(C_{g, \text { best }}^{*}-l_{i}(t-1)\right) \end{aligned}$ (12)
$C_{i}(t)=C_{i}(t-1)+L_{i}(t)$ (13)
where, $\alpha_{1}, \alpha_{2}, \beta, \gamma$ are determined experimentally by considering the problem.
6.2 Fitness function
In this stage of algorithms, we survey the fitness function and state which each particle how can be show fit solution. Each of the algorithm evaluation criteria can be used to examine the answers in the buzzard algorithm. In this paper, two evaluation criteria with formulas F1 and F2 are considered as objective functions by relationships 16, 17 whose purpose is to minimize their value for the optimization and classification problem. The results are given in the results section if each of them is considered as a target function. In most cases, the fitness function and the objective function are similar to each other, both of them minimizing or maximizing given fitness function.
The fitness function gives us an indication of how the particles performance in the problem space. For example, if goal is minimization in a problem then the most appropriate particle is that, its objective function has the least value. This raw information is usually used as an intermediate step in determining the relative efficiency of particles in a buzzard algorithm. This function is used to convert the values of the target function to a measure for relative compatibility and efficiency with particle. fitness function values are considered positive. Therefore, in cases where the objective function value is negative, one of the fitness function tasks is doing positive these values. Slow and fast computation the fitness function can affect on the algorithm and make the algorithm being slow or fast. the amount of the fitness function is repeated in an algorithm frequently. After computing of the ability, the following sigmoidal function is applied to acquire a threshold from ability:
$S\left(C_{i}(t)\right)=\frac{1}{1+\exp \left(-C_{i}(t)\right)}$ (14)
and the binary position of each particle is state in term of relation follows:
$L_{i}(t)=\left\{\begin{array}{l}1, \text { if } \rho_{i}<s\left(C_{i}(t)\right) \\ 0, \text { if } \rho_{i}<s\left(C_{i}(t)\right)\end{array}\right.$ (15)
where, ρi is a random number in the range [0, 1] and has uniform distribution.
We implementation two components in the BUZO algorithm, one is definition of the particle and others is fitness function for evaluate the particle. These components have main role in implementation algorithm. Sake achieve our objective. The maximum number of features is as the length of the particle, and the particle is getting a binary value randomly. the fitness function for this research states, the following equation.
$\begin{aligned} \min F_{1}(x)=a_{1}(&\operatorname{norm}(\operatorname{Avg}(x)-\operatorname{Avg}(y))) \\ &+a_{2}(\operatorname{norm}(\operatorname{Avg}(w)-(z)))+\cdots \\ &+a_{k}(\operatorname{norm}(\operatorname{Avg}(\beta)-\operatorname{Avg}(\alpha))) \end{aligned}$ (16)
$\begin{aligned} F_{2}(x)=\frac{\text {time}}{\max (\text {time})} & \text {or } F_{2} \\ &=b_{1} \times \operatorname{time}\left(b_{1}\right)+b_{2} \times \operatorname{time}\left(b_{2}\right)+\cdots \\ &+b_{k} \times \operatorname{time}\left(b_{k}\right) \end{aligned}$ (17)
$\begin{aligned} F_{\text {Total}}=\min \left(F_{1}\right.&\left.+F_{2}\right) \\ &=(1-\sqrt{\left|\operatorname{Avg}(H)^{2}-\operatorname{Avg}(D)^{2}\right|^{2}}) \\ &+\frac{\operatorname{time}}{\max (\text {time})} \end{aligned}$ (18)
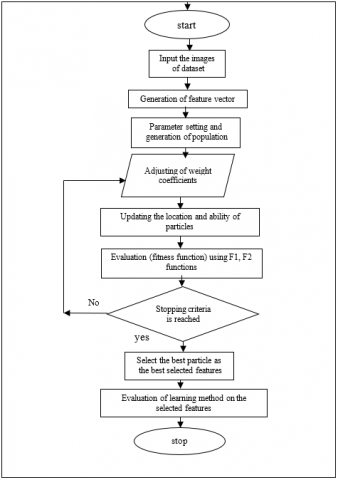
a,b, is the number of selected features (NOSF), the sum of a+b is the maximum number of features. The structures of BUZO is shown in Figure 5. we using the F2 function because the system is straightaway and feasible.
Figure 5. Flowchart of BUZO algorithm [8]
Table 4. Calculating mean features applied in the paper 15 images
|
|
Weight coefficient |
Features |
Skin healthy |
Skin cancer |
abs(m(He)-m(De)) |
Time |
|
1 |
a1 |
SIFT |
0.3512 |
0.1518 |
0.1994 |
18.2121 |
|
2 |
a2 |
SURF |
95.9625 |
29.8290 |
66.1335 |
2.6360 |
|
3 |
a3 |
KAZE |
105.5005 |
34.5726 |
70.9278 |
2.1931 |
|
4 |
a4 |
HOG |
0.0725 |
0.0543 |
0.0182 |
1.6967 |
|
5 |
a5 |
MSER |
184.5486 |
79.5136 |
105.0350 |
2.9694 |
|
6 |
a6 |
BRISK |
140.2905 |
41.7016 |
98.5888 |
7.5930 |
|
7 |
a7 |
LBP |
0.0633 |
0.0214 |
0.0419 |
2.9878 |
|
8 |
a8 |
GLCM |
839.0787 |
263.7361 |
575.3426 |
1.6772 |
|
8-a |
a9 |
Glcm Contrast |
3.6527 |
2.0799 |
1.5728 |
1.6772 |
|
8-b |
a10 |
Glcm Correlation |
0.7739 |
0.2482 |
0.5257 |
1.6772 |
|
8-c |
a11 |
Glcm Energy |
0.5928 |
0.1301 |
0.4627 |
1.6772 |
|
8-d |
a12 |
Glcm Homogeneity |
0.9348 |
0.2962 |
0.6386 |
1.6772 |
|
9 |
a13 |
$\varphi_{1}$ moment |
3.8172 |
0.2502 |
3.5670 |
1.6368 |
|
10 |
a14 |
$\varphi_{2}$ moment |
0.1524 |
0.0088 |
0.1436 |
1.6368 |
|
11 |
a15 |
$\varphi_{3}$ moment |
3.2849 |
0.0026 |
3.2823 |
1.6368 |
|
12 |
a16 |
$\varphi_{4}$ moment |
2.4511 |
3.0558e-04 |
2.4508 |
1.6368 |
|
13 |
a17 |
$\varphi_{15}$ moment |
13.5048 |
-8.2186e-07 |
13.5048 |
1.6368 |
|
14 |
a18 |
$\varphi_{6}$ moment |
-1.5459 |
-2.5920e-05 |
1.5459 |
1.6368 |
|
15 |
a19 |
$\varphi_{7}$ moment |
20.5737 |
-7.5698e-07 |
20.5737 |
1.6368 |
|
16 |
a20 |
$\varphi_{8}$ moment |
-2.4607 |
-1.4243e-04 |
2.4605 |
1.6368 |
Table 5. Calculating mean features applied in the paper 45 images
|
|
Weight coefficient |
Features |
Skin healthy |
Skin cancer |
abs(m(He)-m(De)) |
Time |
|
1 |
a1 |
SIFT |
0.5127 |
0.5698 |
0.0571 |
53.1707 |
|
2 |
a2 |
SURF |
99.4751 |
98.4558 |
1.0193 |
2.1315 |
|
3 |
a3 |
KAZE |
104.8239 |
113.1301 |
8.3062 |
4.4007 |
|
4 |
a4 |
HOG |
0.1125 |
0.0952 |
0.0173 |
2.4853 |
|
5 |
a5 |
MSER |
120.3400 |
198.7244 |
78.3844 |
5.4425 |
|
6 |
a6 |
BRISK |
140.6136 |
149.2092 |
8.5956 |
20.6718 |
|
7 |
a7 |
LBP |
0.0650 |
0.0656 |
5.5052e-04 |
5.5553 |
|
8 |
a8 |
GLCM |
868.9099 |
283.0093 |
585.9006 |
2.0101 |
|
8-a |
a9 |
Glcm Contrast |
2.0405 |
1.0383 |
1.0022 |
2.0101 |
|
8-b |
a10 |
Glcm Correlation |
0.7739 |
0.2901 |
0.4838 |
2.0101 |
|
8-c |
a11 |
Glcm Energy |
0.6519 |
0.1502 |
0.5017 |
2.0101 |
|
8-d |
a12 |
glcmHomogeneity |
0.9636 |
0.3148 |
0.6488 |
2.0101 |
|
9 |
a13 |
$\varphi_{1}$ moment |
0.2078 |
0.2565 |
0.0487 |
2.8510 |
|
10 |
a14 |
$\varphi_{2}$ moment |
0.0017 |
0.0073 |
0.0056 |
2.8510 |
|
11 |
a15 |
$\varphi_{3}$ moment |
0.0012 |
0.0018 |
5.2783e-04 |
2.8510 |
|
12 |
a16 |
$\varphi_{4}$ moment |
3.4811e-05 |
4.7550e-04 |
4.4069e-04 |
2.8510 |
|
13 |
a17 |
$\varphi_{5}$ moment |
2.6780e-09 |
1.0192e-07 |
9.9244e-08 |
2.8510 |
|
14 |
a18 |
$\varphi_{6}$ moment |
1.3458e-06 |
-9.7415e-07 |
2.3200e-06 |
2.8510 |
|
15 |
a19 |
$\varphi_{7}$ moment |
-3.0258e-09 |
1.6707e-07 |
1.7010e-07 |
2.8510 |
|
16 |
a20 |
$\varphi_{8}$ moment |
-1.7588e-05 |
-2.5366e-04 |
2.3607e-04 |
2.8510 |
In Tables 4 and 5, the second column is the weighting coefficients of each feature obtained by the proposed buzzard algorithm. We calculate the average of the features obtained from each set of input images. We write these averages for healthy image and skin cancer image after we get it in the respective column. For example, the number shown in the surf feature row is averages 45 features of the healthy skin images and again the number shown in the next column is the average 45 features of the skin cancer image. Just the sixth, these two numbers have gone deduce, which will use later. The last column is the time taken to get 45 features of the input image. Table 4 tests for 30 input images (15 healthy images and 15 skin cancer images) and Table 5 tests on the 90 images (45 healthy images and 45 skin cancer images).
Different features use in the simulation this paper such as SIFT, SURF, KAZE, HOG, MSER, BRISK, LBP, GLCM, MOMENT features. In according to F1, F2 functions we select the three type features in the features selection stage. These three features are MOMENT, GLCM, SURF. in this paper for easily implementation use the SURF feature in simulation process, but can be use also MOMENT, GLCM features.
6.3 Learning stage
This section is training and testing for detecting skin cancer images. Since the main purpose of the article is to classify the skin image into healthy and cancer image classes, it is necessary use the learning method in term of feature vectors extracted from the set of training and testing. We use different classifiers like SVM, Decision Tree (DT), Na¨ıve Bayes (NB) and k-NN used to train and classification the selected feature. SVM has a Hyperplane that divides the set of positive and negative samples by the maximum margin. If we draw two parallel border plates to the categorization page and divide the two pages far enough to collide with the data. The category page that has the most distance from the border pages will be the best separator. SVM has best results in this case.
By using the kernel function can be the data points are transformed to the next space. This article uses linear SVM (SVM to linear kernel). An SVM uses a mechanism for specifying a spectral hyperplane separator of training data in which a core function transmits the data to the next space to fit this hyperplane onto the input data [67, 68]. Therefore, the right choice of a core function has a direct influence on SVM performance.
The k nearest algorithm is a learning algorithm. this algorithm is used for estimate the distribution density function of training data and classification of test data than to training patterns. Its purpose is to find the best class for a data so that it has the least distance with its member of class.
We use the feature selection methods by BUZO algorithm which select the best features and use the them on the entire dataset to keep the important and best features or to eliminate the irrelevant features. At the feature selection stage, remains the features which have high values than to threshold, but features which have below values than to threshold is deleted, then we use the classification method. so the trained model is exerted on the test set to specify images to the healthy skin image or cancer skin image classes. The flowchart of the BUZO methods is shown in Figure 5.
The algorithm advantages and the convergence test of this algorithm are thorough explained in the study [8].
In this section, BUZO method is compared with different feature selection methods and with IFAB method [69] based on the number selected features. classification accuracy also is specific. four variables used in the below equations; True Positive (TP), False Positive (FP), True Negative (TN) and False Negative (FN).
$Accuracy=\frac{T P+T N}{T P+F P+T N+F N}$ (19)
The performance of BUZO is examined with several feature selection methods such as: ABC, PSO. This method is analyzed and show in simulation section tables.
In this paper we used the skin cancer image dataset in 2 part A, B. The dataset contains 200 images for simulation. We study several feature extraction and method in this paper. It should be noted that some of the images in this article have been obtained from Internet sites trusted by dermatologists, and others have been obtained as actual data from hospitals. And according to the color and shape and skin lesions and light intensity, images are divided into two different categories and have different types of noise (Gaussian, impulse, etc.) and several unwanted cases (non-uniformity of contrast, the presence of air bubbles and gel in dermoscopy and body hair). We used two prepared two database, call them A taken from reference [70-72], and B which is taken from reference [73-75]. Both are collected from recognized sources.
Determining the extent of the lesion and in a way extracting the exact boundary between the lesion and the background is one of the primary and very effective parameters in the correct features extraction of image. Based on this extent, in each data set group, an attempt has been made to use these types of extent and volume of the skin.
The length of feature vectors on A and B dataset methods are 532 and 684 and these features used in the simulation section, respectively. Most Data Set Images Used for Training, 80% of dataset is used for training and 20% for testing. The evaluation process will continue and repeat until the test section is fully implemented and run on all sections. Some parameters use for proposed methods, setting of parameters are, maximum iteration is 100, the population size is set to 100, both of C1and C2 are set to 2 [76, 77], and the parameter α is 0.2. The flowchart of the proposed feature selection method and entire process algorithm is shown in Figure 6.
Figure 6. Flowchart of proposed feature selection technique
In Table 6, the classification accuracy BUZO feature selection is compared whit ABC and PSO feature selection method. In this feature selection methods, we use the three type classifier NB, DT and SVM on the A, B Dataset that reported in Table 1. the IFAB method is a combination two section, one of is ABC algorithm for the feature selection and second section is SVM classifier. ABC gets the best rank in the percentage of feature reduction and BUZO has second rank in the percentage of feature reduction but has firs rank in the selected feature accuracy, BUZO than to the PSO has a higher percentage of feature removal and show the performance BUZO classification accuracy is high to other applied classifiers. According to Table 1, is proved BUZO's superiority to PSO algorithm. Number of selected features element are 532 features. ABC select the 110 features element from the all features. Some features may be deleted in feature selection process.
We implemented the proposed method on the B dataset. For comparing BUZO algorithm with other feature selection methods we using the ABC and PSO method and the results repot in Table 3. in feature removal item ABC has the best results and BUZO getting the second-best ranking but in the selected feature accuracy BUZO has best rating and PSO is as the second-highest-ranking method. It can be seen from table 7 that the PSO in percentage feature reduction does not have good performs, the classification accuracy PSO is higher toward to the ABC accuracy.
Table 6. Classification accuracy by ABC, PSO, BUZO optimization ways on A dataset
|
Measure feature selection by using Optimization algorithm |
|||||||||
|
|
ABC |
PSO |
BUZO |
||||||
|
|
NB |
DT |
IFAB |
NB |
DT |
SVM |
NB |
DT |
SVM |
|
No. of selected features |
110 |
180 |
170 |
||||||
|
Selected feature Accuracy (%) |
56.02±0.18 |
58.03±0.25 |
62.02±1.02 |
67.81±0.74 |
70.83±1.05 |
73.09±1.03 |
75.93±0.12 |
79.65±0.05 |
84.04±0.2 |
|
Reduction in Feature (%) |
79.32 |
66.16 |
68.04 |
||||||
|
No. of primary features |
532 |
||||||||
|
Increase in Accuracy (%) |
0.6 decrease |
0.5 increase |
4 increase |
10.06 increase |
14.23 increase |
17.64 increase |
16.93 increase |
18.81 increase |
25.71 increase |
Table 7. Classification accuracy by ABC, PSO, BUZO optimization ways on B dataset
|
Measure feature selection by using Optimization algorithm |
|||||||||
|
|
ABC |
PSO |
BUZO |
||||||
|
|
NB |
DT |
IFAB |
NB |
DT |
SVM |
NB |
DT |
SVM |
|
No. of selected features |
148 |
288 |
262 |
||||||
|
Selected feature Accuracy (%) |
63.81±0.8 |
65.01±0.73 |
67.97±1.64 |
71.06±0.03 |
74.87±0.36 |
75.98±1.61 |
81.03±1.79 |
84.06±2.11 |
89.64±2.32 |
|
Reduction in Feature (%) |
78.37 |
57.09 |
61.69 |
||||||
|
No. of primary features |
684 |
||||||||
|
Increase in Accuracy (%) |
0.4 decrease |
0.5 increase |
3.96 increase |
6.14 increase |
9.76 increase |
11.04 increase |
15.82 increase |
17.02 increase |
23.08 increase |
Table 8. Comparing methods on A and B dataset on based on (a) classification accuracy and (b) running time
|
Dataset |
ABC-NB |
ABC-DT |
k-NN |
IFAB |
BUZO |
|
(a) Classification accuracy (%) |
|||||
|
A |
56.02±0.18 |
58.03±0.25 |
60.47±2.73 |
62.02±1.02 |
84.04±0.2 |
|
B |
64.81±0.8 |
65.01±0.73 |
67.03±1.21 |
67.97±1.64 |
89.64±2.32 |
|
(b) Running time (in ms) |
|||||
|
A |
343.6 |
302.6 |
239.63 |
321.03 |
263.16 |
|
B |
323 |
272.83 |
208.76 |
293.8 |
217.34 |
Figure 7 shows the performance of BUZO feature selection on the three type classifiers DT, NB, SVM and show their feature selection accuracy. the SVM classifier has best performance to the rest.
In the method without using the feature selection, there are many features in the image that some are important and some features are not important, but in the calculation process, it is used that increases the computational load and this is a major problem of these methods and causes Reduces the implementation process of the program and increases its execution time, which is not used for practical and real-time tasks due to the slowness of this method. Naturally, without using the methods of feature selecting the computational complexity of the algorithms used and the time spent to find the features of the data images, be high. it becomes more time consuming, costly, and impractical, and they have a lot of computational complexity. However, in the feature selection method, these defects have been eliminated. The issue of feature selection is one of the topics of machine learning as well as statistical pattern recognition. This is important in many applications (such as classification) because there are many features in these applications, many of which are useless or have little information load. Deleting these features does not cause any problems with the information, but increases the computational load for the intended program. And as time goes on, besides, we also store a lot of useless information along with useful data. Different methods of feature selection try to find the best subset of the candidate subset. In all of these feature selection methods, based on the application and type of definition, a subset is selected as the answer, which can optimize the value of a fitness function.
Figure 7. the performance of BUZO feature selection method on several classifiers
Figure 8. Comparison of the classification accuracy applied ways on A
Figure 9. Comparing of the classification accuracy applied methods on A and B dataset
Figure 10. A comparison of several ways on the number of selected features in the two groups
Several classifiers with together are compared in Table 8, such as ABC-NB, ABC-DT, k-NN [78], and IFAB [53, 69] in on both of A and B based on classification accuracy and running time. BUZO use the SVM classifier in this test.
By using the new fitness function in proposed methods, we acquire best performance and classification accuracy on the used dataset. The k-NN approach has simple construction and classification, this method has the minimum running time. BUZO method has the second-best method after the k-NN approach in the running time and running time proposed method is lower than to IFAB method, because two reasons: one reason is in BUZO algorithm search property is fast and second reasons is BUZO algorithm inertia weight is suitable. and the convergence is towards the global best solution in each of states. BUZO algorithm have three states and always we select the global best solution in the each of states. the classification methods results applied in this paper on A and B dataset are depicted in Figure 8 and 9 respectively.
In Table 9 we show number of used features by feature selection methods and compare them on A and B datasets. the proposed BUZO method selects large features than to the rest feature selection methods. For achieve best solution and important feature elements and helps to raise performance classification we proposed New fitness function in BUZO algorithm. According to the Number of selected features any methods can infer the classification accuracy. Output results Table 6 is displayed in Figure 10.
BUZO algorithm method can be control the exploration and exploitation search ways in the search space and process, and is main features of proposed model and this result is proved in the simulation results thus this method is effective.
Table 9. Comparison of several feature selection methods on both A and B based on number the selected features
|
Dataset Feature selection method |
||||
|
|
ABC-NB |
ABC-DT |
ABC-SVM |
BUZO |
|
A dataset (532) |
110 |
110 |
110 |
170 |
|
B dataset (684) |
148 |
148 |
148 |
262 |
In this article, a novel method is proposed for feature selection of input images in term of BUZO optimization procedure. The BUZO method utilizes and adapts to inertia weight by using fitness function and diversity parameters during the optimization process. This way is studied on feature vectors which extracted by several feature extraction approach on the two group A and B skin dataset (healthy and skin cancer image). By comparing this feature selection method than to other feature selection methods can be realized which proposed methods had the best performance. However, the BUZO feature selection method selects many features compared to the rest feature selection procedure, but the effect of selected features is important in the optimization process. In this proposed method classification accuracy is proved on the selected feature and this specific’s method shows the superiority it. In terms of selected features, the classification task is done. The BUZO algorithm has good results in global optima achievement and fast convergence.
[1] Hoshyar, A.N., Al-Jumaily, A., Sulaiman, R. (2011). Review on automatic early skin cancer detection. International Conference on Computer Science and Service System (CSSS), Nanjing, pp. 4036-4039. http://dx.doi.org/10.1109/CSSS.2011.5974581
[2] Zortea, M., Schopf, T.R., Thon, K., Geilhufe, M., Hindberg, K., Kirchesch, H., Møllersen, K., Schulz, J., Skrøvseth, S.O., Godtliebsen, F. (2014). Performance of a dermoscopy-based computer vision system for the diagnosis of pigmented skin lesions compared with visual evaluation by experienced dermatologists. Artificial Intelligence in Medicine, 60(1): 13-26. https://doi.org/10.1016/j.artmed.2013.11.006
[3] Kavzoglu, T., Colkesen, I., Yomralioglu, T. (2015). Object-based classification with rotation forest ensemble learning algorithm using very-high-resolution WorldView-2 image. Remote Sensing Letters, 6(11): 834-843. https://doi.org/10.1080/2150704X.2015.1084550
[4] Liu, D.S., Xia, F. (2010). Assessing object-based classification: Advantages and limitations. Remote Sensing Letters, 1(4): 187-194. http://dx.doi.org/10.1080/01431161003743173
[5] Laliberte, A.S., Browning, D.M., Rango, A. (2012). A comparison of three feature selection methods for object-based classification of subdecimeter resolution UltraCam-L imagery. International Journal of Applied Earth Observation and Geoinformation, 15: 70-78. https://doi.org/10.1016/j.jag.2011.05.011
[6] Kodovsky, J., Fridrich, J. (2012). Steganalysis of JPEG images using rich models. Proceedings of SPIE. Electronic Imaging, Media Watermarking, Security, and Forensics, 8303. https://doi.org/10.1117/12.907495
[7] Moradi, P., Rostami, M. (2015). A graph theoretic approach for unsupervised feature selection. Engineering Applications of Artificial Intelligence, 44: 33-45. http://dx.doi.org/10.1016/j.engappai.2015.05.005
[8] Arshaghi, A., Ashourian, M., Ghabeli, L. (2019). Buzzard optimization algorithm: A nature-inspired metaheuristic algorithm. Majlesi Journal of Electrical Engineering, 13(3): 83-98.
[9] Goldansaz, S.M., Jolai, F., Anaraki, A.H.Z. (2013). A hybrid imperialist competitive algorithm for minimizing makespan in a multi-processor open shop. Applied Mathematical Modelling, 37(23): 9603-9616. https://doi.org/10.1016/j.apm.2013.05.002
[10] Suresh, K., Kumarappan, N. (2013). Hybrid improved binary particle swarm optimization approach for generation maintenance scheduling problem. Swarm and Evolutionary Computation, 9: 69-89. http://dx.doi.org/10.1016/j.swevo.2012.11.003
[11] Draa, A., Bouaziz, A. (2014). An artificial bee colony algorithm for image contrast enhancement. Swarm and Evolutionary Computation, 16: 69-84. http://dx.doi.org/10.1016/j.swevo.2014.01.003
[12] Fornarelli, G., Giaquinto, A. (2013). An unsupervised multi-swarm clustering technique for image segmentation. Swarm and Evolutionary Computation, 11: 31-45. http://dx.doi.org/10.1016/j.swevo.2013.02.002
[13] Moallem, P., Razmjooy, N. (2012b). Optimal threshold computing in automatic image thresholding using adaptive particle swarm optimization. Journal of Applied Research and Technology, 10(5): 703-712. http://dx.doi.org/10.22201/icat.16656423.2012.10.5.361
[14] Moallem, P., Razmjooy, N., Mousavi, B.S. (2014). Robust potato color image segmentation using adaptive fuzzy inference system. Iranian Journal of Fuzzy Systems, 11(6): 47-65. http://dx.doi.org/10.22111/IJFS.2014.1748
[15] Mousavi, B.S., Sargolzaei, P., Razmjooy, N., Hosseinabadi, V., Soleymani, F. (2011). Digital image segmentation using rule-base classifier. American Journal of Scientific Research, 17-23.
[16] Mousavi, B.S., Soleymani, F., Razmjooy, N. (2014). Semantic image classification by genetic algorithm using optimised fuzzy system based on Zernike moments. Signal, Image and Video Processing, 8(5): 831-842. http://dx.doi.org/10.1007/s11760-012-0311-7
[17] Razmjooy, N., Mousavi, B.S., Sadeghi, B., Khalilpour, M. (2011). Image thresholding optimization based on imperialist competitive algorithm. 3rd Iranian Conference on Electrical and Electronics Engineering (ICEEE2011).
[18] Razmjooy, N., Mousavi, B.S., Sargolzaei, P., Soleymani, F. (2011). Image thresholding based on evolutionary algorithms. International Journal of Physical Sciences, 6(31): 7203-7211.
[19] Suganthan, P.N. (2002). Structural pattern recognition using genetic algorithms. Pattern Recognition, 35(9): 1883-1893. http://dx.doi.org/10.1016/S0031-3203(01)00136-4
[20] Garai, G., Chaudhurii, B.B. (2013). A novel hybrid genetic algorithm with Tabu search for optimizing multi-dimensional functions and point pattern recognition. Information Sciences, 221: 28-48. http://dx.doi.org/10.1016/j.ins.2012.09.012
[21] Malviya, R., Pratihar, D.K. (2011). Tuning of neural networks using particle swarm optimization to model MIG welding process. Swarm and Evolutionary Computation, 1(4): 223-235. http://dx.doi.org/10.1016/j.swevo.2011.07.001
[22] Azadeh, A., Seif, J., Sheikhalishahi, M., Yazdani, M. (2015). An integrated support vector regression–imperialist competitive algorithm for reliability estimation of a shearing machine. International Journal of Computer Integrated Manufacturing, 29(1): 16-24. https://doi.org/10.1080/0951192X.2014.1002810
[23] Mousavi, S.M., Tavakkoli-Moghaddam, R., Vahdani, B., Hashemi, H., Sanjari, M.J. (2013). A new support vector model-based imperialist competitive algorithm for time estimation in new product development projects. Robotics and Computer-Integrated Manufacturing, 29(1): 157-168. http://dx.doi.org/10.1016/j.rcim.2012.04.006
[24] Moallem, P., Razmjooy, N. (2012a). A multi layer perceptron neural network trained by invasive weed optimization for potato color image segmentation. Trends in Applied Sciences Research, 7(6): 445. http://dx.doi.org/10.3923/tasr.2012.445.455
[25] Razmjooy, N., Mousavi, B.S., Soleymani, F. (2013). A hybrid neural network Imperialist Competitive Algorithm for skin color segmentation. Mathematical and Computer Modelling, 57(3-4): 848-856. http://dx.doi.org/10.1016/j.mcm.2012.09.013
[26] Razmjooy, N., Ramezani, M. (2016). Training wavelet neural networks using hybrid particle swarm optimization and gravitational search algorithm for system identification. International Journal of Mechatronics, Electrical and Computer Technology (IJMEC), 6(21): 2987-2997.
[27] Razmjooy, N., Sheykhahmad, F.R., Ghadimi, N. (2018). A hybrid neural network–world cup optimization algorithm for melanoma detection. Open Medicine, 13(1): 9-16. http://dx.doi.org/10.1515/med-2018-0002
[28] Senthilnath, J., Omkar, S.N., Mani, V. (2011). Clustering using firefly algorithm: Performance study. Swarm and Evolutionary Computation, 1(3): 164-171. http://dx.doi.org/10.1016/j.swevo.2011.06.003
[29] Nanda, S.J., Panda, G. (2014). A survey on nature inspired metaheuristic algorithms for partitional clustering. Swarm and Evolutionary Computation, 16: 1-18. http://dx.doi.org/10.1016/j.swevo.2013.11.003
[30] Hosseini, H., Farsadi, M., Khalilpour, M., Razmjooy, N. (2011). Hybrid energy production system with PV Array and wind turbine and pitch angle optimal control by genetic algorithm (GA). Journal of Electrical Engineering and Technology, 1(1).
[31] Hosseini, H., Farsadi, M., Lak, A., Ghahramani, H., Razmjooy, N. (2012). A novel method using imperialist competitive algorithm (ICA) for controlling pitch angle in hybrid wind and PV array energy production system. International Journal on Technical and Physical Problems of Engineering (IJTPE), (11): 145-152.
[32] Hosseini, H., Tousi, B., Razmjooy, N., Khalilpour, M. (2013). Design robust controller for automatic generation control in restructured power system by imperialist competitive algorithm. IETE Journal of Research, 59(6): 745-752. http://dx.doi.org/10.4103/0377-2063.126971
[33] Razmjooy, N., Khalilpour, M. (2015). A new design for PID controller by considering the operating points changes in Hydro-Turbine Connected to the equivalent network by using Invasive Weed Optimization (IWO) Algorithm. International Journal of Information, Security and Systems Management, 4(2): 468-475.
[34] Razmjooy, N., Khalilpour, M. (2015). A robust controller for power system stabilizer by using artificial bee colony algorithm. Technical Journal of Engineering and Applied Sciences, 5(3): 106-113.
[35] Razmjooy, N., Khalilpour, M., Ramezani, M. (2016). A new meta-heuristic optimization algorithm inspired by FIFA World Cup competitions: Theory and its application in PID designing for AVR system. Journal of Control, Automation and Electrical Systems, 27(4): 419-440. http://dx.doi.org/10.1007/s40313-016-0242-6
[36] Bhargava, V., Fateen, S.E.K., Bonilla-Petriciolet, A. (2013). Cuckoo Search: A new nature-inspired optimization method for phase equilibrium calculations. Fluid Phase Equilibria, 337: 191-200. http://dx.doi.org/10.1016/j.fluid.2012.09.018
[37] Zheng, Y.J. (2015). Water wave optimization: A new nature-inspired metaheuristic. Computers & Operations Research, 55: 1-11. http://dx.doi.org/10.1016/j.cor.2014.10.008
[38] Li, L.X., Shao, Z.J., Qian, J.X. (2002). An optimizing method based on autonomous animate: Fish swarm algorithm. System Engineering Theory and Practice, 32-38. http://dx.doi.org/10.12011/1000-6788(2002)11-32
[39] Karaboga, D., Basturk, B. (2007). Artificial bee colony (ABC) optimization algorithm for solving constrained optimization problems. In: Foundations of Fuzzy Logic and Soft Computing. Springer, Berlin, Heidelberg, pp. 789-798. http://dx.doi.org/10.1007/978-3-540-72950-1_77
[40] Dorigo, M., Birattari, M., Stutzle, T. (2006). Ant colony optimization. IEEE Computational Intelligence Magazine, 1(4): 28-39. http://dx.doi.org/10.1109/MCI.2006.329691
[41] Kennedy, J., Eberhart, R. (1995). Particle swarm optimization. Proceedings of ICNN'95 - International Conference on Neural Networks, Perth, WA, Australia, pp. 1942-1948. http://dx.doi.org/10.1109/ICNN.1995.488968
[42] Adeli, A., Broumandnia, A. (2017). Image steganalysis using improved particle swarm optimization based feature selection. Applied Intelligence, 48: 1609-1622. https://doi.org/10.1007/s10489-017-0989-x
[43] Celebi, M.E., Kingravi, H.A., Uddin, B., Iyatomi, H., Aslandogan, Y.A., Stoecker, W.V., Moss, R.H. (2007). A methodological approach to the classification of dermoscopy images. Computerized Medical Imaging and Graphics, 31(6): 362-373. http://dx.doi.org/10.1016/j.compmedimag.2007.01.003
[44] Parolin, A., Herzer, E., Jung, C.R. (2010). Semi-automated diagnosis of melanoma through the analysis of dermatological images. International Conference on Graphics, Patterns and Images (SIBGRAPI), Gramado, pp. 71-78. http://dx.doi.org/10.1109/SIBGRAPI.2010.18
[45] Jaleel, J.A., Salim, S., Aswin, R.B. (2013). Computer aided detection for skin cancer. International Conference on Circuits, Power and Computing Technologies (ICCPCT), pp. 1137-1142. http://dx.doi.org/10.1109/ICCPCT.2013.6528879
[46] Barata, C., Ruela, M., Francisco, M., Mendonça, T., Marques, J.S. (2013). Two systems for the detection of melanomas in dermoscopy images using texture and color features. IEEE Systems Journal, 8(3): 1-15. http://dx.doi.org/10.1109/JSYST.2013.2271540
[47] Ruela, M., Barata, C., Mendonca, T., Marques, J.S. (2013). On the role of shape in the detection of melanomas. 8th International Symposium on Image and Signal Processing and Analysis (ISPA), Italy, pp. 268-273.
[48] Zhou, H.Y., Schaefer, G., Sadka, A.H., Celebi, M.E. (2009). Anisotropic mean shift based fuzzy cmeans segmentation of dermoscopy images. IEEE Journal of Selected Topics in Signal Processing, 3(1): 26-34. http://dx.doi.org/10.1109/JSTSP.2008.2010631
[49] Zhou, H.Y., Schaefer, G., Celebi, M.E., Iyatomi, H., Norton, K., Liu, T.W., Lin, F.Q. (2010). Skin lesion segmentation using an improved snake model. International Conference on Engineering in Medicine and Biology Society (EMBC), pp. 1974-1977. http://dx.doi.org/10.1109/IEMBS.2010.5627556
[50] Celeb, M.E., Hwang, S., Iyatomi, H., Schaefer, G. (2010). Robust border detection in dermoscopy images using threshold fusion. International Conference on Image Processing (ICIP), Hong Kong, pp. 2541-2544. http://dx.doi.org/10.1109/ICIP.2010.5653514
[51] Iyatomi, H., Celebi, M.E., Schaefer, G., Tanaka, M. (2010). Automated color normalization for dermoscopy images. International Conference on Image Processing (ICIP), pp. 4357-4360. http://dx.doi.org/10.1109/ICIP.2010.5652370
[52] Iyatomi, H., Norton, K.A., Celebi, M., Schaefer, G., Tanaka, M., Ogawa, K. (2010). Classification of melanocytic skin lesions from nonmelanocytic lesions. International Conference on Engineering in Medicine and Biology Society (EMBC), pp. 5407-5410. http://dx.doi.org/10.1109/IEMBS.2010.5626500
[53] Buenestado, P., Acho, L. (2018). Image segmentation based on statistical confidence intervals. Entropy, 20(1): 46. https://doi.org/10.3390/e20010046
[54] Sarkar, S., Ghosh, M., Chatterjee, A., Malakar, S., Sarkar, R. (2019). An advanced particle swarm optimization based feature selection method for tri-script handwritten digit recognition. In: Mandal J., Mukhopadhyay S., Dutta P., Dasgupta K. (eds) Computational Intelligence, Communications, and Business Analytics. CICBA 2018. Communications in Computer and Information Science, 1030: 82-94. http://dx.doi.org/10.1007/978-981-13-8578-0_7
[55] Naeini, A.A., Babadi, M., Mirzadeh, S.M.J., Amini, S. (2018). Particle swarm optimization for object-based feature selection of VHSR satellite images. IEEE Geoscience and Remote Sensing Letters, 15(3): 379-383. http://dx.doi.org/10.1109/LGRS.2017.2789194
[56] Harris, C., Stephens, M. (1988). A combined corner and edge detector. In Proceedings of 4th Alvey Vision Conference, pp. 147-151. http://dx.doi.org/10.5244/C.2.23
[57] Shi, J., Tomasi. (1994). Good features to track. Proceedings of the IEEE Conference on Computer Vision and Pattern Recognition, Seattle, WA, USA, 1994, pp. 593-600. http://dx.doi.org/10.1109/CVPR.1994.323794
[58] Matas, J., Chum, O., Urban, M., Pajdla, T. (2002). Robust wide-baseline stereo from maximally stable extremal regions. Proc. of British Machine Vision Conference, pp. 384-396. http://dx.doi.org/10.5244/C.16.36
[59] Nister, D., Stewenius, H. (2008). Linear time maximally stable extremal regions. European Conference on Computer Vision, pp. 183-196. http://dx.doi.org/10.1007/978-3-540-88688-4_14
[60] Szeliski, R. (2010). Computer Vision Algorithms and Applications. London. Springer.
[61] Rosten, E., Drummond, T. (2005). Fusing points and lines for high performance tracking. Tenth IEEE International Conference on Computer Vision (ICCV'05), Beijing, pp. 1508-1511. http://dx.doi.org/10.1109/ICCV.2005.104
[62] Bay, H., Ess, A., Tuytelaars, T., Van Gool, L. (2008). Speeded-up robust features (SURF). Computer Vision and Image Understanding (CVIU), 110(3): 346-359. http://dx.doi.org/10.1016/j.cviu.2007.09.014
[63] Panchal, P.M., Panchal, S.R., Shah, S.K. (2013). A comparison of SIFT and SURF. International Journal of Innovative Research in Computer and Communication Engineering, 1(2): 323-327.
[64] Işık, S. (2015). A comparative evaluation of well-known feature detectors and descriptors. International Journal of Applied Mathematics, Electronics and Computers, 3(1): 1-6. http://dx.doi.org/10.18100/ijamec.60004
[65] Leutenegger, S., Chli, M., Siegwart, R. (2011). BRISK: Binary robust invariant scalable keypoints. Proceedings of the IEEE International Conference on Computer Vision (ICCV), Barcelona, pp. 2548-2555. http://dx.doi.org/10.1109/ICCV.2011.6126542
[66] Alcantarilla, P.F., Bartoli, A., Davison, A.J. (2012). KAZE features. In: Fitzgibbon A., Lazebnik S., Perona P., Sato Y., Schmid C. (eds) Computer Vision – ECCV 2012. ECCV 2012. Lecture Notes in Computer Science, 7577: 214-227.
[67] Vapnik, V. (1998). Statistical Learning Theory. Wiley-Interscience.
[68] Haykin, S. (1999). Neural Networks, A Comprehensive Foundation. Second Edition, Prentice Hall.
[69] Mohammadi, F.G., Abadeh, M.S. (2014). Image steganalysis using a bee colony based feature selection algorithm. Engineering Applications of Artificial Intelligence, 31: 35-43.
[70] Maglogiannis, I., Koamopoulos, D.I. (2005). Computational vision systems for the detection of malignant melanoma. Oncology Reports, 15(4): 1027-1032. http://dx.doi.org/10.3892/or.15.4.1027
[71] Clinical Skin Disease Images of the University of Iowa, Department of Dermatology, https://medicine.uiowa.edu/dermatology/education/clinical-skin-disease-images, accessed on May 13, 2020.
[72] Dermatologic disease database, http://www.aocd.org/skin/dermatologic_diseases/melanoma.html. accessed on May 13, 2020.
[73] Celebi, M.E., Kingravi, H.A., Uddin, B., Iyatomi, H., Aslandogan, Y.A., Stoecker, W.V., Moss, R.H. (2007). A methodological approach to the classification of dermoscopy images. Computerized Medical Imaging and Graphics, 31(6): 362-373.
[74] Rigel, D.S., Friedman, R. (2010). The evolution of melanoma diagnosis: 25 years beyond the ABCDs. CA: A Cancer Journal for Clinicians, 60(5): 301-316.
[75] Nematollahi, M., Ghassemian, H. (2010). A CBIR Approach to differential diagnosis of pigmented skin lesions. Iranian Journal of Electrical and Computer Engineering, 9: 23-33.
[76] Adeli, A., Ghorbani-Rad, A., Zomorodian, M.J., Neshat, M., Mozaffari, S. (2012). Improving nearest neighbor classification using particle swarm optimization with novel fitness function. In: International conference on computational collective intelligence. Springer, Berlin, Heidelberg, 365-372.
[77] Yazdani, D., Nasiri, B., Sepas-Moghaddam, A., Meybodi, M.R. (2013). A novel multi-swarm algorithm for optimization in dynamic environments based on particle swarm optimization. Applied Soft Computing, 13(4): 2144-2158.
[78] Aha, D.W., Kibler, D., Albert, M.K. (1991). Instance-based learning algorithms. Machine Learning, 6: 37-66.