OPEN ACCESS
The new F1 direct-injection turbocompound engines V6 of 1600cc have innovative systems for the recovery of the wasted energy. Fuel and airflow to the engine are limited as well as the amount of fuel and electric energy from the battery available for the race. It is therefore vital to implement the most efficient strategy to improve powerplant efficiency. It is also important to handle with exceptional situations as the necessity to obtain a best lap or to reach and pass other cars. The following article introduces strategies for the electronic engine management systems to deal with this hybrid powerplant. In this paper the shaft speed vs time pattern determines how the powerplant energy system is managed and maximizes a parameter in the various situations. Four critical conditions are analyzed: start, braking, fast and slow curve. The launch (start) maximizes the average acceleration of the car, adjusting it to the maximum traction force available from the powerplant and tires. The braking maximizes the braking distance and the energy recovery. The fast curve strategy maximizes the speed out of the curve and minimizes the time. The slow curve strategy maximizes the energy recovery and the speed out of the curve.
powerplant, formula 1, energy recovery, tuning strategy
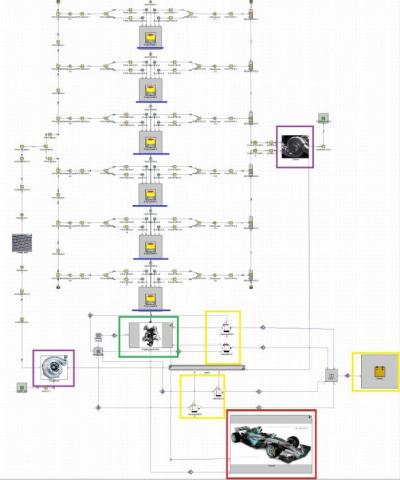
The battery in a Formula 1 auto gives an essential help that it can change the result of a race. The result of the 2009 Belgian Formula One Grand Prix was decided in the fifth lap. The sloping, winding circuit of Spa-Francorchamps had just observed the retirement of four drivers due to an accident in the first lap. The safety-car went in ton lap five, keeping drivers off while the track was cleared. At this point Giancarlo Fisichella was first in his Force India Mercedes, with Kimi Raikkonen's Ferrari not far behind. Raikkonen pressed a button and zoomed past Fisichella and into the lead position. He would not give up a lead. Ferrari was one of the few cars that had the Kinetic Energy Recovery System (KERS), which gave a transient burst of speed, and Raikkonen had utilized it superbly. It was the first time that KERS had decided the race victor. Fisichella was not inspired. "I was faster than Kimi," he told journalists. "He passed me with the aid of the KERS. I'm somewhat baffled about that". KERS came to fruition as an approach to address two issues that Formula One had in the mid-2000s: right off the bat, an absence of surpassing, which was a mood killer for fans; and furthermore, feedback that this sport was ecologically hostile. It additionally implied F1 autos had a battery unexpectedly. Not at all like an ordinary car, a F1 car does not start its motor with the assistance of an internal battery: rather it requires an outer starter engine. The KERS battery recovered part of the energy dissipated in braking, and made it accessible amid a lap improve the car's speed. In 2014, KERS was supplanted with ERS (Energy Recovery System) [1, 2], which recover energy from the turbocharger and the brakes, giving the driver an additional 160 HP for around 30 seconds for every lap [3-7]. This energy becomes vital to improve car performance, avoiding the turbolag and increasing the power output when necessary. The declared advantage is that ERS encourages the power unit to run even more efficiently, utilizing less fuel. Racing fuel is limited, as well as airflow, fuel flow and electric energy per lap. Therefore, the way ERS is used makes the car a winner or a loser. F1 powerplant needs to keep up battery under extraordinary conditions. The battery must be small and light since room and weight are at a premium in a F1 car. In particular, battery needs to work at high temperatures with the best possible charging and discharging efficiency. Cycling power all through a battery creates warm, which is a loss of energy and additional fuel consumption. In addition, cooling frameworks consume up room and add weight, so the more warmth the battery can deal with without cooling, the better. F1 cars are improved profoundly and critical changes are made – not simply between races, but also during the race weekend. With huge measures of gear and innovation in the auto, the race group is continually looking for the blend that will give them the best favorable position. A 100th of a second spared in a tire change or the most minor move in brake adjust amid a lap can mean the difference between the first and second place. That mind-boggling approach reaches out to the battery. Regulations determine limits, for example, battery weight and what number of various battery frameworks a group can utilize every year. At present, a team will be penalized if it utilizes in excess of four batteries for every season. The new rules compelled teams to alter their procedure for getting the most out of the batteries. Broadly, innovation created for F1 frequently encourages producers to improve street autos. Electronic injection, Sequential gearboxes, dynamic suspension and wheel speed control all have their starting points in F1. ERS is no special case; producers including Volvo and Mazda have started utilizing the F1 experience, to enable motors to run more efficiently and pass the emission tests. When Kimi Raikkonen hit the button in that Sunday of 2009, he gave a lift to something other than his auto. Once the car as a whole has been inputted into the software, it is possible to carry out the simulations of the race with its most critical phases to analyze the powerplant behavior. First, however, it is right to give an overview of the complete model of the powerplant - car system (Figure 1). In summary, Figure 1 shows the propulsion system that provides power to the car highlighted in red and detailed in Figure 2. In particular, the six cylinders, highlighted in blue, provide power to the crankshaft, and together with the boost unit, highlighted in purple, constitute the endothermic part of the power-unit. The electrical part is highlighted in yellow, with the respective two units of MGU operating with the battery. The MGU-H is connected to the shaft turbine and works as a wastegate (pressure control and generator) and as a “turbolag limiter” (motor). The MGU-K recovers the energy when the car slows down and add power to the thermal engine when necessary. It is then possible to simulate a few conditions faced by the Formula 1 car during the race:
Figure 1. The engine model
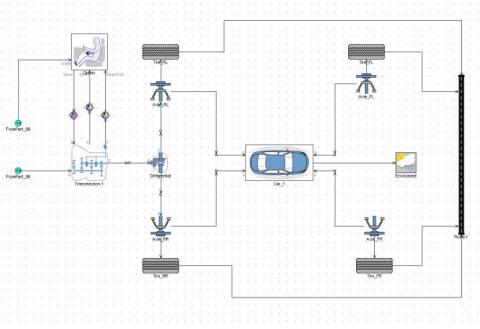
Figure 2. The vehicle model
-Start: a phase of acceleration from a standstill to a maximum speed of 350 km/h will be analyzed. In this case, one of the main factors to be controlled will be the time that the car takes to reach 100 km / h, because this figure shows if the acceleration of the car falls within the real parameters.
-Braking to full stop: a braking phase from a maximum speed of 350 km/h to 0 km/h will be analyzed. In this case, we will concentrate on the time, on the stopping distance and on the regeneration of the batteries thanks to the electric energy obtained by the two MGUs, with electric motors that perform the function of generators.
-Series of fast curves: a phase of two fast corners will be analyzed, in particular the Lesmo 1 and Lesmo 2 curves that are part of the Monza circuit. In this case, it will be important to analyze the speed and the travel time of the curves, without neglecting the analysis of the curve exit speed. Energy regeneration is another result of the analysis.
-Slow curve: a curve slower than the previous will be analyzed. In particular, the simulation will be performed in the number 10 curve in the circuit of Montreal (Canada). In this case, the braking, the time and the speed of travel will be analyzed, and, as in the previous case, the speed of the car leaving the curve. Energy regeneration is another result of the analysis.
The starting phase is fundamental in an F1 Grand Prix. It is necessary to have a good acceleration without incurring the phenomenon of the slippage of the rear wheels. This happens when the torque that is supplied to the wheels generates a force greater than that of friction generated by the tires on the asphalt. The phenomenon of slippage compromises, according to its size, in a more or less marked way the departure of a Formula 1 car that is in the first meters of distance with a decrease in grip between tires and asphalt. Before analyzing the behavior of the car in this phase, it is good to analyze how the speed profile to be assigned to the crankshaft has been defined.
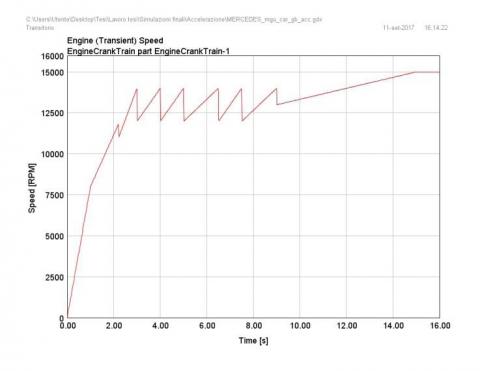
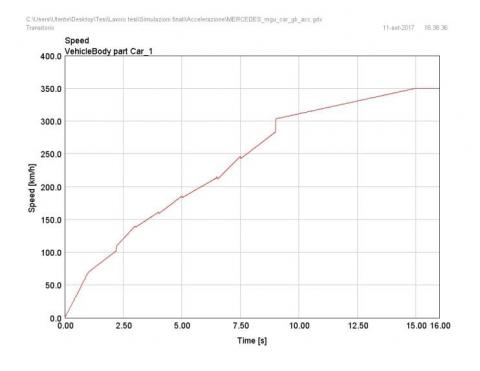
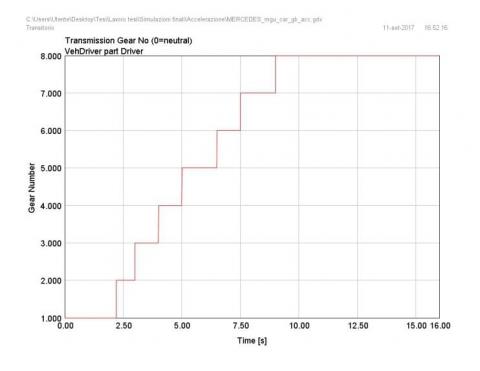
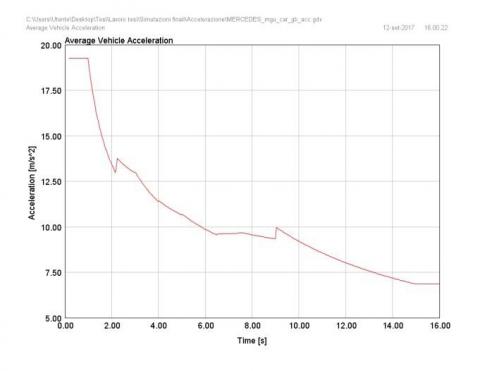
During the starting phase, the driver does not perform the vehicle speed control through the accelerator, but the rotation speed of the crankshaft is directly modulated. In this way, the need to implement the braking system is avoided by reducing the complexity of the system while achieving realistic results. Regarding the speed profile assigned to the crankshaft for the starting phase, shown in Figure 3, it is characterized by an irregular pattern due to the need to simulate the gear change and therefore the revolutions of the crankshaft that occurs when changing from one gear to the next. This engine rpm drop was set at 2000 RPM. All the gears are shifted at 14,000 RPM except for the first one, which is switched off at 11,800 RPM. Once the speed profile of the crankshaft has been defined, it is possible to proceed to the analysis of the acceleration of the vehicle. Figure 4 shows the speed of the car as a function of time. The maximum speed reached in eighth gear at 15,000 RPM is 350 km/h. This result confirms that the maximum speed is 350 km/h. Figure 4 shows that the first acceleration section which, as already mentioned above, greatly influences the starting phase. It is necessary to take about 2.2 seconds to reach 100 km/h, with an average acceleration of 19 m/s2, equal to 2.2g. This is roughly in line with the performance of a real Formula 1 car. Figure 5 shows the gearshifts versus time. Figure 6 shows the acceleration versus time. The performance of the ERS electrical system is now analyzed, in particular the torque supplied by MGU-H and MGU-K and the battery discharge.
Figure 3. Speed profile assigned to the crankshaft for the starting phase
Figure 4. Velocity versus time during start
Figure 5. Gear shifts vs time
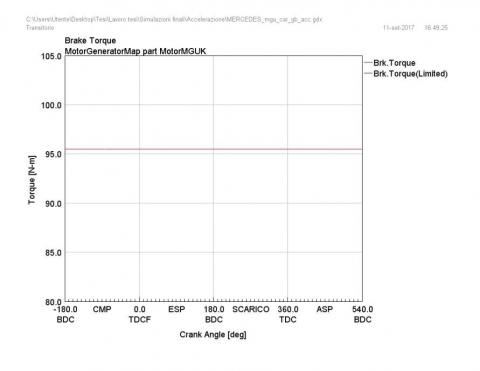
Figures 7 and 8 show the torque supplied by the two MGU units, in particular 95 Nm for the MGU-K and 6 Nm for the MGU-H. Fundamental is the contribution of the latter, which reduce the turbolag, which would compromise the performance of the car at low compressor rotation speeds.
Figure 6. Acceleration vs. time during start
Figure 7. MGU-H output torque vs. time during start
Figure 8. MGU-K output torque vs. time during start
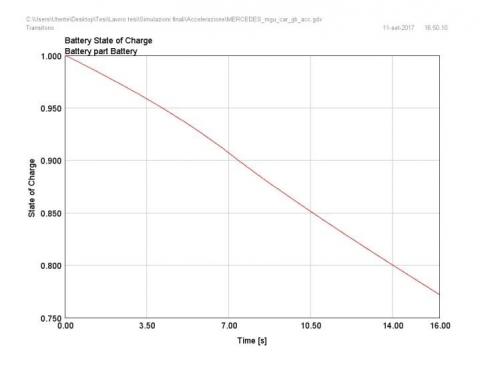
Figure 9 shows that the batteries before the start are fully charged and then reach 3/4 of the charge at the end of the acceleration phase. The endothermic system combined with the electrical system generate a torque of 630 Nm and provide a maximum power of 1330 HP, data that is reasonable for a Formula 1 Power-Unit.
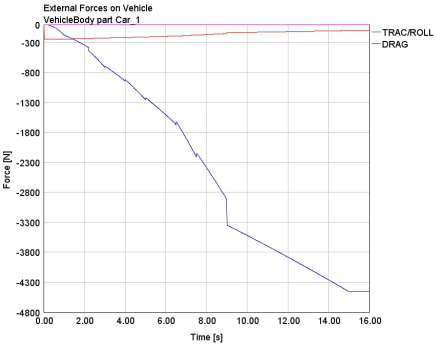
Finally, the aerodynamic performance of the car is analyzed. The main component of the aerodynamic drag comes from the drag force, represented in blue (Figure 10). It reaches the maximum value of about 4500 N at 350 km/h. To try to reduce it, the regulation has allowed the use of DRS (Drag Reduction System) in some points of the track.
Figure 9. Battery discharge curve vs. Time during start
Figure 10. External forces on car (drag and roll) vs. time during start
The braking analysis is fundamental to evaluate the performance of a F1 car. In this phase, the car passes from the maximum speed calculated in the previous section (365 km/h) to full stop. The braking in most cases precedes the entry of the car in a curve; in this situation, it is necessary to have a lot of downforce, in order to have the maximum possible grip between tires and asphalt, to minimize space and the braking time.
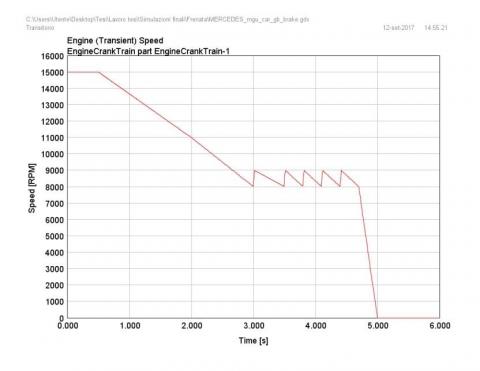
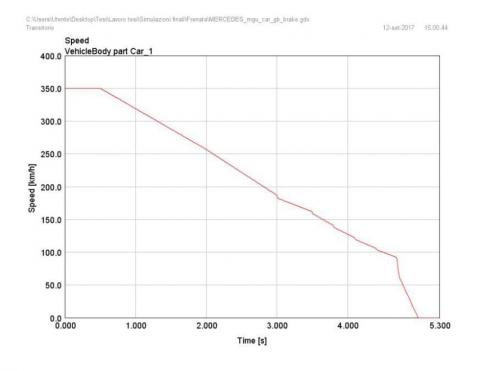
As for the analysis of the acceleration case, we first analyze the speed profile assigned to the motor shaft. At the maximum speed, the initial crankshaft speed is set to 15000 RPM with the transmission set in eighth gear. The discontinuous curve of Figure 11 is due to the increase in the number of revolutions of the crankshaft when shifting from one gear to the previous one, this increase has been estimated at 1,000 RPM. Figure 12 shows that the braking phase starts at 0.5 s with an initial speed of 350 km/h.
Figure 11. Crankshaft speed during braking
Figure 12. Vehicle speed during braking
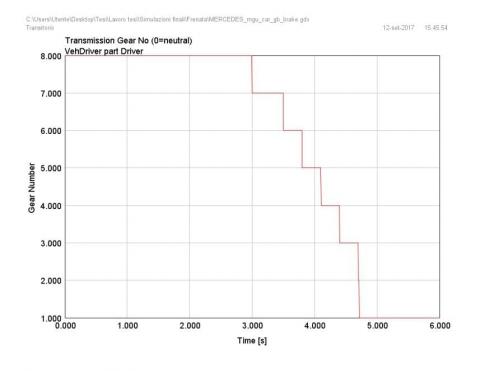
Figure 13. Gear shifts vs. time during braking
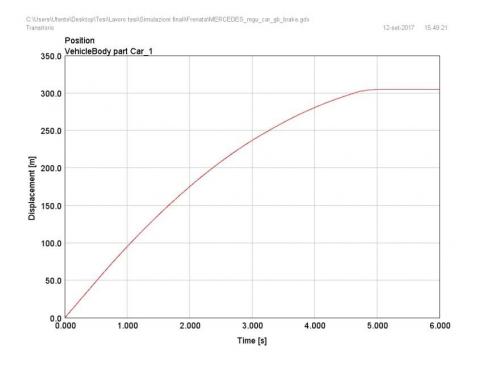
Shifting timing is shown in Figure 13. Afterwards, speed descends until it reaches zero. From Figure 14, it is possible to see that the braking distance needed to full stop is about 270 m. with a braking time equal to 4.5 s.
Figure 14. Braking distance vs. time
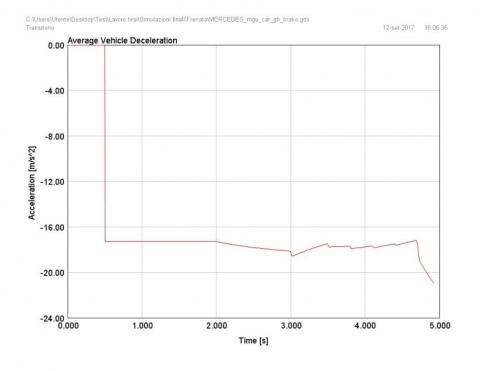
Figure 15. Acceleration vs. time during braking
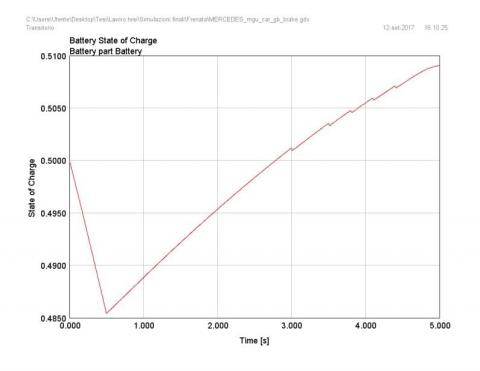
Figure 16. Battery charge vs. time during braking
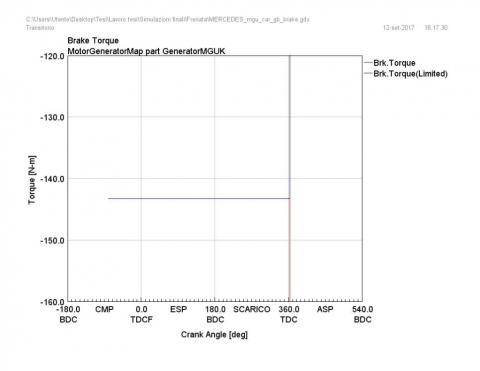
Figure 17. Brake torque vs. time MGU-K
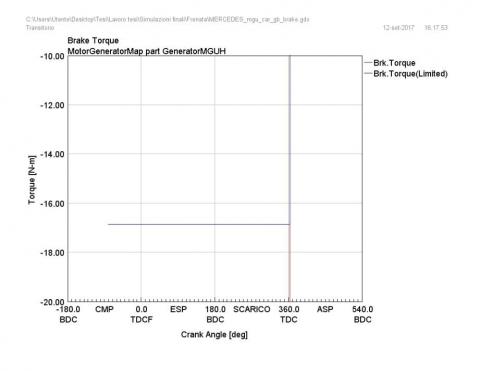
Figure 18. Brake torque vs. time MGU-H
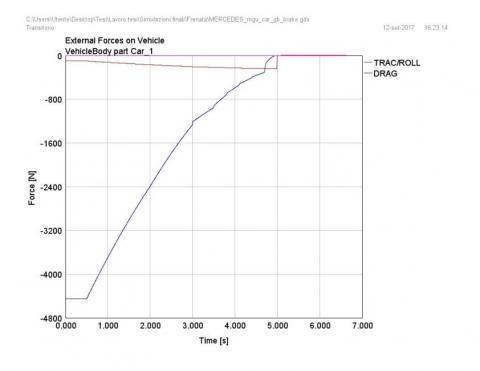
Figure 19. External forces vs. time during braking
Figure 15 shows an average deceleration of 18 m/s2 (1.9g). ERS (Energy Recovery System) performance is summarized in Figure 16. As can be seen from Figure 17 and 18, when the braking phase begins, the two MGU (MGU-H and MGU-K) units operate as generators to recharge the batteries, providing a braking torque of 143 Nm for the MGU-K and 16.8 Nm for the MGU-H. The influence of external forces is not important (Figure 19).
We chose to analyze a case of two fast curves separated by a short straight; in particular, we chose to perform the simulation in the two Lesmo curves of the Italian circuit of Monza. The first Lesmo curve has a radius of 62 m for a length of 97 m, while for the second the radius is approximately 50 m and a length of 65 m. The length of the straight between the two curves has been set equal to 220 m. With these data, it was possible to input the characteristics of the track into the software.
Figure 20. Crankshaft rpm vs. time in Monza Lesmo curves up to the “variante Ascari”
Figure 21. Velocity vs. time in Monza Lesmo curves up to the “variante Ascari”
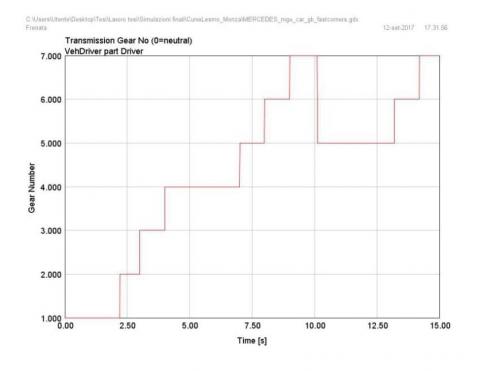
Figures 20 and 21 show that a first section of acceleration has been set to reach the speed to obtain an optimal curve entry. Then the car enters the first curve without braking. There is also a section with a constant crankshaft speed, equal to 13,500 RPM then it enters in the first Lesmo curve. It continues with a short acceleration and a braking before taking the second curve traveled at 8,000 RPM, slightly slower than the first. Once the car has passed these series of curves, you have a stretch of full acceleration to travel the long straight that takes to the “variante Ascari”. Figure 21 shows that the first curve of Lesmo is traveled at a speed just below 180 km/h, while the second at an average velocity of 130 km/h. In the intermediate straight section, a top speed of just over 250 km/h is reached. The graph shows the travel time of the section of circuit analyzed: it is around 6.5 s, data in line with the actual travel times of the Formula 1 cars. The gearshift history is showing in Figure 22. The energy management from the ERS system is shown in Figure 23.
Figure 22. Gear shifts vs. time in Monza Lesmo curves up to the “variante Ascari”
Figure 23. Battery charge vs. time in Monza Lesmo curves up to the “variante Ascari”
Figure 23 shows that, in the first phase composed by the initial acceleration, the first curve turn and the second acceleration, the battery supplies energy to the electric motors, in particular during the curve the MGU-H must keep the compressor at a minimum rotation speed in order to reduce the phenomenon of turbolag. When the pilot brakes to face the second curve of Lesmo, the batteries are recharged thanks to the motors that perform the function of generators, and then return to absorb energy in the next straight that leads to the “variante Ascari”. Figure 24 shows the drag force, in blue, and the centrifugal force, in fuchsia. The considerations on the drag force are the same as in the previous sections with the addition of the observation of its non-variability in the traits at constant speed. As regards the lateral force to which the car is subjected, it has a peak of about 400 N during the first corner. To ensure that this force does not cause the loss of stability of the vehicle with possible skidding off the track, it is necessary to have a good aerodynamic load that generates a vertical force on the tires in order to create enough friction between tire and asphalt able to win the centrifugal force.
Figure 24. External forces vs. time in Monza Lesmo curves up to the “variante Ascari”
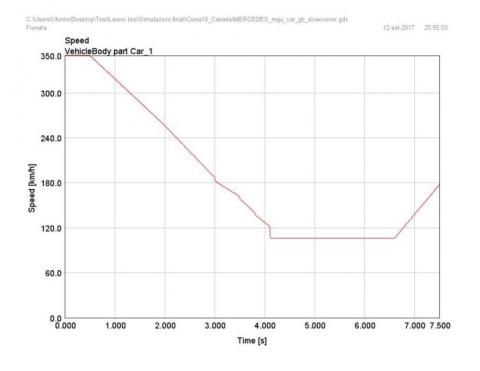
As a last simulation, it was chosen to analyze a slow curve. In this case all the considerations made in the previous case regarding down and drag force remain, in addition we must pay close attention to the traction when coming out of the curve, because it is essential to accelerate correctly without incurring phenomena of oversteer or slippage of the rear tires. The Monza circuit does not provide curves with the required characteristics, so it was decided to carry out the simulation in the Montreal circuit, in Canada, in particular on the number 10 curve also called Epingle. As for the Lesmo curves of the Monza circuit it is necessary to define the radius of curvature of the track according to its length. From the maps, a radius of curvature of 20.5 m and a length of 65 m were obtained.
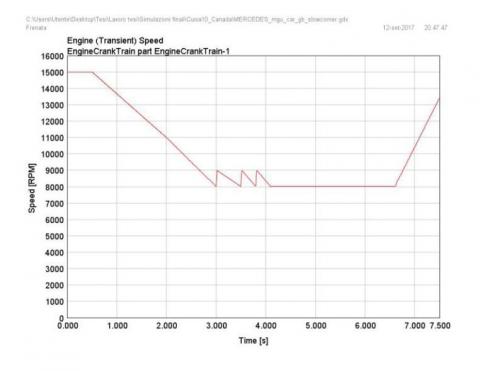
Figure 25. Crankshaft velocity vs. time in Montreal Epingle slow curve
Figure 26. Car velocity vs. time in Montreal Epingle slow curve
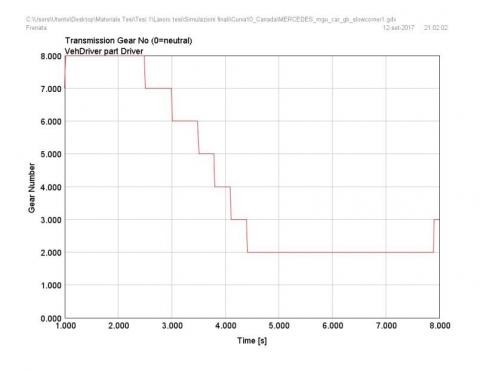
Figure 27. Car velocity vs. time in Montreal Epingle slow curve
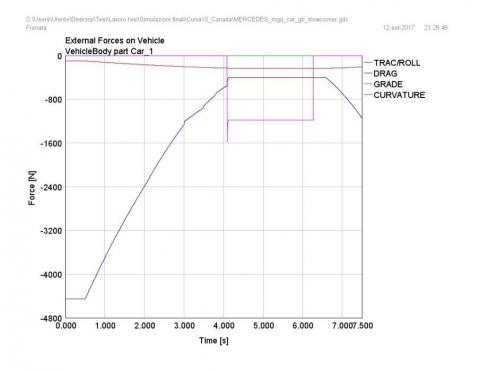
In addition to the curve, also the straights before and after were implemented. First, as in the previous cases, the velocity profile assigned to the crankshaft is analyzed (Figure 25). Figures 25 and 26 show that the simulation starts with a maximum speed of 350 km/h in eighth gear at 15,000 rpm. As the pilot brakes and enters the curve the rpm is reduced to 8,000 rpm. Finally, the pilot accelerates up to the maximum speed on the long straight that takes to the curves 13 and 14. This last phase of acceleration will not be analyzed, as it is identical to the first case of starting. Figure 26 shows that the vehicle brakes down to travel the curve at just over 100 km/h in second gear for about 2.5 s. After this phase, the acceleration starts again on the main straight. The simulation data shows that, at the end of the curve, the car is subjected to an acceleration of 17 m/s2. The gear shifting history matches the velocity results (Figure 27). This result perfectly matches the one found in the starting phase. This means that the car has an optimal acceleration phase out of the corner. Figure 28 shows that, in the first section, the MGU-K absorbs energy to produce torque, while in the braking phase both the generators produce energy that must be stored in the battery. In the curve, the MGU-H absorbs energy to maintain the compressor shaft at an optimum rotation speed, thus avoiding the phenomenon of turbolag in the exit of the curve. Finally, in the acceleration phase both motors are in action to provide the maximum power possible. External forces (Figure 29) show that the centrifugal force (represented in fuchsia) reaches values around 1,200 Nin the center of the curve. Although the travel speed is significantly lower than the one of the Lesmo curves, the car is subjected to a much greater lateral force, which, in the previous case, reached a maximum of 400 N. This is due to the radius of curvature of the track that is significantly smaller.
Figure 28. Battery state of charge vs. time in Montreal Epingle slow curve
Figure 29. External forces vs. time in Montreal Epingle slow curve
Formula 1 powerplants are characterized by complex electric-hybrid propulsion system. The new direct-injection turbocompound engines V6 of 1600cc two systems for the recovery of the energy otherwise wasted (Energy Recovery System - ERS). The MGU-H recovers and supplies energy to the turbocharger, while the MGU-K recovers the energy from the brakes and supplies it to the crankshaft. Fuel and airflow to the engine are limited as well as the amount of fuel and electric energy from the battery available for each lap of the race. The concept is to take as much energy possible from the fuel and brakes to supply it, in the most efficient and convenient way to vehicle. It is therefore vital to implement the most efficient strategy to improve the overall efficiency of the powerplant. At the same time, it is vital to handle with exceptional situations as the necessity to obtain a best lap or to reach and pass other cars. This paper introduces strategies for the electronic engine management systems to deal with this hybrid powerplant. It is just the first of a series of papers about this subject. It is focused on the crankshaft speed approach to the problem. Where the crankshaft speed vs time pattern determines how the powerplant energy system is managed. The idea is to maximize a defined parameter in the various situations. Four critical conditions are analyzed: start, braking, fast and slow curve. The launch (start) maximizes the average acceleration of the car, adjusting it to the maximum traction force available from the powerplant and tires. The braking minimizes the braking distance and the energy recovery. The fast curve strategy maximizes the speed out of the curve and minimizes the time of travel. The slow curve strategy maximizes the energy recovery and the speed out of the curve. In this paper, the true battery energy management is not taken into account. For example, the charging and discharging efficiency are considered unitary. Another limitation is that there is not a thermal management of the battery system and of the MGUs
[1] Ibrahim, S.M., Mabood, F., Kumar, P.V., Lorenzini, G. (2018). Cattaneo-Christov heat flux on UCM flow across a melting surface with cross diffusion and double stratification. Italian Jour. of Engineering Science: Tecnica Italiana, 62(1): 7-16. https://doi.org/10.18280/ijes.620102
[2] Piancastelli, L., Peli, F., Pezzuti, E. (2018). The advantage of the “split” turbocharger in Formula 1 engines. Italian Jour. of Engineering Science: Tecnica Italiana, 62(1): 31-36. https://doi.org/10.18280/ijes.620105.
[3] Piancastelli, L., Frizziero, L., Pezzuti, E. (2014). Kers applications to aerospace diesel propulsion. ARP Jour. of Engineering and Applied Sciences, 9(5): 807-818.
[4] Fédération Internationale de l’Automobile https://www.fia.com/sites/default/files/regulation/file/1-2014%20TECHNICAL%20REGULATIONS%202014-01-23_0.pdf, accessed on March 26, 2018.
[5] Piancastelli, L., Frizziero, L. (2014). Turbocharging and turbocompounting optimization in automotive racing. ARPN. Journal of Engineering and Applied Sciences, 11(9): 2192-2199.
[6] Upendra, K., Grauers, A. (2014). Analysis of 2014 Formula one hybrid powertrain. Swedish Hybrid Vehicle Centre. Chalmer University of Technology. http://hybridfordonscentrum.se/wp-content/uploads/2015/02/Analysis-of-2014-formula-one-hybrid-powertrain_ver1.pdf, accessed on March 26, 2018.
[7] Piancastelli, L., Burnelli, A., Cassani, S. (2017). Validation of a simplified method for the evaluation of pressure and temperature on a RR Merlin XX head. International Journal of Heat and Technology, 35(1): 549-558. https://doi.org/10.18280/ijht.350311