Sunardi![]() | Anton Yudhana
| Anton Yudhana![]() | Anggi Rizky Windra Putri*
| Anggi Rizky Windra Putri*![]()
© 2023 IIETA. This article is published by IIETA and is licensed under the CC BY 4.0 license (http://creativecommons.org/licenses/by/4.0/).
OPEN ACCESS
Breast cancer results from aberrant cell division in the breast and leads to the formation of tumors. The modern lifestyle, which is instant and rarely exercises, is the main driving force for this disease. Therefore, this study aims to diagnose by recognizing the specific characteristics of cancer in a benign or malignant class in the breast area. This study approach uses the deep learning technology model Faster R-CNN and dataset Mammographic Image Analysis Society (MIAS). This model requires unique image characteristics to recognize and produce a higher accuracy value. Furthermore, this study proposes optimizing an image segmentation approach using Matlab, ImageJ, and Python software to enrich cancer-specific images. This approach plays a vital role in increasing the accuracy of cancer detection. The results of this study before optimization have an accuracy rate of 63.47% using a smartphone camera; after optimization, the highest accuracy value becomes 90.43%, therefore 9.57% requires further examination by a specialist. Based on these results, these results help assist radiologists in making decisions about the results of the initial examination of breast mammogram data.
faster R-CNN, deep learning, MIAS, data augmentation, image data, breast cancer
Modern lifestyle factors that are instantaneous and a lack of knowledge about healthy lifestyles make women vulnerable to breast cancer. In general, breast cancer susceptibility in women based on the age of 40-49 years is 92 cases (27%); vulnerable age 50-59 years there are 80 cases (23.5%); aged 30-39 years is 65 cases (19%); aged 60-69 years, there were 51 cases (15%). The lowest percentage of breast cancer occurred at 10-19 years old, with 2 cases (0,5%) [1, 2].
Data from the World Health Organization (WHO) Global Burden of Cancer Study (Globocan) recorded that the total breast cancer cases in Indonesia in 2020 reached 396,914, and the total number of deaths was 234,511 [3]. The disease is the most common problem and threatens women worldwide. Breast cancer occurs due to aberrant cell division in the chest area and leads to the formation of breast cancer cells [4]. Generally, the disease starts from a suspicious lump or bulge until the next stage becomes a tumour. Handling and curing this disease is very important because it can provide opportunities and a higher quality of life, increase life expectancy; eliminate or inhibit the growth of cancer cells; and save women from breast cancer malignancy.
Based on this, this research encourages women to be more aware of the threat of breast cancer, so early detection of breast cancer is essential for proper treatment and a healthy lifestyle. Therefore, this study aims to diagnose certain chest areas to detect and classify cancer into benign or malignant classes in women's breasts [4]. A detection system refers to suspicious lumps in the chest area, especially female breasts.
This study proposes an approach using image segmentation optimization and the Faster R-CNN deep learning model. This method studies image data in depth to recognize the unique characteristics of a particular object, thus requiring optimization steps to produce high accuracy values [5]. This research uses optimization with four scenarios of the image data segmentation process [6, 7].
The results of this study contain information on the Proposed approach with image segmentation optimization and the Faster R-CNN model deep learning method. The application of the proposed approach using a smartphone camera reached the highest accuracy of 90.43% in scenarios in recognizing image data on the MIAS breast cancer dataset in real-time [8]. This classification speeds up the detection and treatment of cancer by specialists [9]. This paper contains information on the proposed approach to optimizing breast cancer detection and classification, including the introduction, literature review; results and discussions; and conclusions.
The following are some of the previous studies that carried out the detection of breast cancer. Xie et al. [10] research the multiparametric magnetic resonance method and histogram analysis. This research aims to Identify breast cancer image biomarkers using multiparametric MR imaging maps and whole-tumor histogram analysis. His research method was retrospective involving 134 patients with invasive ductal carcinoma.
Punithavathi and Devakumari researched the extraction of cancer features through experiments with the Gray Level Co-occurrence Matrix (GLCM) feature and the process of feature extraction testing on the Mammographic Image Analysis Society (MIAS) dataset [11]. Farhan and Kamil conducted a study using LBP, HOG, and GLCM feature extraction techniques to reduce false positives in breast diagnosis using of Mini-MIAS Database for this approach [12].
Fadhil and Ornek [13] using The Mammographic Image Analysis Society (MIAS) dataset with a computer-aided detection method, and the accuracy result is 93.60%. Dawngliani et al. [14] dataset sourced from Mizoram Cancer Institute from 2009-2016. Data processing uses data mining, namely Random Forest with an accuracy rate of 97.13%. Monirujjaman Khan et al. [15] research using The Wisconsin Breast Cancer Diagnostic (WBCD) dataset. In addition, data processing uses machine learning methods: Logistic regression, decision tree, and others.
The results of this study obtained a logistic regression accuracy value of 98.60% and a decision tree of 94.73%. Marsilin [16] researched breast cancer classification using the query image with the database images of breast cancer. The research method uses content-based image retrieval (CBIR) and KNN Classifier, so the results have an accuracy rate of 85.00%.
The fundamental difference from previous research is the implementation of cancer image detection in this study with a smartphone camera. Therefore, this study proposes an early detection approach by optimizing image data segmentation and recognizing specific characteristics of cancer. This study's breast cancer image data came from MIAS and has been normalized.
2.1 Deep learning
Deep learning is a machine learning subfield with a network structure like the human brain [17-19]. The difference between deep learning and machine learning is in data management performance [20]. Deep learning can manage an increasing amount of large data and solve a problem, while machine learning optimizes small amounts of data [21-23]. Furthermore, deep learning in this research can adapt to updating data and recognizing functional and structural characteristics of disease [5].
2.2 Tensorflow framework and model faster R-CNN
Tensorflow is an open-source deep learning framework with libraries to perform high-performance computational calculations [17]. One part is the R-CNN model. The model is based on Convolutional Neural Network (CNN) [24], which acts as a backbone and produces an algorithm that can detect objects to perform classification quickly [25].
2.3 Dataset MIAS breast cancer
This study uses a breast cancer dataset from MIAS (https://www.kaggle.com/code/lemonweed/cancer-classificati on/data) [13]. The MIAS dataset consists of 322 breast mammogram data with details of 123 abnormal and 199 normal. Unfortunately, this dataset is private, so no detailed information is available, including age, never been pregnant, overweight, giving birth over the age of 30 years, menopause, menstruating age <12 years, or exposure to radiation from radiotherapy. However, this dataset provides information on the image categories of benign and malignant cancers.
This research uses the Faster-RCNN deep learning model. The application of the model is to detect, determine, and classify breast cancer image data. The following is a discussion of supporting theories about deep learning, the Faster R-CNN model, the MIAS breast cancer dataset, and the proposed approach.
The proposed approach in this study utilizes the TensorFlow framework to run the Faster R-CNN model. The proposed approach of the Faster R-CNN model is used for the early prediction of breast cancer through detecting and classifying cancer objects in the chest and breast muscle areas.
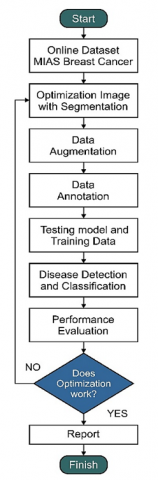
This approach focuses on the detection algorithm so that it becomes a key indicator of recognizing cancer objects. In deep learning, Faster R-CNN is the main algorithm for detecting targets (breast cancer objects) because it can determine unique characteristics and produce high accuracy values. The following flowchart of the proposed approach model system is shown in Figure 1.
Figure 1. System model proposed approach using Faster R-CNN
Figure 1 provides information on the working principle of the approach proposed in this study. The working principle consists of eight stages. The first stage of the online MIAS breast cancer dataset is determining and collecting breast cancer image data from online datasets. The second stage is preprocessing by optimizing the image data. The optimization uses a segmentation technique or algorithm according to the needs and functions. Optimization plays a role in increasing the value of object detection accuracy by manipulating the image. These manipulations include size, resolution, colour enhancement, and more.
The third stage is data augmentation, which expands the data set to improve model performance by producing various forms of image variations. This stage can enrich the sample data and add references to the image data training process. The fourth stage is data annotation; this stage is the process of labelling each breast cancer image. This labelling is the key to determining the image's position and a class of disease object areas. In addition, it is possible to detect multiclass objects.
The fifth stage is the system learns to recognize image data in depth to determine its unique characteristics. This introduction stage includes two essential processes: model testing (fixed variable) and training data (independent variable). Model testing aims to identify breast cancer image data that have been optimized. Training data is the introduction of image objects with Faster R-CNN, which produces loss values. The loss value becomes an error parameter in data recognition—calculating loss value during training using Eq. (1).
$L(\{p i\},\{t i\})=\frac{1}{N_{c l s}} \sum_i L_{c l s}\left(p i, p i^*\right)+\lambda \frac{1}{N_{r e g}} \sum_i p i * L_{r e g}\left(t i, t i^*\right)$ (1)
The following is detailed information on Eq. (1), where i is the anchor index, pi is the anchor prediction probability, and pi* is the fundamental truth label. ti acts as a vector representing the four-parameter coordinates of the prediction bounding box, and ti* is the ground-truth box associated with the positive anchor. Representative classification and regression losses with symbols Lcls and Lreg. In addition, it serves as a balancing parameter. Each parameter is normalized with Lcls and Lreg weighted λ. The second process, namely model testing, is the stage of calling the label map function and introducing image data based on labels. Finally, the label predicts disease so that the system will measure the recognition accuracy value based on the predicted classification results.
The sixth stage is system testing in detecting, recognizing, and classifying breast cancer from image data with a smartphone camera. The seventh stage is evaluating system performance in detecting and classifying breast cancer. The evaluation involves the performance of the system algorithm, the value of Accuracy, Precision, Recall, Specificity, and F1 Score in recognition of breast cancer. The following is the equation for each value using Eqns. (2) to (6) [26].
$Accuracy =\frac{T P+T N}{T P+T N+F P+F N}$ (2)
$Precision=\frac{T P}{T P+F P}$ (3)
$Recall=\frac{T P}{T P+F N}$ (4)
$Specificity =\frac{T N}{T P+F P}$ (5)
$F 1 \,\,Score =\frac{2 \times( { Recall }\,\, \times \,\, { Precision })}{ { Recall }+ { Precision }}$ (6)
The measurement of each detection and classification value is based on Eqns. (2) to (6) with a TP (True Positive) value which is the truth value of a prediction. The value of TN (True Negative) means the predicted value that is rejected in a positive state. The FP (False Positive) value is the identification of the wrong class value, and the FN (False Negative) value acts as the class value that is rejected in a negative state [11]. The final stage is delivering the optimization results of Faster R-CNN in detecting breast cancer. This study's proposed approach uses a Ryzen5 4000 series hardware processor, 4 GB NVIDIA GeForce GTX1650Ti GPU, 16 GB RAM, and Windows 10 64-bit.
This section describes optimizing breast cancer detection and classification system with Faster R-CNN. The cancer classification system will determine whether it is benign or malignant. This study utilizes datasets as research subjects to evaluate the performance of the proposed approach, while breast cancer is the object of research.
4.1 Online dataset MIAS breast cancer
This study uses the MIAS online dataset amount of 322 image data. The data consists of two categories, namely Benign and Malignant breast X-rays. This study took 63 Benign and 52 Malignant data, which served as the primary model—263 data for training and 115 for testing deep learning capabilities.
4.2 Optimization image
This study's optimization section seeks to improve breast cancer image data [16]. The data comes from the normalized MIAS dataset. The following is a list of optimization scenarios in this study, as shown in Table 1.
Table 1. Image data optimization list
|
Prop. Approach |
Optimization |
Software |
|
Scenario1 |
Threshold |
Mathlab |
|
Scenario2 |
16 Colors |
ImageJ |
|
Scenario3 |
5 Ramps |
ImageJ |
|
Scenario4 |
Matplotlib |
Python |
Table 1 provides information on this study's image data optimization list. The optimization serves to generate special features in an image. The following is an example of an image from the MIAS dataset before optimization, as shown in Figure 2.
Figure 2. MIAS image data
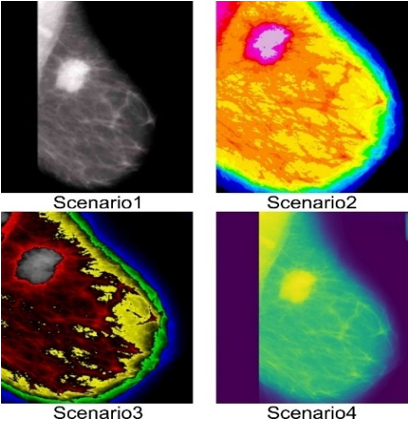
Figure 2 shows an image of breast cancer originating from MIAS and has been normalized. Next is the optimization process with four segmentation scenarios. The results of each scenario produce different images, as shown in Figure 3.
Figure 3 provides an overview of the results of the image optimization process on the MIAS dataset. The optimization consists of four scenarios: the first threshold, the second 16 Colors, the third 5 Ramps, and the fourth matplotlib. Next, perform data augmentation of image data from each scenario.
Figure 3. Four image segmentation scenarios
4.3 Data augmentation
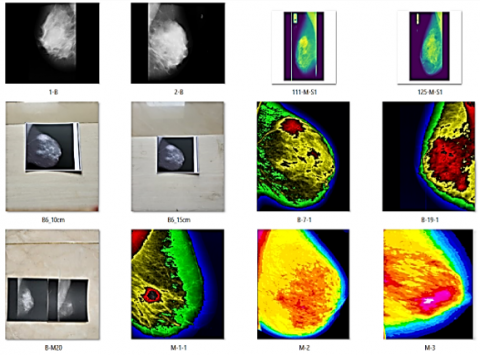
At this stage, multiply the training data from 115 to 263 image data. Multiplying the data is to provide a more comprehensive reference for training data. The following is the application of augmentation data in this study, as shown in Figure 4.
Figure 4. Data augmentation
Figure 4 shows the application of the augmentation process, resulting in a large variety of image data. The augmentation process in this study was done by segmenting, printing and taking breast X-rays through a smartphone camera. The image capture process tests the system's success in detecting and classifying into Benign and Malignant classes.
4.4 Data annotation
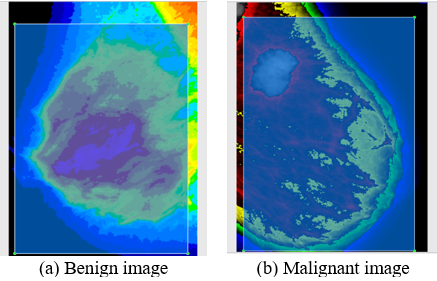
At this stage, perform annotation, namely labelling the image data with python tools, namely labelImg.py; labelling process based on information from the MIAS breast cancer dataset. The label serves as a learning target for the system in recognizing special features in image data. The following is the labelling process in this study, as shown in Figure 5.
Figure 5 presents assigning a label to each breast cancer image—the label functions for cancer attractions in the breast area. For example, point a is the image of Benign class cancer, and point b is the image of Malignant class cancer.
Figure 5. Process data augmentation
4.5 Testing model and training data
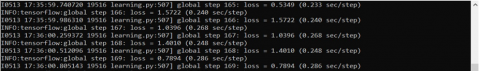
The system performs model testing and training data to identify breast cancer images at this stage. In addition, this stage reduces the value of loss or error when the system detects breast cancer images. The process of testing the model and training data for the Faster R-CNN model is shown in Figure 6. Figure 6 provides an overview of image processing by R-CNN in recognizing special features in the image. The total time of R-CNN in training and testing is 12 hours, with each scenario running for four hours.
4.6 Disease detection and classification
This stage describes system testing results from CNN and Faster R-CNN models for detecting image data classification. The process of testing the proposed approach system in this study through a smartphone camera in real-time. System testing at this stage uses the results of training data scenario1. The following are the results of the detection and system classification of breast cancer images, as shown in Figure 7.
Figure 6. Data training process
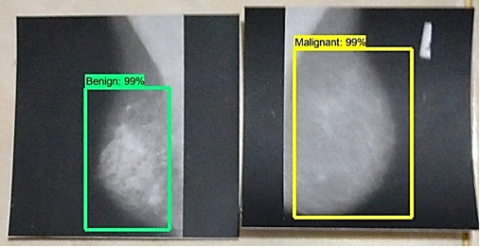
Figure 7. The process of detecting and classicizing breast cancer images
Figure 7 provides information on the accuracy of the proposed approach system. This system's accuracy level is based on model testing and training data results, resulting in an accuracy of 99% in Figure 7. In addition, the system has successfully detected and classified breast cancer into benign and malignant classes.
4.7 Performance evaluation
(a) Scenario1
(b) Scenario2
(c) Scenario3
(d) Scenario4
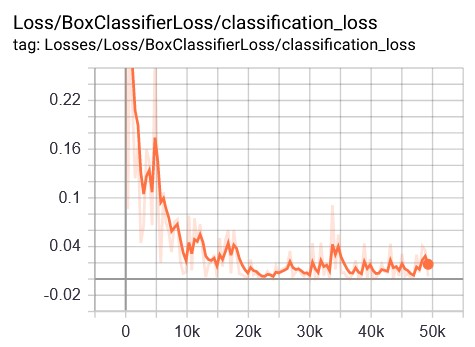
Figure 8. Classification loss performance results
This stage describes the results of the evaluation and analysis of the performance of the proposed approach system. The following is a graph of the classification performance of each scenario during the research, as shown in Figure 8.
Figure 8 provides information on each scenario's performance in this study's proposed approach system. The x-axis in Figure 8 shows the loss value and the y-axis is the number of steps during the training process. Scenario1 obtains an average loss classification value in the range of 0.02-0.01; scenario2 in loss value >0.05; scenario3 at value >0.02; and scenario4 with a loss value of >0.05 during the training process image data. The following is a graph of the total loss for each scenario, as shown in Figure 9.
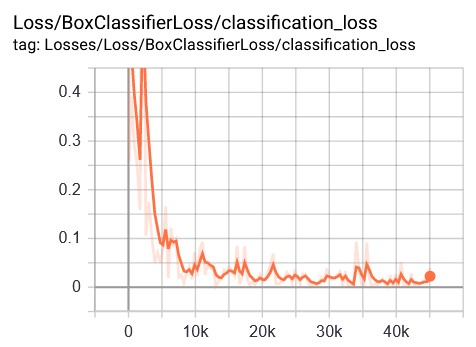
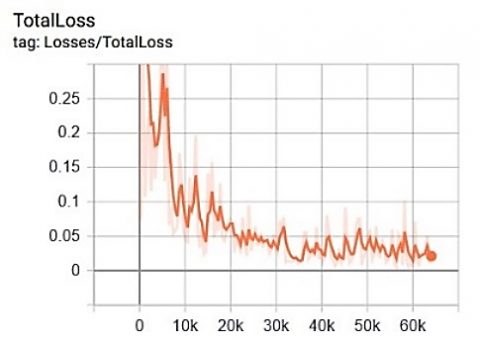
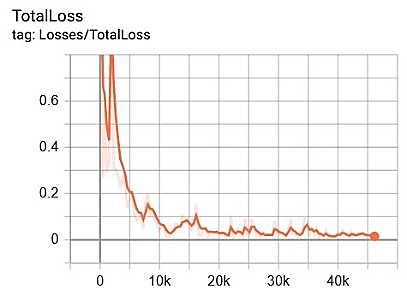
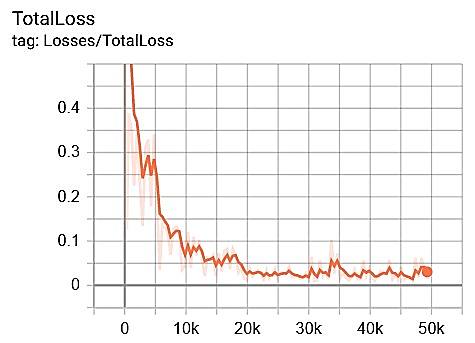
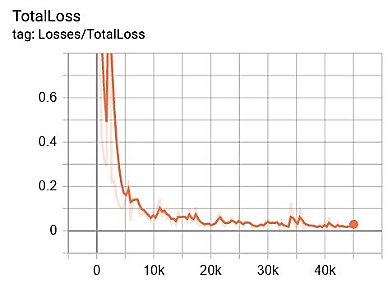
Figure 9 shows a graph of the total loss of the Faster R-CNN model for each scenario. The x-axis in Figure 9 shows the loss value and the y-axis is the number of steps during the training process. The average value of loss for each scenario is about > 0.05, >0.1, >0.05, and >0.1 during the image data training process. Performance evaluation measurements in this study include the Accuracy value for the ratio of Correct predictions (positive and negative) to the overall data; Precision value plays a role in knowing the ratio of correct positive predictions compared to the overall positive predicted results; the value of Recall (Sensitivity) is the ratio of true positive predictions compared to the overall data that is true positive.
Specificity value is the truth of predicting negative compared to the overall harmful data, and the F1 Score is a weighted comparison of the average precision and recall. This research focuses on the value of accuracy. The following is the mathematical calculation of the Accuracy, Precision, Recall, Specificity, and F1 Score levels for each scenario in this study using Eqns. (2) to (6), as shown in Table 2.
(a) Scenario1
(b) Scenario2
(c) Scenario3
(d) Scenario4
Figure 9. Total loss performance results
Table 2 provides information on the performance of the Faster R-CNN model algorithm for each image scenario. In addition, the table provides information on the Accuracy values before and after optimization. Before the optimization process, the accuracy value is 60.86%, and after going through the optimization process with four scenarios, it becomes 63.47%, 90.43%, 85.22%, and 76.52%. Based on the calculation of the Accuracy value results, scenarios have a higher level of accuracy in detecting and classifying breast cancer.
4.8 Report
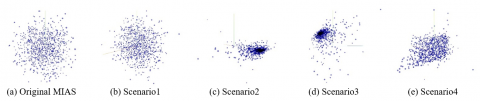
This section presents each breast cancer image scenario before and after optimization efforts. The visualization of image data on the Faster R-CNN system is as shown in Figure 10 which provide an image data distribution overview, including benign and malignant classes. In addition, the image shows how the system determines special features in breast cancer images based on benign or malignant cancer image classes.
Figure 10. Visualization of image data on the Faster R-CNN model system
Table 2. Performance of the Faster R-CNN model algorithm for each scenario
|
Models |
TP |
FP |
TN |
FN |
Accuracy |
Precision |
Recall |
Specificity |
F1 Scr. |
Information |
|
Org. MIAS |
36 |
13 |
34 |
29 |
60.86% |
73.46% |
55.38% |
72.34% |
63.15% |
Before Opt. |
|
Scenario1 |
37 |
15 |
36 |
27 |
63.47% |
71.15% |
57.81% |
70.59% |
63.79% |
Prop. Approach |
|
Scenario2 |
55 |
8 |
49 |
3 |
90.43% |
87.30% |
94.83% |
85.96% |
91.01% |
Prop. Approach |
|
Scenario3 |
53 |
10 |
45 |
7 |
85.22% |
84.13% |
88.33% |
81.82% |
86.18% |
Prop. Approach |
|
Scenario4 |
45 |
18 |
43 |
9 |
76.52% |
71.43% |
83.33% |
70.50% |
76.92% |
Prop. Approach |
Based on the optimization results in this study, image segmentation is very influential in increasing the accuracy of the Faster R-CNN deep learning model. Optimization results with four image segmentation scenarios, namely 63.47%, 90.43%, 85.22%, and 76.52% of the MIAS breast cancer dataset. In the second scenario, the detection and classification accuracy values are from 60.86% to 90.43%; This shows that the more color variations in the image, the more accurate it is. The faster R-CNN recognizes the target area and determines the position of the target to be very precise. The optimization and application of Faster R-CNN in this study is a perfect combination for detecting disease points reliably. The results of this study can help any woman in the early detection of breast cancer independently because the Faster R-CNN system only requires breast mammogram images and a smartphone camera. Women can find out the symptoms or progression of cancer on themselves before having an examination with a specialist. This research innovation supports the work of radiologists and specialists in detecting and classifying breast cancer.
[1] DeSantis, C.E., Ma, J., Gaudet, M.M., Newman, L.A., Miller, K.D., Goding Sauer, A., Siegel, R.L. (2019). Breast cancer statistics, 2019. CA: A cancer journal for clinicians, 69(6): 438-451. https://doi.org/10.3322/caac.21583
[2] Jalil, A.T., Dilfi, S.H., Karevskiy, A. (2019). Survey of Breast Cancer in Wasit Province, Iraq. Global Journal of Public Health Medicine, 1(2): 33-38. https://doi.org/10.37557/gjphm.v1i2.7
[3] Sunardi, S., Yudhana, A., Putri, A.R.W. (2022). Mass Classification of Breast Cancer Using CNN and Faster R-CNN Model Comparison. Kinetik: Game Technology, Information System, Computer Network, Computing, Electronics, and Control, 243-250. http://rsprespira.jogjaprov.go.id/kanker-dan-serba-serbinya-hari-kanker-sedunia-2022, accessed on Dec. 17, 2022.
[4] Momenimovahed, Z., Salehiniya, H. (2019). Epidemiological characteristics of and risk factors for breast cancer in the world. Breast Cancer: Targets and Therapy, 11: 151. https://doi.org/10.2147/BCTT.S176070
[5] Chan, H.P., Samala, R.K., Hadjiiski, L.M. (2019). CAD and AI for breast cancer—recent development and challenges. The British journal of radiology, 93(1108): 20190580. https://doi.org/10.1259/bjr.20190580
[6] Michael, E., Ma, H., Li, H., Qi, S. (2022). An optimized framework for breast cancer classification using machine learning. BioMed Research International, 1-18. https://doi.org/10.1155/2022/8482022
[7] Nagarajan, P.H., Tajunisha, N. (2021). Automatic classification of ovarian cancer types from CT images using deep semi-supervised generative learning and convolutional neural network. Revue d'Intelligence Artificielle, 35(4): 273-280. https://doi.org/10.18280/ria.350401
[8] Wawage, P., Deshpande, Y. (2022). Real-time prediction of car driver’s emotions using facial expression with a convolutional neural network-based intelligent system. International Journal of Performability Engineering, 18(11): 791. https://doi.org/10.23940/ijpe.22.11.p4.791797
[9] Govindaswamy, K., Ragunathan, S. (2021). Genre classification of telugu and english movie based on the hierarchical attention neural network. International Journal of Intelligent Engineering and Systems, 14(1): 54-62. https://doi.org/10.22266/ijies2021.0228.06
[10] Xie, T., Zhao, Q., Fu, C., Bai, Q., Zhou, X., Li, L., Peng, W. (2019). Differentiation of triple-negative breast cancer from other subtypes through whole-tumor histogram analysis on multiparametric MR imaging. European Radiology, 29(5): 2535-2544. https://doi.org/10.1007/s00330-018-5804-5
[11] Punithavathi, V., Devakumari, D. (2020). Detection of breast lesion using improved GLCM feature based extraction in mammogram images. published by SSRN eLibrary. https://doi.org/10.2139/ssrn.3663875
[12] Farhan, A.H., Kamil, M.Y. (2020). Texture Analysis of Breast Cancer via LBP, HOG, and GLCM techniques. In IOP Conference Series: Materials Science and Engineering, 928(7): 072098. https://doi.org/10.1088/1757-899X/928/7/072098
[13] Fadhil, A.F., Ornek, H.K. (2021). A computer-aided detection system for breast cancer detection and classification. Selcuk University Journal of Engineering Sciences, 20(1): 23-31.
[14] Dawngliani, M.S., Chandrasekaran, N., Lalmawipuii, R., Thangkhanhau, H. (2020). Breast cancer recurrence prediction model using voting technique. In International Conference on Mobile Computing and Sustainable Informatics, 17-28. https://doi.org/10.1007/978-3-030-49795-8_2
[15] Monirujjaman Khan, M., Islam, S., Sarkar, S., Ayaz, F. I., Ananda, M.K., Tazin, T., Almalki, F.A. (2022). Machine learning based comparative analysis for breast cancer prediction. Journal of Healthcare Engineering. https://doi.org/10.1155/2022/4365855
[16] Marsilin, J.R., Jiji, G.W. (2012). An efficient cbir approach for diagnosing the stages of breast cancer using knn classifier. Bonfring International Journal of Advances in Image Processing, 2(1): 1-5. https://doi.org/10.9756/BIJAIP.1127
[17] Orozco, M.C.E., Rebong, C.B. (2019). Vehicular detection and classification for intelligent transportation system: A deep learning approach using faster R-CNN model. Platero, 180(1): 36551. https://doi.org/10.5013/IJSSST.a.20.S2.11
[18] Jiang, H., Learned-Miller, E. (2017). Face detection with the faster R-CNN. In 2017 12th IEEE International Conference on Automatic Face & Gesture Recognition (FG 2017), pp. 650-657. https://doi.org/10.1109/FG.2017.82
[19] Bari, B.S., Islam, M.N., Rashid, M., Hasan, M.J., Razman, M.A.M., Musa, R.M., Majeed, A.P.A. (2021). A real-time approach of diagnosing rice leaf disease using deep learning-based faster R-CNN framework. PeerJ Computer Science, 7: e432. https://doi.org/10.7717/peerj-cs.432
[20] Basysyar, F.M., Dwilestari, G. (2022). House price prediction using exploratory data analysis and machine learning with feature selection. Acadlore Transactions on AI and Machine Learning, 1(1): 11-21. https://doi.org/10.56578/ataiml010103
[21] Zebari, D.A., Zeebaree, D.Q., Abdulazeez, A.M., Haron, H., Hamed, H.N.A. (2020). Improved threshold based and trainable fully automated segmentation for breast cancer boundary and pectoral muscle in mammogram images. IEEE Access, 8: 203097-203116. https://doi.org/10.1109/ACCESS.2020.3036072
[22] Peryanto, A., Yudhana, A., Umar, R. (2020). Rancang Bangun Klasifikasi Citra Dengan Teknologi Deep learning Berbasis Metode Convolutional Neural Network. Jurnal Ilmiah Teknik Informatika, 8(2): 138. https://doi.org/10.22441/format.2019.v8.i2.007
[23] Sistla, V.P.K., Kolli, V.K.K., Voggu, L.K., Bhavanam, R., Vallabhasoyula, S. (2020). Predictive model for network intrusion detection system using deep learning. Revue d’Intelligence Artificielle, 34(3): 323-330. https://doi.org/10.18280/ria.340310
[24] Peryanto, A., Yudhana, A., Umar, R. (2022). Convolutional neural network and support vector machine in classification of flower images. Khazanah Informatika: Jurnal Ilmu Komputer dan Informatika, 8(1). https://doi.org/10.23917/khif.v8i1.15531
[25] Rahman, M.F., Bambang, B. (2020). Deteksi sampah pada real-time video menggunakan metode Faster R-CNN. Applied Technology and Computing Science Journal, 3(2): 117-125. https://doi.org/10.33086/atcsj.v3i2.1846
[26] Rao, S.U.M., Rao, K.V., Pvgd, P.R. (2022). Medical big data analysis using LSTM based co-learning model with whale optimization approach. International Journal of Intelligent Engineering and Systems, 15(4). https://doi.org/10.22266/ijies2022.0831.56