Nazeer Mohd![]() | Kanhaiya Sharma*
| Kanhaiya Sharma*![]() | Shailaja Salagrama
| Shailaja Salagrama![]() | Renuka Agrawal
| Renuka Agrawal![]() | Harshal Patil
| Harshal Patil![]()
(This article is part of the Special Issue: Technology Innovations and AI Technology in Healthcare)
© 2023 IIETA. This article is published by IIETA and is licensed under the CC BY 4.0 license (http://creativecommons.org/licenses/by/4.0/).
OPEN ACCESS
Wireless body area networks (WBAN) are a popular subfield of wireless sensor networks used for continuous patient monitoring. WBAN is a network of many sensor nodes fused in and around the body to detect a patient's physical and behavioral activities and periodically send data to the base station, which may lead to the degradation of the energy efficiency of Biosensors. The authors proposed energy-efficient clustering methods using unsupervised learning in the present study. Ten sensor nodes were deployed on various parts of the human body using the OMNET++ simulator for analyzing multiple parameters using a systematic or query-based approach. The clustering approach is finalized based on the cluster head and obstacles in the deployment area. By reducing the number of packets, reception, and transmission, the sensor nodes can be disseminated, which improves the biosensors’ lifetime. The number of rounds and network lifetime was studied by changing biosensors' critical parameters like first node death. The outcome was compared with the existing clustering protocols and found that the proposed protocol has been observed to increase network life span compared to the existing approaches, which will help to design an intelligent health monitoring system.
clustering, cluster head selection, energy-efficient, network lifetime, wireless body area sensor networks
According to the WHO report, as of 22 May 2022, over 522 million confirmed cases and over six million deaths have been reported globally. Save a patient's life requires emerging technology-based medical equipment and medical services within a period. One of the efficient methods of modern medical technology is Virtual Medical Organization (VMO) which communicates with physicians & medical organizations to remotely monitor the patient and share resources wireless using body area networks (WBANs) made of various intelligent biosensors.
Critical care patients are intermittently monitored, with the frequency varying according to the patient's sickness, and some of the monitoring is based on physical examination and direct observation. Other monitoring is continual and constant, given by sophisticated equipment that someone with specialized training and experience must operate. Most of these devices sound alert when certain physiologic thresholds are reached. The procedures for looking into alarms should be adequately adhered to in every intensive care unit (ICU).
Vital indicators (temperature, blood pressure, pulse, and respiration rate), total fluid intake and output, and frequently daily weight are all typically monitored. Ha et al. [1] provide details about placing the biosensor nodes such as thermocouple (TC) sensor and electrocardiography (ECG) sensor they are used for measuring the heart rate and body temperature measurement. The placement of ECG can be on the armpit, chest, and back thigh, and the TC sensor on the thumb, finger, and ear. The biosensor, located on the patient body parts to the base station for the process, is used to cause the energy consumption of the biosensor and reduces its lifetime [2, 3]. In most cases, the biosensors deployed on the patient capture the patient's movement in the hospital and process the data by Emergency Medical Technicians (EMTs), nurses, or physicians [4]. The WBAN technology can be implemented in a hospital or patient's home to improve the tracking of the attributes related to disease, monitoring the diagnosis, health care delivery, and related medical procedures. Also, WBAN helps reduce the infection spread through wireless communication. These devices in the wireless area network are invasive, which need to be implanted in the person, and noninvasive, which can be worn by the person. Healthcare applications require highly accurate predictions on a real-time basis for their decision-making. The various algorithms used by the clustering in WBN to increase its lifetime by reducing the energy consumption of biosensors are as follows, in the study [5], the M-ATTEMPT algorithm is used to form clusters using cost function and increases the lifetime of biosensors and the death of the first biosensor after more number of rounds and time. Alsheikh et al. [6] uses Machine learning (ML) techniques to perform routing, processing, and clustering. In this way, it is used to provide energy-efficient protocol and increases the life span of the biosensors. It is evaluated using a MATLAB simulator and compared with MELM, PRDA, PNNDA, and LEACH protocols. Khan et al. [2] uses ML to compress the data sent to the cluster head. The amount of data communication within the cluster is reduced by using filtering. To reduce the energy consumption of the biosensor, it uses filtration and reduces the load on the cluster head [4]. Mohanty and Kabat [7] use a technique based on the priority the data is communicated within the cluster to reduce energy consumption. Authors [8] reduce the energy consumption by transmitting the value to the cluster head only if it varies from its previous value. It stored the last value and comparison with it. It uses a genetic algorithm to find the shortest path for communication and reduce energy consumption, but it contains high complexity. Yan et al. [9] uses the concept of the Artificial Bee to provide optimal communication, but it is applicable for mesh topology. Nazeer et al. [10] provide a mechanism for reducing the number of packet transmissions and reception using the L and S algorithm. It provides a new protocol for data-centric routing where the sink will generate a query and forward it to all the sensor nodes. The nodes fulfilling the constraint of the question will respond to the sink by using an optimized energy approach and increase a network lifetime. Ramamurthy et al. [11] provides a mechanism for optimized cluster head selection by considering constraints like energy, distance, and hop count. Xu and Manman [12] use a Genetic Ant-based approach to reduce energy consumption, but the drawback of this approach is its complexity. Agnihotri and Gupta [13] provides a protocol that increases the lifetime of the sensor nodes by up to 23% by using a hybrid PSO-GA scheme, but energy management has not been done correctly. Javaid et al. [14] efficiently uses the power and provides more value to the throughput, but the problem is that there is no synchronization between the sensor nodes. Zhao et al. [15] uses agglomerative nesting, i.e., hierarchal clusters for the clustering. It considered the scenario of both homogenous and heterogeneous nodes for selecting the cluster head and increasing the lifetime of the sensor nodes. Xian et al. [16] provides details about the simulation and comparison among various routing protocols by considering mobile nodes and evaluating them using multiple performance metrics in numerous situations. Based on the survey, most of the existing protocols like [2, 4, 10] for WBAN have been implemented for biosensor nodes with a static environment without taking into consideration whether the biosensor is homogenous or heterogeneous. Zhao et al. [15] consider both, but they are complex. We consider a biosensor is deployed on the patient, and they form a cluster to send the data to the sink. Here, we can consider both homogenous and heterogeneous biosensors with static and moving/mobile environments. Jaber and Idrees [17] provides the importance of increasing the wireless biosensors for health monitoring and the role of ML techniques in the health domain. Liu et al. [18] discusses optimizing the current techniques of WBAN and its dependencies of biosensors in the future healthcare domain. Supritha Devi et al. [19] provide details of using supervised ML techniques to automate the system instead of doing it manually. Existing literature shows that ML is frequently used to develop wearable devices [20] and the Internet of Things (IoT) with ML is used to detect diseased conditions [21]. Hence it is necessary to convert the manual health monitoring system to an automated health monitoring system.
This proposed article aims to make the energy-efficient utilization of the biosensor nodes in the health domain to make an automated patient monitoring system by overcoming the drawback of reducing the energy consumption by the biosensor nodes and increasing the lifetime using unsupervised ML. The authors proposed an unsupervised machine-learning technique of clustering, forming the cluster, selecting the optimized cluster head, and predicting the lifespan of the biosensor. Section I provide a detailed description of the introduction and literature survey. Section II describes ML. Section III, Results and Discussion Section IV Conclusion and Future work.
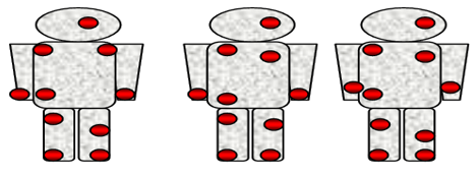
ML is one of the essential components of Artificial Intelligence (AI), and in the last two decades, it has gained more attention in all areas of engineering and social problems. Most Regression, Classification, Clustering, graph-based problems, and Heuristic search problems can be solved using supervised, unsupervised, semi-supervised, and reinforcement learning. The proposed system used two unsupervised learning-based algorithms based on the cluster head and obstacles K-means, K- Harmonics (KHM). In the proposed study authors consider ten different sensor nodes on various body parts of humans for sensing multiple body parameters as shown in Figures 1 and 2. These values are sensed and transmitted by the sensor nodes using two methods. While performing simulation, we generate scaler and vector files for single-patient and multi-patient models using a homogenous and heterogeneous biosensor. This data can be used as training data for the linear regression model to predict the life span of the biosensor for that environment. In the future, we want to obtain the data set from various resources to train the model to predict the life span of the biosensor in various situations and environments. In the proposed system, ten different sensor nodes are placed on various body parts of the patient for detecting multiple body parameters such as temperature, blood pressure, pulse, etc., as shown in Figures 1 and 2. These values are sensed and transmitted by the sensor nodes using two methods.
2.1 Single patient model
In this model, the biosensor sends the data directly to the sink; it will be efficient if the distance between the biosensor and sink is less, but as the distance increases, energy depletion increases. The sink's performance also depends upon the number of biosensors sending the data. If a large number of biosensors send the data, it reduces sink performance too. To increase the life span of biosensors, we proposed below two methods.
Systematic method: The biosensor will sense and transmit the value based on the regular time interval. as shown in the figure below, it will send its value directly to the sink.
Query method: The sensor node will sense the value based on the sink's query. It is an optimization approach in which the life span of the biosensor is increased by performing data transmission and reception based upon the query sent by the sink. It will not sense the value continuously as in the systematic method.
Figure 1. (a) Single patient
Figure 1. (b) Deployment of bio-sensor on human in the single patient model
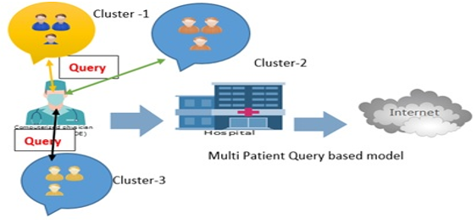
2.2 Multi-patient model
In this model, the biosensor forms clusters and sends the data to the local cluster head. It will be efficient as the distance between the biosensor and cluster head is always minimum. The sink's performance also increases as only the cluster head will send the data to the sink. To increase the life span of biosensors, we proposed below two methods.
Periodic method: The biosensor will sense and transmit the value based on the regular time interval. as shown in above Figure 1, it will send its value directly to the cluster head shown in Figure 2.
Query method: The sensor node will sense the value based on the sink's query. It is an optimization approach in which the life span of the biosensor is increased by performing data transmission and reception based upon the query sent by the sink. It will not sense the value continuously as in the systematic method.
Figure 2. (a) Multi-patient
Figure 2. (b) Deployment of bio-sensor on human in the multi-patient model
2.2.1 Cluster head selection
We have provided two different mechanisms for selecting the cluster head based on the deployment area. If we are creating the multi-patient model in an environment with obstacles, then the cluster head selection is made using the K harmonic mean, and in the absence of obstacles, the cluster head selection is made using the K Mean approach. It has been observed that the selection of the cluster head based upon obstacle presence will affect the lifespan of biosensors. We have evaluated both approaches by considering homogeneous and heterogeneous nodes. The quantification model of this paper has been published by considering various scenarios. The cluster head selection mechanism uses the approach of Leveling and Sectoring algorithm [10] for homogenous nodes. The heterogeneous nodes cluster head selection is made [11].
Based on the situation of the patients, the medical team will decide whether they will use periodic or query-based methods. Each method has its advantages and disadvantages, as shown in Table 1.
Figure 3. Flow chart of the proposed model
Figure 3 provides details about the two strategies that can monitor the patients using a periodical or query-based approach for the single and multi-patient model. From Figure 3, it is clear that in the case of the single-patient model, the final message from the sensor is sent to the sink while in the case of the multi-patient model the three additional steps are performed for cluster formation, selection of cluster, cluster head, and send message to cluster head was introduced. If a sensor has minimum distance and maximum energy compared to the entire nodes in the existing system, then it will be selected as a forwarder node. Multi-hopping is used to reduce data communication distance and save energy consumption. The authors proposed following unsupervised MLbased algorithms for creating clusters and optimizing cluster head selection mechanisms to minimize distance and energy consumption.
Table 1. Types of the patient model
|
Single patient model (SPM) |
Multi patient model |
|
Minimum cost |
The cost will be more than SPM |
|
Lifetime depends upon a periodic model or query-based model |
Increases lifetime of sensor nodes |
|
Simple for implementation |
It uses a clustering concept that is a bit complex |
|
Suitable for small-scale health center |
Ideal for large-scale health center |
Algorithm single patient model
Start
Step 1: TI, BS //TI: = Time interval //BS: = Biosensor
Step 2: Periodic () //function
If (TI is true) // check condition
BS → generate →reading →sink //the bio sensor send value to the sink
End if
Step 3: Query based () //function
If (query is satisfied by BS) // check condition
BS → generate →reading →sink //the bio sensor send value to the sink
End if
End
Algorithm Multi patient model
Start
Step 1: TI, BS //TI: = Time interval
TH: = Threshold Energy
BS: = Biosensor
CH: = Cluster Head
CM: = Cluster members
Step 2: Cluster formation () //function
BS from cluster → k-mean // without obstacle
BS from cluster → KHM // with obstacle
Step 3: CH selection () //function
for BS 1 to n // checking the energy level and distance of bio sensor
BS energy > TH & BS distance == centroid
Selected as CH
End of for
Step 4: Periodic () // function
If (TI is true)
BS → generate →reading →CH
End if
Step 5: CH→ Sink
Step 6: Query based () //function
If (query is satisfied by BS/CM)
BS → generate →reading →CH // bio sensor sends values to cluster head
End if
CH→ Sink
End
The simulation has been done by using the OMNET++ 5.5.1 simulator, which is well-defined in WSN, WBAN, and VANET [22, 23]. The existing EERP [23], MLM [24], and proposed K-Mean and KHM [24, 25] have been simulated by considering various nodes, as shown in Table 2. The protocols have been evaluated by considering multiple performance metrics such as first-node death, last-node death, number of packet transmissions, and the dissimilation of the energy. The detailed procedure of depletion of the biosensor energy model is shown in Figure 4.
Figure 4. Depletion of biosensor energy model
Table 2. Simulation parameters
|
Parameter |
Values |
|
E elec |
16.7nJ/bit |
|
e amp |
1.97pJ/bit |
|
E comp |
36.1nJ/bit |
|
DATA size |
2000 bit |
|
Num. of nodes (N) |
10-50 |
|
Initial Battery charge |
3.0 J |
|
Sensed area |
50 m 2 |
Figure 5. Communication messages between the nodes
The biosensor is deployed using the (x, y) coordinates on various body parts. The value of the coordinates has been initialized by using the uniform function, which is used to provide the random number, and it has been ensured that no two sensor nodes get the exact coordinates values, as shown in Figure 5. The sink will send a query directly to the sensor nodes using the advertisement message in a single patient model. The biosensor will send a reply to the sink using a data message. The transmission of the messages between the sink and biosensor is shown in Figure 6. Its values are recorded in the scalar file, and the dissemination of the energy due to data transmission and reception has been recorded in the vector file. The various messages exchanged between the cluster members and the cluster head before the dispatch of the actual data are shown in Figure 6.
The node that wants to act as cluster head will send the advertisement message to all the sensor nodes. The nodes wished to become as the cluster member will send the reply back to the cluster head by using the join cluster message, then the cluster head will send the scheduler message to cluster members, the time at which it can send the value to the cluster head in the periodic method, whereas in the query-based process it sends data based upon the query received from the cluster head. The dissemination of the node's energy occurs due to the following operation, and dissemination is evaluated using the formulas as per Eqns. (1)-(3).
Table 3. Symbolic description
|
Symbol |
Description |
|
Et |
Transmission energy |
|
Er |
Reception Energy |
|
ED |
Data transmission energy |
|
Select |
Circuit energy |
|
eamp |
Transmitter amplifier energy |
|
Eco map |
Computational energy |
|
X |
Number of bits |
|
N |
Number of messages |
|
D |
Distance |
$E_t=E_{\text {elec }} * x+e_{a m p} * x * d^2$ (1)
$E_r=E_{\text {elec }} * x$ (2)
$E_D=E_{c o m p} * x * n$ (3)
Eq. (1) is used to indicate the amount of energy depletion that occurs when the transmission of the data occurs by the biosensor. Eq. (2) represents the depletion of energy that occurred while receiving the packet from the biosensor/sink. Eq. (3) indicates the amount of energy required for compressing the data. Table 3 provides the symbolic description of the symbols used for the quantification model.
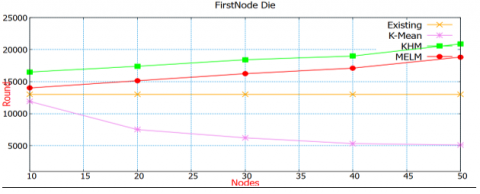
Below mention, Tables 4, 5, and 6 provide the reading obtained from the scalar files by simulating the proposed K- Mean, KHM (K Harmonic Means), and existing protocols (EERP, MELM) by varying the number of nodes. Table 5 reading shows that the First Node Death (FND) occurs after the same number of rounds in the existing protocol which is shown in Figure 6. Even though the number of nodes has been increased, they are identical, whereas the number of rounds in the proposed protocol of K Harmonic Means, (KHM) is more due to the efficient utilization of the biosensor’s energy. It can be seen that the first node death occurs after more rounds in KHM than in the K-Mean. Table 6 shows the simulation result with a variation in the number of nodes when the Last Node Death (LND) occurs after more time in the existing protocol with the increase in the number of nodes, but its end node dies in less time than the proposed protocol; therefore, the proposed protocols increase the biosensor lifespan. It can also be seen that the LND occurs after more rounds in KHM than in the K-Mean. The graphical representation of the simulation result is shown in Figure 7. Another observation is the number of packet transmissions is identical in the existing protocol with the increase in the number of nodes, but as packet transmission increases with the increase in the number of nodes in the proposed protocol. It can be seen that the packet transmission also increases in KHM than the K Mean which is shown in Figure 8.
Table 4. Simulation result of FND
|
Nodes |
Existing |
K Means |
KIM |
MEL |
|
10 |
13020 |
11900 |
16500 |
14010 |
|
20 |
13020 |
7507 |
17400 |
15143 |
|
30 |
13020 |
6222 |
18420 |
16238 |
|
40 |
13020 |
5326 |
19002 |
17112 |
|
50 |
13020 |
5100 |
20900 |
11834 |
Figure 6. First node death
Table 5. Variation of nodes with FND
|
Nodes |
Existing |
K Means |
KIM |
MEL |
|
10 |
15624 |
16766 |
20014 |
15910 |
|
20 |
18228 |
20906 |
25701 |
19230 |
|
30 |
20832 |
25350 |
32612 |
23010 |
|
40 |
22213 |
27512 |
38145 |
24910 |
|
50 |
24024 |
29015 |
43012 |
27198 |
Figure 7. Last node death
Figure 8. Number of packets
Table 6. Variation of nodes with LND
|
Nodes |
Existing |
K Means |
KIM |
MEL |
|
10 |
10321 |
13896 |
16500 |
11034 |
|
20 |
10321 |
14861 |
18425 |
12430 |
|
30 |
10321 |
15381 |
20400 |
13429 |
|
40 |
10321 |
16472 |
22145 |
15230 |
|
50 |
10321 |
17249 |
24894 |
16112 |
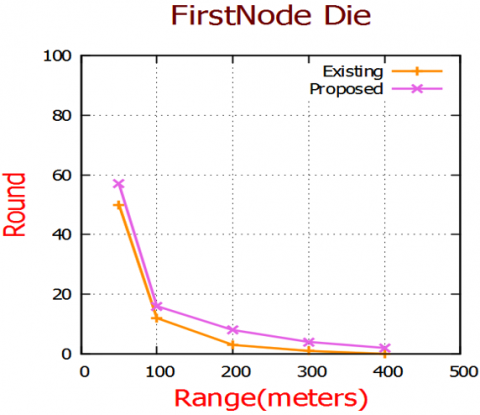
4.1 Comparison between proposed and existing protocol by varying coverage regions of biosensor
From Figures 9 and 10, it is clear that if the range of the sensor nodes is increased from 50 to 400 meters square for communication in single-hop rather than multi-hop. The first node death after more rounds in the coverage region of 50 meters, but if it has been increased to 100, there is a sudden decrease in the number of rounds in both the existing and proposed protocols. Therefore, the number of rounds of the sensor nodes depends upon the coverage region, and the number of rounds in the proposed protocol is more than the existing as shown in Table 7 below.
Figure 9. First node death
Figure 10. Last node death
To better understand the relation between the energy consumption number of sensor nodes and different approaches, simulation is performed for FND, LND, and a combination of both by varying the number of sensor nodes at the interval of 50 ranging from 50-250 at fixed 1-joule energy. Data collected from the simulation are shown in Tables 8-10 and graphical representation is shown in Figures 11, and 12. From Table 8 and Figure 10 it is clear that, if the number of sensor nodes increases, the current system to energy depletion is static, as energy depletion is less in K-Means and KHM. First, Node death occurs after more rounds in KHM compared to K-Mean and existing protocols. Last node death occurs after more K-Mean rounds than KHM and existing protocols. Therefore, K-Mean can be utilized in the application where it requires more biosensor lifespan and does not bother about the first biosensor node death. Several data packets occur more in number in K-Mean than in KHM and existing protocols. Therefore, K-Mean can be utilized in applications requiring more biosensor lifespan and packet transmission.
Table 7. Simulation result of first node death and last node death by changing the range of sensor nodes
|
Edge/Range |
Existing |
Proposed |
||
|
|
FND |
AND |
FND |
AND |
|
50 |
50 |
60 |
57 |
64 |
|
100 |
12 |
24 |
6 |
24 |
|
200 |
3 |
3 |
8 |
6 |
|
300 |
1 |
1 |
4 |
3 |
|
400 |
0 |
0 |
2 |
1 |
Table 8. Simulation result of first node death and last node death by changing the number of sensor nodes
|
Nodes |
Existing |
K Means |
KIM |
MEL |
|
50 |
50 |
53 |
72 |
52 |
|
100 |
50 |
65 |
100 |
59 |
|
150 |
50 |
76 |
148 |
62 |
|
200 |
50 |
64 |
159 |
68 |
|
250 |
50 |
74 |
223 |
186 |
Figure 11. First node death
Figure 12. Last node death
Table 9. First node death and last node death by changing the number of sensor nodes
|
Nodes |
Existing |
K Means |
KIM |
MEL |
|
50 |
100 |
180 |
174 |
152 |
|
100 |
151 |
381 |
384 |
298 |
|
150 |
202 |
804 |
792 |
510 |
|
200 |
253 |
1235 |
1110 |
903 |
|
250 |
304 |
2088 |
2202 |
1980 |
Table 10. First node death and Last node death by changing the number of sensor nodes
|
Nodes |
Existing |
K Means |
KIM |
MEL |
|
50 |
51 |
90 |
83 |
72 |
|
100 |
51 |
127 |
126 |
98 |
|
150 |
51 |
201 |
188 |
150 |
|
200 |
51 |
247 |
220 |
198 |
|
250 |
51 |
348 |
322 |
290 |
4.2 Comparison between proposed and various existing protocols by using homogenous and heterogeneous biosensors
In the proposed study authors obtained simulated results by randomly deploying the ten biosensors on patients at various positions. The simulation has been done using the OMNET++ simulator and compared with the metrics mentioned in Tables 11 and 12. From Table 11 it is clear that the proposed algorithm is increasing the network life span up to 96.90% in the case of homogeneous biosensors at 0.5J, which is better than the existing available literature. In the case of heterogeneous biosensors, there is a significant improvement in the FND, LND, and number of rounds. The proposed algorithm has been observed to reduce energy consumption and increase the network life span in the case of homogenous and heterogeneous biosensors.
Table 11. A performance comparison between the five clustering protocols in the homogeneous networks (the initial energy at 0.5 J)
|
References |
Protocol |
First node death (Milli sec) |
Last node death (Milli Sec) |
Number of rounds |
Network Life Span |
|
[2] |
LEACH |
30 |
173 |
204 |
94.5% |
|
[2] |
PRADA |
34 |
186 |
210 |
96% |
|
[2] |
PNNDA |
39 |
204 |
190 |
90% |
|
[8] |
Artificial bee Colony |
45 |
230 |
241 |
95% |
|
[11] |
Ant colony Algorithm |
42 |
244 |
220 |
96.76% |
|
Proposed |
Proposed algorithm |
54 |
259 |
256 |
96.90% |
Table 12. A performance comparison between the five clustering protocols in the heterogeneous networks (the initial energy at 0.3-0.5 J)
|
References |
Protocol |
First node death (Milli Sec) |
Last node death (Milli Sec) |
Number of rounds |
|
[2] |
LEACH |
18 |
195 |
210 |
|
[2] |
PRADA |
23 |
210 |
220 |
|
[2] |
PNNDA |
29 |
220 |
215 |
|
[8] |
Artificial bee Colony |
30 |
245 |
243 |
|
[11] |
Ant colony Algorithm |
32 |
234 |
230 |
|
Proposed |
Proposed algorithm |
45 |
260 |
240 |
This paper presented a clustering method to optimize energy consumption and increase the life span of the wireless body sensor nodes by reducing unnecessary packet transmission and reception. The authors proposed two models, single-patient and multi-patient, depending on the hospital based on the query, and packet transmission and reception decided by the medical staff depending upon the patient. The proposed algorithm reduces energy consumption by reducing the number of packet transmissions and reception. We compared the proposed and existing algorithms using performance metrics such as first biosensor death, last biosensor death, and the number of times the biosensor sent the data to the sink in several rounds.
[1] Ha, S., Park, S., Lim, H., Baek, S.H., Kim, H.K., Yoon, S.H. (2019). The placement position optimization of a biosensor array for wearable healthcare systems. Journal of Mechanical Science and Technology, 33(2): 3237-3244. https://doi.org/10.1007/s12206-019-0619-0
[2] Khan, R.A., Mohammadani, K.H., Soomro, A.A., Hussain, J., Khan, S. Arain, T, H., Zafar, H. (2018). An energy efficient routing protocol for wireless body area sensor networks. Wireless Pers Commun, 99: 1443-1454. https://doi.org/10.1007/s11277-018-5285-5
[3] Ullah, I., Youn, H.Y. (2000). Efficient data aggregation with node clustering and extreme learning machine for WSN. The Journal of Supercomputing, 76(4): 10009-10035. https://link.springer.com/article/10.1007/s11227-020-03236-8, accessed on Jan. 10, 2023.
[4] Kandukuri, S., Lebreton, J., Lorion, R., Murad, N., Daniel Lan-Sun-Luk, J. (2016). Energy-efficient data aggregation techniques for exploiting spatio-temporal correlations in wireless sensor networks. 2016 Wireless Telecommunications Symposium (WTS), London, UK, pp. 1-62016.
[5] Ghate, V.V., Vijayakumar, V. (2018). Machine learning for data aggregation in WSN: A survey. International Journal of Pure and Applied Mathematics, 118(24).
[6] Alsheikh, M.A., Lin, S., Niyato, D., Tan, H.P. (2014). Machine learning in wireless sensor networks: algorithms, strategies, and applications. IEEE Communications Surveys & Tutorials, 16(4): 1996-2018. https://doi.org/10.1109/COMST.2014.2320099
[7] Mohanty, P., Kabat, M.R. (2016). Energy efficient reliable multi-path data transmission in WSN for healthcare application. International Journal of Wireless Information Networks, 23:162-172. https://doi.org/10.1007/s10776-016-0307-2
[8] Sagar, A.K., Singh, S. Kumar, A. (2020). Energy-aware WBAN for health monitoring using critical data routing (CDR). Wireless Pers Commun 112, 273-302. https://dl.acm.org/doi/10.1007/s11277-020-07026-6, accessed on Jan. 1, 2023.
[9] Yan, J., Peng, Y., Shen, D., Yan, X., Deng, Q. (2018). An artificial bee colony-based green routing mechanism in WBANs for sensor-based e-healthcare systems. Sensors, 18(10): 3268. https://doi.org/10.3390/s18103268
[10] Nazeer, M., Garimella, R.M., Singh, R.P. (2017). Leveling and sectoring algorithm: lattice point problem (quantification of energy savings). the 1st International Conference. https://doi.org/10.1145/3109761.3158396
[11] Ramamurthy, G., Nazeer, M., Swamy, T.J. (2022). Energy-efficient clustering in real-world wireless. sensor networks: Implementation. Soft Computing and Signal Processing. Advances in Intelligent Systems and Computing, 1340. https://doi.org/10.1007/978-981-16-1249-7_15
[12] Xu, G.X., Manman, W. (2014). An energy-efficient routing mechanism based on genetic ant colony algorithm for wireless body area networks. Journal of Networks, 9(12): 3366-3372. https://doi.org/10.4304/jnw.9.12.3366-3372
[13] Agnihotri, A., Gupta, I.K. (2018). A hybrid PSO-GA algorithm for routing in wireless sensor network. 2018 4th International Conference on Recent Advances in Information Technology (RAIT), Dhanbad, India, pp. 1-62. https://doi.org/10.1109/RAIT.2018.8389082
[14] Javaid, N., Ahmad, A., Khan, Y., Khan, Z.A., Alghamdi, T.A. (2015). A relay based routing protocol for wireless in-body sensor networks. Wireless Pers Commun, 80: 1063-1078. https://doi.org/10.1007/s11277-014-2071-x
[15] Zhao, Z., Xu, K., Hui, G., Hu, L. (2018). An energy-efficient clustering routing protocol for wireless sensor networks based on agnes with balanced energy consumption optimization. Sensors, 18(11): 3938. https://doi.org/10.3390/s18113938
[16] Xian, X.D., Shi, W.R., Huang, H. (2008). Comparison of OMNET++ and other simulator for WSN simulation. 2008 3rd IEEE Conference on Industrial Electronics and Applications, Singapore, pp. 1439-1443. https://doi.org/10.1109/ICIEA.2008.4582757
[17] Jaber, A.S., Idrees, A.K., (2022). Wireless body sensor networks: applications, challenges, patient monitoring, decision making, and machine learning in medical applications. AI and IoT for Sustainable Development in Emerging Countries. Lecture Notes on Data Engineering and Communications Technologies, 105. Springer, Cham. https://doi.org/10.1007/978-3-030-90618-4_20
[18] Liu, Q., Mkongwa, K.G., Zhang, C. (2021). Performance issues in wireless body area networks for the healthcare application: a survey and future prospects. SN Applied Sciences 3(2). https://link.springer.com/article/10.1007/s42452-020-04058-2, accessed on Jan. 10, 2023.
[19] Supritha Devi, Y.S., Prasad, T.K.D, Saladi, K., Nandan, D. (2020). Analysis of precision agriculture technique by using machine learning and IoT. Soft Computing: Theories and Applications. Advances in Intelligent Systems and Computing, 1154: 859-867. https://doi.org/10.1007/978-981-15-4032-5_77
[20] Chowdhury, M.E., Khandakar, A., Qiblawey, Y., Reaz, M.B.I., Islam, M.T., Touati, F. (2020). Machine learning in wearable biomedical systems. Sports Science and Human Health - Different Approaches. https://doi.org/10.5772/intechopen.93228
[21] Wadhwani, N., Mehta, N., Ruban, N. (2019). IOT based biomedical wireless sensor networks and machine learning algorithms for detection of diseased conditions. 2019 Innovations in Power and Advanced Computing Technologies (i-PACT), Vellore, India, pp. 1-7. https://doi.org/10.1109/i-PACT44901.2019.8960191
[22] Wheeb1, A.H., Naser2, M.T. (2021). Simulation based comparison of routing protocols in wireless multihop ad hoc networks. International Journal of Electrical and Computer Engineering (IJECE), 11(4): 3186-3192. http://doi.org/10.11591/ijece.v11i4.pp3186-3192
[23] Wheeb1, A.H., Al-Jamali N.A.S. (2022). Performance Analysis of OLSR Protocol in Mobile Ad Hoc Networks. International Journal of Interactive Mobile Technologies (iJIM), 16(1): 106-119. http://doi.org/10.3991/ijim.v16i01.26663
[24] Tian, Y., Liu, D., Qi, H. (2009). K-harmonic means data clustering with Differential Evolution. 2009 International Conference on Future BioMedical Information Engineering (FBIE), pp. 369-372. https://doi.org/10.1109/FBIE.2009.5405840
[25] Zhi, X.B., Fan, J.L. (2010). Some notes on k-harmonic means clustering algorithm. Quantitative Logic and Soft Computing 2010, pp. 375-384. https://doi.org/10.1007/978-3-642-15660-1_36