Nofitasari Dwi Rezeki | Suci Aulia | Sugondo Hadiyoso*
© 2022 IIETA. This article is published by IIETA and is licensed under the CC BY 4.0 license (http://creativecommons.org/licenses/by/4.0/).
OPEN ACCESS
Alzheimer's dementia (AD) is the most common type of dementia, usually characterized by memory loss followed by progressive cognitive decline and functional impairment. AD is one of the leading causes of death and cannot be cured, but proper medical treatment can delay the severity of the disease. Early detection of AD can detect early and prevent the disease from getting worse. So, we need a system that can detect AD as a means of support for the clinical diagnosis. In this study, a system was designed to classify the severity of AD using the Convolutional Neural Network (CNN) method with VGG-16 and VGG-19 modeling. From the simulation results with a total of 4,160 MRI datasets, the highest accuracy rate was 98.28% with VGG-19 architecture using Adam's Optimizer for the classification of 3 classes, namely no dementia (normal), mild dementia, and moderate dementia. It is hoped that this study can support clinical diagnosis in assessing the severity of AD.
Alzheimer's dementia, severity, MRI, convolutional neural network
Alzheimer's dementia (AD) is the most common type of dementia. AD usually characterized by memory loss followed by progressive cognitive decline and functional impairment [1]. This disease is generally experienced by the elderly in the age group of 65 years and over [2]. Based on data from Alzheimer's Disease International, the number of people with AD worldwide is increasing rapidly and is estimated to be approaching 50 million people diagnosed with dementia worldwide, 20.9 million in Asia Pacific. In Indonesia, it is estimated that there were around 1.2 million people with dementia in 2015, which will increase to 1.9 million in 2030 and about 4 million people in 2050 [3].
Public awareness in Indonesia of AD is still relatively low. AD disease cannot be cured, but early treatment and further examination will delay the onset of symptoms and reduce other impacts, so medical personnel are required to assist medical personnel to identify the symptoms caused by this disease [4]. In detecting AD, the clinician can observe magnetic resonance imaging (MRI) of the brain. The output of MRI is in the form of digital images, so with the help of image processing technology it can assist in making decisions on the diagnosis of stages in AD disease so as to get appropriate results and reduce human errors in diagnosing a disease [5].
Several studies have developed an AD disease identification system using the Convolutional Neural Network (CNN) method. In a study conducted by Lamis et al. using the CNN method with the VGG-16 architecture to get an accuracy of 97.00% [6]. Subsequent research conducted by Fu'adah et al proposed the AD classification method using the AlexNet architecture and obtained 95.00% accuracy [7]. Another study by Lu et al., proposed MobileNet for AD classification. His research resulted in a detection accuracy of 94.00% [8]. Research by Oktavian et al., performed AD detection using CNN method with ResNet-18 and Weighted Loss architecture resulting in 88.30% accuracy [9]. Based on previously reported studies, it is known that the CNN method can generate high accuracy. One reason is that CNN can divide the input matrix into smaller parts so that it can detect images that are quite accurate and detailed [10]. However, there is still a research gap in improving accuracy.
Based on the presented background, this study proposes a method of detecting and classifying AD severity based on MRI brain images. The AD classification includes three classes: no dementia, mild dementia, and moderate dementia. From this research, it is hoped that it can help clinicians in knowing the severity and predicting the disease to reduce the risk towards the worse.
2.1 MRI Alzheimer dementia dataset
Magnetic Resonance Imaging (MRI) is an examination of internal organs using magnetic technology and radio waves. This examination is done to get a detailed picture of the organs, bones, and tissues in the body. This examination is carried out as a diagnostic tool for doctors in analyzing a disease [5]. This MRI procedure will produce 3D images that can be viewed from various sides. With this, the diagnosis process can be more detailed. The results of this MRI are grayscale images that only have gray and no color.
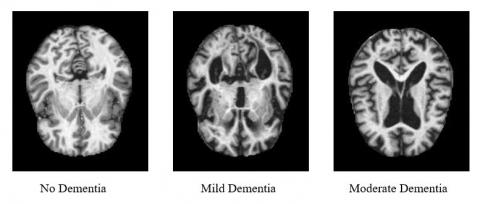
This study uses an MRI image dataset of Alzheimer's disease collected by Servesh Dubey which can be accessed at https://www.kaggle.com/tourist55/alzheimers-dataset-4-class-of-images. The dataset consists of MRI images of dementia stages of Alzheimer's disease such as no dementia, mild dementia, and moderate dementia. The dataset consists of 4,160 images in *JPG format. For the no dementia dataset there are 3,200 images, 896 for mild dementia, and 64 for moderate dementia [11]. Figure 1 shows the MRI image used during the simulation.
Figure 1. MRI dementia Alzheimer [11]
2.2 Convolutional Neural Network (CNN)
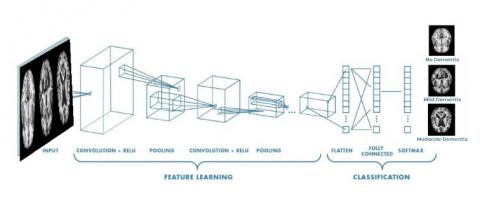
Convolutional Neural Network (CNN) is one type of neural network that is commonly used in image processing. CNN has been widely used to detect and recognize objects in an image. CNN provides a learning model in which the parameters can be trained by the gradient descent method. CNN can process image features with large and complex sizes. The CNN structure mainly consists of feature learning and classification. Feature learning consists of a convolution layer, ReLU, and a pooling layer. While the classification consists of flatten, fully connected, and softmax [12]. The basic model network illustration of the Convolutional Neural Network (CNN) can be seen in Figure 2.
Figure 2. Basic model CNN [13]
2.3 VGG-16 and VGG-19 architecture
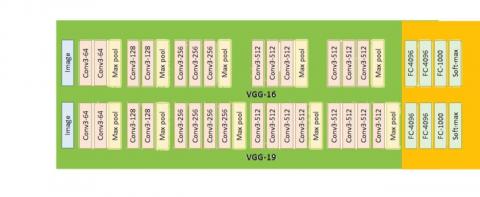
Figure 3. VGG-16 and VGG-19 architecture [14]
This study uses two architectures in the classification consisting of VGG-16 and VGG-19. VGG-16 is a CNN model from Karen Simonyan and Andrew Zisserman. VGG-16 has a total of 16 layers, namely 13 convolutional layers and 3 fully connected [8]. Meanwhile, VGG-19 is a CNN model which has 19 layers consisting of 16 convolutional layers and 3 fully connected. Details of the architecture of VGG-16 and VGG-19 can be seen in Figure 3.
2.4 Optimizer
Optimizer is an optimization algorithm that works to obtain optimal weights to minimize errors and maximize accuracy. The optimization algorithm used in this study is using Adam Optimizer. Adaptive Moment Optimization (Adam) is a first-order gradient-based optimization algorithm which is computationally efficient and requires a small amount of memory [15]. The mathematical equation of ADAM is as follows:
$\emptyset_{t+1}=\emptyset_t-\frac{\alpha}{\sqrt{\hat{v}_t+\epsilon^2}} \widehat{m}_t$ (1)
where, $\emptyset$ is the parameter to be corrected (weight), $\alpha$ is the step size or learning rate, $\widehat{m}_t$ is the momentum estimate with the corrected bias at that time, $\hat{v}_t$ is the adaptive subgradient estimate with the corrected bias at that time.
2.5 System model
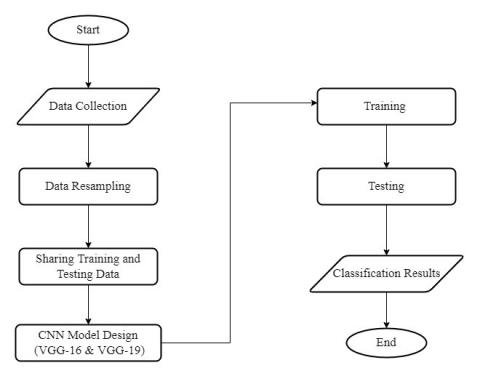
Figure 4. System model
Figure 4 shows the proposed system model for the classification of Alzheimer's Dementia disease consisting of several stages:
At this stage of collecting data used is data from MRI images of Alzheimer's Dementia disease.
At this stage, data processing from the MRI image will be carried out to suit the research needs and a resampling process will be carried out so that the data between classes is balanced. Data resampling is a technique of manipulating data to balance its label proportions. There are 2 ways, namely by Undersampling is a technique to reduce the small number of the large number of the class and Oversampling is a technique to increase the small number of classes as much as the large number of the class.
The training data was taken 70% of the total dataset, namely 4160 images and the test data was taken 30% of the total dataset, namely 4160 images.
This model uses transfer learning with pre-trained models from VGG-16 and VGG-19 which can then be forwarded to the dense layer (512) and ReLU activation. The output layer uses dense (3) and the softmax activation function. Transfer Learning is the process of taking a trained neural network and adapting the neural network to a different new data set by transferring or changing the purpose of the learned features. Transfer learning is also very useful with limited computational resources. Some of the most advanced models take days and weeks in some cases to train even when trained on very powerful GPU engines. So, in order not to repeat the same process over a long period of time, transfer learning allows us to use a pre-trained load as a starting point. Figure 5 shows the design of the CNN model used in the classification process of Alzheimer's Dementia.
Figure 5. CNN model used in this study
The next stage is training. This training was conducted using epochs 3, 5, 10, 15 and batch size 5, 8, 10, 80, 120 and a learning rate of 0.001. The optimizer used is the Adam optimizer. In addition, additional hyperparameters are 600 decay steps and 0.7 decay rate. The various epoch and batch sizes aim to find the best performance from the proposed model.
At this stage, the model tested to classify the images tested was 30% of the total dataset. Performance testing is done by calculating the confusion matrix. Model evaluation is done by monitoring the number of True Positive (TP), True Negative (TN), False Positive (FP), and False Negative (FN). From these data, accuracy, precision, recall and f1-score can be calculated from the resulting model [11]. From these values accuracy, precision, recall, and f1-score can be calculated as expressed by Eqns. (1), (2), (3) and (4) below [16].
accuracy $=\frac{(T P+T N)}{(T P+T N+F N+F P)}$ (2)
precision $=\frac{(T P)}{(T P+F P)}$ (3)
recall $=\frac{(T P)}{(T P+F N)}$ (4)
F1 Score $=2 \times \frac{(\text { Recall } \times \text { Presisi })}{(\text { Recall }+\text { Presisi })} \times 100$ (5)
2.6 Testing scenario
Several test scenarios are implemented with the aim of getting the best classification performance, the test scenarios are as follows:
3.1 Classification results with VGG-16 architecture
At this stage, the effects of the epoch and batch size parameters have been simulated to obtain the highest accuracy. The test results of the 4 scenarios are presented in Figures 6, 7, 8 and 9.
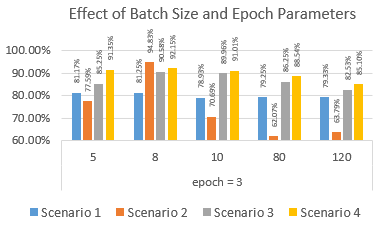
From the test results shown in Figure 6 with epoch 3, the highest accuracy rate is 94.17% in batch size 10 in scenario 4.
Figure 6. Accuracy of VGG-16 architecture with 3 epochs in each scenario
From the test results in Figure 7 with epoch obtained the highest accuracy of 95.76% with batch size 10 in scenario 4.
Figure 7. Accuracy of VGG-16 architecture with 5 epochs in each scenario
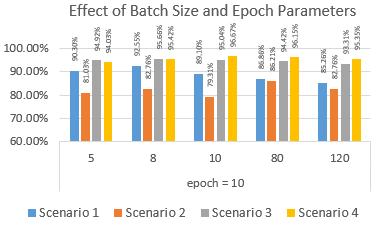
From the test results shown in Figure 8 with 10 epochs, the highest accuracy rate is 96.67% in batch size 10 in scenario 4.
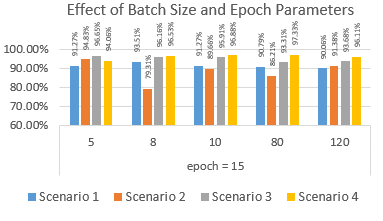
From the results as shown in Figure 9 with 15 epochs, the highest accuracy is 97.33% in batch size 80 in scenario 4. Based on Figure 10, the overall representation of the test results obtained the highest level of accuracy in classifying is 97.33%. This value is obtained in scenario 4, with 15 epochs, and a batch size of 80.
Figure 8. Accuracy of VGG-16 architecture with 10 epochs in each scenario
Figure 9. Accuracy of VGG-16 architecture with 5 epochs in each scenario
Figure 10. The highest accuracy value VGG-16
3.2 Classification results with VGG-19 architecture
In this test, the effects of the epoch and batch size parameters on the VGG-19 architecture have also been simulated. The test results for the four scenarios are presented in Figures 11, 12, 13, and 14.
Figure 11. Accuracy of VGG-19 architecture with 3 epochs in each scenario
From the test results in Figure 11 with epoch 3, the highest accuracy is 94.83% in batch size 8 in scenario 2.
Figure 12. Accuracy of VGG-19 architecture with 5 epochs in each scenario
From the test results in Figure 12 with epoch 5 obtained the highest accuracy of 93.40% in batch size 5 in scenario 4.
Figure 13. Accuracy of VGG-19 architecture with 10 epochs in each scenario
From the test results in Figure 13 with epoch 10 obtained the highest accuracy of 95.21% in batch size 80 in scenario 4.
From the test results in Figure 14 with epoch 15 obtained the highest accuracy of 98.28% in batch size 80 in scenario 2.
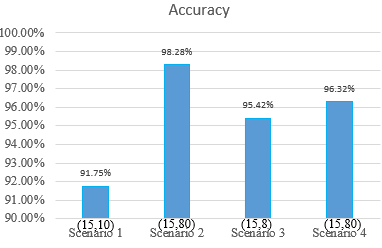
Based on the summary presented in Table 1, from the overall test results obtained the highest accuracy on the VGG-19 architecture is 98.28%. The best performance is achieved in scenario 2, with epoch 15, and batch size 80 as shown in Figure 15.
Figure 14. Accuracy of VGG-19 architecture with 15 epochs in each scenario
Table 1. The highest accuracy results from each scenario (VGG-19)
|
|
Accuracy |
Epoch |
Batch Size |
|
Scenario 1 |
91.75% |
15 |
10 |
|
Scenario 2 |
98.28% |
15 |
80 |
|
Scenario 3 |
95.42% |
15 |
8 |
|
Scenario 4 |
96.32% |
15 |
80 |
Figure 15. The highest accuracy value VGG-19
3.3 Testing with the best parameters
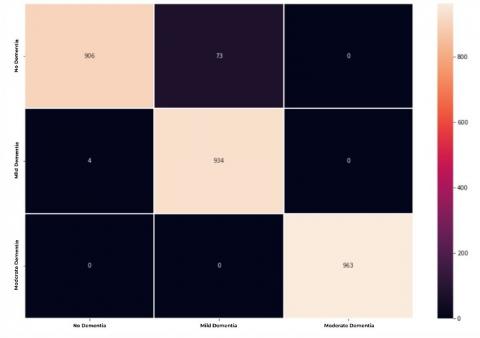
The best performance on the VGG-16 architecture is obtained in scenario 4 using epoch 15 and batch size 80. With these parameters, the system produces 97% precision, 97% recall, 97% f1-score, and 97% accuracy. Figure 16 presents a confusion matrix of the best performance achieved using VGG-16.
Based on Figure 16, it is known that as many as 2803 of the 2880 images are classified correctly. The total number of misclassifications was 77 in mild AD and normal with a total of 4 and 73, respectively.
Meanwhile, the VGG-19 architecture has the best performance in scenario 2 using epoch 15 and batch size 80. With these parameters, 98% precision, 98% recall, 98% f1-score, and 98% accuracy are obtained. Figure 17 presents a confusion matrix of the best performance achieved using VGG-16.
Figure 16. Confusion matrix of the best performing VGG16 architecture
Figure 17. Confusion matrix of the best performing VGG19 architecture
Based on Figure 17, it is known that there are 57 of the 58 images classified correctly. The total number of misclassifications is 1 image for the normal class.
3.4 Performance comparison between VGG-16 and VGG-19
The system performance from the test results using the VGG-16 and VGG-19 architectures gets close to 100%. These results indicate that the system proposed in this study can classify AD with an accrual of about 98%. The comparison of the test results can be seen in Table 2.
Based on Table 2, there are several issues as follows:
Table 2. Comparison of VGG-16 and VGG-19
|
No |
Class of AD |
Precision |
Recall |
F1-Score |
Accuracy |
||||
|
VGG16 |
VGG19 |
VGG16 |
VGG19 |
VGG16 |
VGG19 |
VGG16 |
VGG19 |
||
|
1 |
No Dementia |
100% |
100% |
93% |
94% |
96% |
97% |
97% |
98% |
|
2 |
Mild Dementia |
93% |
95% |
100% |
100% |
96% |
98% |
||
|
3 |
Moderate Dementia |
100% |
100% |
100% |
100% |
100% |
100% |
||
3.5 Comparison with previous study
Table 3 shows a comparison of the model's performance with similar datasets or medical datasets. There are several studies using VGG-16 modeling with an Alzheimer's MRI dataset consisting of 4 classes and a dataset of 10,432 getting an accuracy of 97.00% [6]. Another study using the Alexnet architecture with an Alzheimer's MRI dataset consisting of 4 classes and a dataset of 664 obtained an accuracy of 95.00% [7]. Subsequent research using MobileNet and VGG-16 modeling with an Alzheimer's MRI dataset consisting of 2 classes and a dataset of 6,400 obtained an accuracy of 94.00% and 92.00% [8]. Subsequent research using Resnet-18 modeling with an Alzheimer's MRI dataset consisting of 3 classes and a dataset of 10,794 obtained an accuracy of 88.30% [9]. Subsequent research using Resnet-18 and Densenet-21 modeling with an Alzheimer's MRI dataset consisting of 5 classes and a dataset of 7,509 obtained an accuracy of 98.98% and 98.21% [17]. Subsequent research using Resnet-v2 modeling with an Alzheimer's MRI dataset consisting of 4 classes and a dataset of 6,400 obtained an accuracy of 79.12% [18]. The proposed method outperformed several previous studies, especially in the case of class 2 and 3 classification. Comparing with other studies to find out the highest accuracy value of each different architecture.
Table 3. Comparison of previous study
|
Study |
Model |
Number |
Number |
Accuracy |
|
of Class |
of Images |
|||
|
[6] |
VGG-16 |
4 |
10.432 |
97.00% |
|
[7] |
Alexnet |
4 |
664 |
95.00% |
|
[8] |
MobileNet |
2 |
6.400 |
94.00% |
|
VGG1-6 |
92.00% |
|||
|
[9] |
Resnet-18 |
3 |
10.794 |
88.30% |
|
[17] |
Resnet-18 |
5 |
7.509 |
98.98% |
|
Densenet-21 |
98.21% |
|||
|
[18] |
Resnet-v2 |
4 |
6.400 |
79.12% |
|
Proposed |
VGG-16 |
3 |
4.160 |
97.33% |
|
VGG-19 |
98.28% |
In this study, a system for classifying AD has been designed using the Convolutional Neural Network (CNN) method using 2 architectures, namely VGG-16 and VGG-19. In the classification of dementia, Alzheimer's disease has 3 classes, namely no dementia, mild dementia, and moderate dementia. The image used is an MRI image of Alzheimer's Dementia disease. In this test using 4 scenarios for the difference is the number of datasets from each different scenario. Of the four scenarios, the test data used is 30% of the total image data and the remaining 80% is for training data. This test uses optimization, namely Adam's Optimizer. Testing in this final project uses adding several parameters such as a learning rate of 0.001 with 600 decay steps, 0.7 decay rate. This test also uses different epochs and batch sizes from each architecture used to get the highest accuracy results. In the VGG-16 architecture, the highest accuracy results are in scenario 4 using epoch 15 and batch size 80 with an accuracy value of 97.33%. As for the VGG-19 architecture, the highest accuracy results are in scenario 2 using epoch 15 and batch size 80 with an accuracy value of 98.28%. the two architectures can be compared, namely the VGG-19 architecture is better than the VGG-16 architecture because the process is different. The difference is regarding the number of layers used for VGG-16 there are 13 layers and VGG-19 there are 19 layers, the more the number of layers the better for the accuracy level of the classification.
[1] Deture, M.A., Dickson, D.W. (2019). The neuropathological diagnosis of Alzheimer’s disease. Mol. Neurodegener, 14(1): 1-18. https://doi.org/10.1186/s13024-019-0333-5
[2] Owens D.K. (2020). Screening for cognitive impairment in older adults: US preventive services task force recommendation statement. JAMA - J. Am. Med. Assoc., 323(8): 757-763. https://doi.org/10.1001/jama.2020.0435
[3] Ong, P.A., Annisafitrie, F.R., Purnamasari, N., Calista, C., Sagita, N., Sofiatin, T., Dikot, Y. (2021). Dementia prevalence, comorbidities, and lifestyle among jatinangor elders. Front. Neurol., 12: 643480. https://doi.org/10.3389/fneur.2021.643480
[4] Xiao, Z., Ding, Y., Lan, T., Zhang, C., Luo, C., Qin, Z. (2017). Brain MR image classification for Alzheimer’s disease diagnosis based on multifeature fusion. Comput. Math. Methods Med., 2017. https://doi.org/10.1155/2017/1952373
[5] Kavitha, C., Mani, V., Srividhya, S.R., Khalaf, O.I., Tavera Romero, C.A. (2022). Early-stage Alzheimer’s disease prediction using machine learning models. Front. Public Heal., 10: 1-13. https://doi.org/10.3389/fpubh.2022.853294.
[6] Samhan, L.F., Alfarra, A.H., Abu-Naser, S.S., Amassi, I.A. (2022). Classification of Alzheimer’s disease using convolutional neural networks. Int. J. Acad. Inf. Syst. Res., 6(3): 18-23.
[7] Fu’Adah, Y.N., Wijayanto, I., Pratiwi, N.K.C., Taliningsih, F.F., Rizal, S., Pramudito, M.A. (2021). Automated classification of Alzheimer’s disease based on MRI Image processing using Convolutional Neural Network (CNN) with AlexNet architecture. In Journal of Physics: Conference Series, 1844(1). https://doi.org/10.1088/1742-6596/1844/1/012020
[8] Lu, X., Wu, H., Zeng, Y. (2019). Classification of Alzheimer’s disease in MobileNet. J. Phys. Conf. Ser., 1345(4). https://doi.org/10.1088/1742-6596/1345/4/042012
[9] Oktavian, M.W., Yudistira, N., Ridok, A. (2022). Classification of Alzheimer’s Disease using the Convolutional Neural Network (CNN) with transfer learning and weighted loss. https://doi.org/10.48550/arXiv.2207.01584
[10] Tobias, L., Ducournau, A., Rousseau, F., Mercier, G., Fablet, R. (2016). Convolutional Neural Networks for object recognition on mobile devices: A case study. Proc. - Int. Conf. Pattern Recognit., pp. 3530-3535. https://doi.org/10.1109/ICPR.2016.7900181
[11] Dubey, S. (2020). Alzheimer’s Dataset ( 4 class of Images). https://www.kaggle.com/datasets/tourist55/alzheimers-dataset-4-class-of-images, accessed on Nov. 1, 2021.
[12] Patil A., Rane, M. (2021). Convolutional Neural Networks: An overview and its applications in pattern recognition. Smart Innov. Syst. Technol., 195: 21-30. https://doi.org/10.1007/978-981-15-7078-0_3
[13] Fu’adah, Y.N., Pratiwi, N.C., Pramudito, M.A., Ibrahim, N. (2020). Convolutional Neural Network (CNN) for automatic skin cancer classification system. IOP Conf. Ser. Mater. Sci. Eng., 982(1). https://doi.org/10.1088/1757-899X/982/1/012005
[14] Hindarto D., Santoso, H. (2021). Plat nomor kendaraan dengan metode Convolutional Neural Network. J. Inov. Inform. Univ. Pradita, No. September 2021, pp. 1-12. https://doi.org/10.51170/jii.v6i2.202
[15] Guna, P.W.T., Putri, L.A.A.A.R. (2020). Endek classification based on GLCM using Artificial Neural Networks with Adam Optimization. JELIKU (Jurnal Elektron. Ilmu Komput. Udayana), 9(2): 285. https://doi.org/10.24843/jlk.2020.v09.i02.p16
[16] Saito, T., Rehmsmeier, M. (2015). The precision-recall plot is more informative than the ROC plot when evaluating binary classifiers on imbalanced datasets. PLoS One, 10(3): 1-21. https://doi.org/10.1371/journal.pone.0118432
[17] Odusami, M., Maskeliūnas, R., Damaševičius, R. (2022). An intelligent system for early recognition of Alzheimer’s Disease using neuroimaging. Sensors, 22(3). https://doi.org/10.3390/s22030740
[18] Suganthe, R.C., Geetha, M., Sreekanth, G.R., Gowtham, K., Deepakkumar, S., Elango, R. (2021). Multiclass classification of Alzheimer’s Disease using Hybrid Deep Convolutional Neural Network. NVEO-Natural Volatiles Essent. OILS Journal, 8(5): 145-153.