Raji Nirmala Rajamoni* | Retnaswamy MathuSoothana Satheesh Kumar | Biji Christopher Leela
© 2022 IIETA. This article is published by IIETA and is licensed under the CC BY 4.0 license (http://creativecommons.org/licenses/by/4.0/).
OPEN ACCESS
Around 5 million people in India are with hearing impairment. The higher education opportunities for students with hearing impairment are very limited. Only six institutes in the country provide undergraduate degrees to students with hearing impairment, according to accessible records. Academic achievement in the past, student background characteristics, and eLearning elements are all aspects that influence a student's academic performance. Hearing impairment-related characteristics may also need to be considered for a student with hearing impairment. Identification of these elements may aid teachers in developing individualized teaching plans for students. This paper tries to find the features that affect the performance of students with hearing impairment. The features included are socioeconomic, previous academic scores, and deafness-related factors. The dataset includes data of 224 undergraduate students who have hearing impairment. The preadmission data is used to analyze the performance of students with hearing impairment. The students are classified into different levels – low, medium, and high according to their performance. Different machine learning models are used to classify the students – Logistic Regression, Decision Tree, Support Vector Machine, KNN, Random Forest, and Naïve Bayes. The Random Forest model performed better compared to other models.
classification, hearing impairment, machine learning, student performance
According to World Health Organization’s (WHO) World Report on Disability 2011, people with disabilities make up around 15% of the global population. As per WHO, hearing loss will affect over 900 million people by 2050, up from 450 million today, or 5% of the world's population. The Rights of Persons With Disability Act (RPWD Act) 2016, defines Hearing impairment as “(a) persons with 70 DB hearing loss in both ears within speech frequencies is considered as ‘deaf’ (b) the person with 60 DB to 70 DB hearing loss in both ears within speech frequencies is referred to as ‘hard of hearing’ and ‘speech and language disability is considered as permanent disability due to conditions like laryngectomy or aphasia which affects any of the components of speech and language due to organic or neurological causes”. As per RPWD Act, it is the responsibility of the Government and the local authorities to ensure equal participation of persons with disabilities equally with others [1]. Because education is so important to one's quality of life, it's important to research the elements that influence this population's education. This may help the government and other stakeholders of education to formulate policies that ensure equal opportunities for all irrespective of disability [1].
According to the 2011 Disability Census, India has roughly 5 million persons with hearing loss. Hearing loss is the country's second most common disability, accounting for 18.9% of all disabled people. There is no considerable data on the literacy abilities of the deaf in India, but informal observations suggest that students with hearing impairments may have to wait several years to achieve a respectable level of reading and education and that this level is not always achieved [2]. Currently, as per available data, only very few institutes offer undergraduate programs for students with hearing impairment [2]. Students with hearing impairment have struggled academically owing to a variety of causes. Low academic performance has resulted in poor employability, low income, and substandard quality of life in India, hence research into this performance and the causes associated is urgently needed [2]. Many studies in the field of deaf education were undertaken in the late 1980s and early 1990s, and society's attitude toward this sector improved [3]. Students with hearing impairments performed poorly in comparison to their hearing peers, despite numerous advancements. Students with hearing impairments lacked the necessary information and abilities to maximize their potential [4]. There were no suitable pedagogies that can be used by teachers in the classroom with students with special needs [5].
In India, schools and colleges follow general conventional teaching methodologies to teach students with deafness. The lack of expertise in pedagogy adds to the barriers faced by students with deafness receiving effective educational services [6]. Prior academic achievements, student background attributes, and eLearning attributes are considered as the factors that affect the academics of a student [5]. For a student with hearing impairment, the attributes related to hearing impairment may also need to be considered. The identification of these characteristics that influence students with hearing impairments' academic performance may aid educational stakeholders in developing tailored and individualized teaching plans for them, as well as policies that will enable them to pursue higher education possibilities. Additional accommodations are required for including students with hearing impairment in mainstream schools. The identification of characteristics that influence students with hearing impairments' academic progress may aid in the identification of such adjustments.
The analysis of factors that affect the academic performance of students with hearing impairment can significantly improve their quality of life, with technological advancements and machine learning. This can help the authorities to provide equal opportunities to all without any barriers.
Technology advancements can help to improve people's quality of life both directly and indirectly. Students with hearing impairments can benefit from machine learning algorithms to improve their academic performance. The academic success of students with hearing impairment is influenced by parental expectations and learning support [7]. The academic achievement of students with hearing impairment is also affected by the curriculum, learning resources, and pedagogies used. The need for improved policies, accessibility facilities, and faculty practices is explored in [8]. There have been studies that compare the academic performance of hearing students and hearing impaired pupils in an inclusive setting. It highlights the significance of faculty members using specific approaches and pedagogies to improve the performance of students with hearing impairment [9]. For students with hearing impairment, academic achievement is also affected by their mode of communication, whether it is sign language or speech [10]. Students with hearing impairment lag behind in school than their hearing peers, owing to a communication barrier that eventually leads to poor language abilities [11]. In a significant study [12], Marschark et al. predict the academic performance of students with hearing impairment from personal, household, communication, and academic factors. In [13] a prediction model is suggested to predict the class 10 marks of students with hearing impairment. Seven features were used by the model which included age, school, guardian, study time, parent support, marks in grade1, and extracurricular activities. In another attempt to predict the academic performance of students with hearing impairment student grades, demographics, geographical region, school, course type, and course score are found to have a high correlation for predicting academic outcomes [14]. It is observed that the studies using machine learning techniques in the area of deaf education are very limited. The opportunities in this area of research are numerous which will contribute significantly to improve the higher education of students with hearing impairment. There are many hopeful developments in the field of deaf education research, however studies reveal that the cognitive differences between students with and without hearing necessitate the use of particular teaching approaches and instructional materials [5].
The non-availability of an open dataset that comprises the details of students with hearing impairment leads to the development of a dataset. The dataset is developed by collecting data from the National Institute of Speech and Hearing, Kerala, India. This is one of the prominent institutions in the country that offer specially designed undergraduate programs for deaf and hard-of-hearing students. The data of 224 students are collected. The limited higher education opportunity for students with hearing impairment justifies the small size of the dataset. The previous research identified previous study achievement as one of the predictors of student achievement [15]. There is literature that observes that socioeconomic features can affect the performance of students [12]. The major challenge faced by students with hearing impairment is in communication and language skills. The related features are identified that include communication mode, speech therapy received, type of schooling, degree, type, and percentage of hearing loss. Under each of the three broad classifications- Socioeconomic features, prior academic features, and deafness-related features independent features are identified.
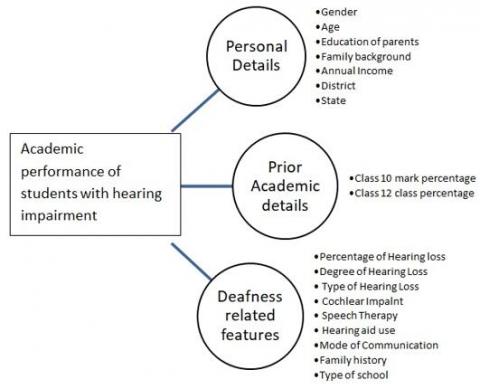
Based on the characteristics, the features are divided into 3 categories – (a) background details which include independent features like age, gender, family background, education of parents, annual income, state, and district (b) prior academic details like independent features - marks scored for class 10 and class 12, semester 1 marks for undergraduate course (c) deafness related independent features like percentage of hearing loss, type and degree of hearing loss, family history, mode of communication, Type of school, speech training, Cochlear Implant, Hearing aid use. Figure 1 illustrates the key characteristics identified which are linked to students with hearing impairments' academic achievement.
Figure 1. Factors related to the academic performance of students with hearing impairment
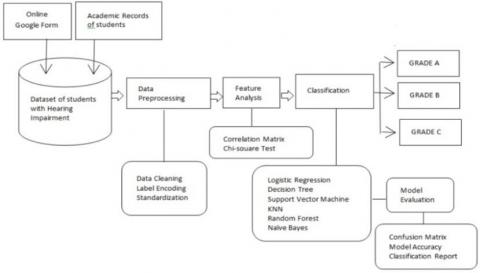
The data was collected through Google form and from the academic records of students from the institution. The workflow is represented in Figure 2. The data preprocessing was done by cleaning the data and checking the missing values. The preprocessing of data is very crucial in data analytics. Several methods deal with missing data. Some of them are ignoring the tuple, filling the missing value manually, use a global constant or attribute mean or most probable value for the missing values [16]. Considering the limited opportunity for students with hearing impairment, the dataset size is small. It is found that almost all the columns did not have missing values. Only two columns, Percentage_class10 and Percentage_class12 have 5 and 6 missing values respectively. As the dataset size is small, ignoring the tuple is not considered; instead, they were imputed by the mean of the column values. The dataset included categorical and continuous values.21 features were identified which include socio-economical, academic, and deafness-related features. Centering and scaling are performed independently on each feature by computing the relevant statistics on the training set samples. The mean and standard deviation are then saved for later use with transformation on other data. Many machine learning estimators require dataset standardization: they may behave poorly if the individual features do not resemble standard normally distributed data.
Figure 2. Workflow diagram
The StandardScalar() function in Sklearn library is used for standardizing the numerical features. The standard score of a sample x is calculated as:
z=(x-u)/s (1)
where, u is the mean of the training samples, and s is the standard deviation of the training samples. It is observed that there is no change in distribution after normalization. The students were grouped into three based on their first semester marks as A, B, C -High, Middle, and low-level respectively. The Label encoding was done to convert categorical values to numerical values. The distributions of variables in different groups were found and the exploratory data analysis was done with graphical representations to obtain valuable insights into the data. The numerical features were standardized and the correlation of these features with the grade was found using correlation. The correlation matrix is plotted between the continuous attributes and the semester one marks... The chi-square test is a test for independence that compares two categorical values in the contingency table to see whether they are related. The formula of chi-square statistic used in the chi-square test is:
$\chi_c^2=\sum \frac{\left(O_i-E_I\right)^2}{\mathrm{Ei}}$ (2)
where, c is the degree of freedom, Oi is the observed value and Ei is the expected value.
Statistical significance is often referred to as probability value or p-value. A small p-value means that your data are unlikely under some null hypothesis. A somewhat arbitrary convention is to reject the null hypothesis if p<0.05. In this study, the chi-square test is used to test which categorical features are related to Grade. The null hypothesis –H0, is taken as the variables are independent of Grade. To conclude the hypothesis with 95% confidence, the p-value should be less than 0.05, which is the alpha level associated with 95% confidence level. The p-value less than 0.05 represent the relation between the grade and the selected categorical variable, that is, the null hypothesis is rejected.
The dataset is modeled with six classification algorithms- Logistic Regression, Decision Tree, Support Vector Machine, KNN, Random Forest, and Naïve Bayes. The performance of models is compared and it was found that the performance of Random Forest is better than the others. The model is evaluated using classification report and values -accuracy, F1-Score, precision, and recall. The k-fold cross-validation technique is used to improve the performance of models.
4.1 Socioeconomic details and grade
The various socio-economic and background attributes and the possible values are tabulated in Table 1. The attributes are chosen to check whether the family background or geographical attribute has any relation to the academic performance of the student.
Table 1. Socioeconomic and background features
|
Sl No |
Attribute |
Possible Values |
|
1 |
Gender |
{Male, Female} |
|
2 |
Annual Income |
{Below 5000, 50000-1 lakh,1 -5 Lakh-5 Lakh – 10 lakh, Above 10 Lakh} |
|
3 |
Education of father |
{No Formal Education, Below High School, Plus Two, Under Graduation, Post-Graduation, Ph.D.} |
|
4 |
Education of mother |
{No Formal Education, Below High School, Plus Two, Under Graduation, Post-Graduation, Ph.D.} |
|
5 |
District |
{All districts of Kerala, District outside Kerala, Outside India} |
|
6 |
State |
{All states of India, Outside India, Union Territory} |
All the features in this category are categorical variables. The chi-square test is performed to find the relation between these variables and Grade. The p-values obtained when the chi-square test was performed are shown in Table 2.
From the calculated p values, it is found that gender and district are dependent on the feature Grade. It is also observed that Grade is independent of features like annual income and education of parents.
Table 2. Calculated p-value for socioeconomic attributes
|
Attribute |
Calculated p-value |
|
Gender |
6.700e-05 |
|
Annual Income |
0.974 |
|
Education of father |
0.404 |
|
Education of mother |
0.999 |
|
District |
2.221e-11 |
4.2 Prior academic performance and grade
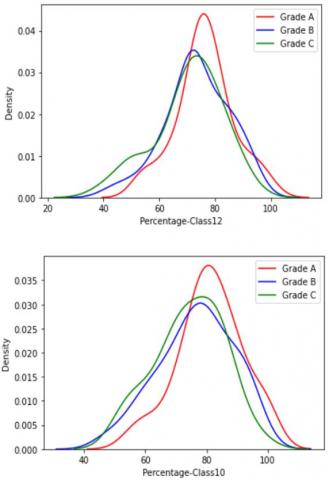
The features of prior academic scores are that of class 10 and classs12. They are continuous variables distributed as shown in Figure 3.
Figure 3. Mark percentage distribution - Class10 and Class12
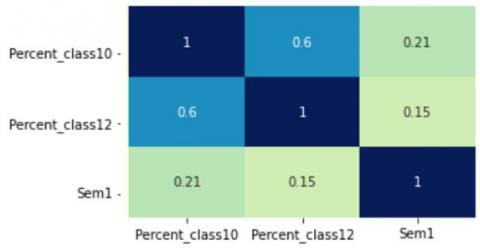
Figure 4. Correlation matrix
The statistical data of these numerical features are shown in Table 3.
The correlation coefficient indicates how strong there exists a relation between data or two columns. The correlation formulas return a value between -1 and 1.1 shows that there is a strong positive relationship between the columns, -1 show that there is a strong negative relation between the columns and 0 shows that there is no relation between the columns. In this paper, the Pearson correlation coefficient formula is used to find the correlation of class 10 percentage and class 12 percentage with semester1 marks. The Pearson correlation coefficient, r, formula to find the correlation between two columns x and y is:
$r=\frac{\mathrm{n}\left(\sum x y\right)-\left(\sum x\right)\left(\sum y\right)}{\sqrt{\left[\mathrm{n} \sum x^2-\left(\sum x\right)^2\right]\left[\mathrm{n} \sum y^2-\left(\sum y\right)^2\right]}}$ (3)
where, n is the number of values in x and y.
corr() available in Python’s Pandas library is used to find the pairwise correlation of the numerical columns in the data frame. The Pearson standard correlation coefficient is used. Using heatmap() in Python seaborn library, the heatmap of the correlation matrix is drawn. The correlation matrix of these features with the semester1 marks is shown in Figure 4.
The correlation matrix values show that the percentage of class 10 and class 12 correlates with the grade.
4.3 Deafness-related features and grade
The deafness-related features include Degree, type, and percentage of Hearing loss(HL), Type of school, undergone cochlear implant, usage of Hearing aid, speech therapy received before or after the age of 5, family history, and communication mode. The categorical deafness-related features and their possible values are tabulated in Table 4.
The percentage of HL is a continuous value. The correlation of this feature with the grade is found to be negative. The p-value obtained for the remaining features in the chi-square test is tabulated in Table 5.
The chi-square test results show that the features, communication mode, speech therapy after the age of 5, usage of hearing aid, type of schooling, and degree of hearing loss are the dependent features.
From the above-discussed results, it is seen that the dependent features in the academic performance of a student with hearing impairment are gender, district, state, percentage of marks in class 10 and class 12, communication mode, speech therapy after the age of 5, usage of hearing aid, type of schooling and degree of hearing loss. The communication mode is a very significant feature as hearing impairment directly affects the communication of the student. Students with hearing impairment mainly depend on three modes of communication – speech, sign language, and sign language and speech together. It can be observed that the type of school, regular or special, is also a dependent feature. The accommodations provided for students with hearing impairment need to be analyzed and studied. Also, the need for more intervention centers is evident from the fact that speech therapy is a dependent variable.
The number of students belonging to each category with the features identified is summarized in Table 6. It is observed while considering the middle-level performing students that the Sign language users and those who use both sign and speech are almost similar in number. The number of students who received speech therapy after the age of 5 is much greater than that who have not received speech therapy. This indicates the importance of audiological interventions. The usage of hearing aid is observed as not so significant with the performance. The majority of students fall in severe or profound degree of hearing loss. Considering the type of schooling, it is seen that the majority of students did their schooling in special schools. This calls for the new policies that will improve the pedagogies and specialized instructional materials in special schools. The new modes of education like sign bilingualism need to be considered. Sign bilingualism is founded on the idea that deaf children can readily learn sign language and should be allowed to do so because they may have difficulty accessing spoken language.
Table 3. Statistics of prior academic data
|
Feature |
Count |
Mean |
Std |
Min |
25% |
50% |
75% |
Max |
|
Percent-Class10 |
215 |
77.57 |
11.9 |
45 |
70.0 |
79.0 |
86.0 |
100 |
|
Percent-Class12 |
215 |
73.94 |
11.5 |
40 |
68.2 |
74.0 |
81.0 |
100 |
Table 4. Deafness related features
|
Slno |
Attribute |
Possible values |
|
1 |
Degree of HL |
{Mild, Moderate, Moderately Severe, Severe, Profound} |
|
2 |
Type of HL |
{Conductive, Sensorineural, Mixed} |
|
3 |
Family History |
{Yes, No} |
|
4 |
Cochlear Implant |
{Yes, No} |
|
5 |
Hearing Aid Use |
{Yes, No} |
|
6 |
Type of School –Class 10 |
{Special school, Regular School} |
|
7 |
Type of School –Class 12 |
{Special school, Regular School} |
|
8 |
Communication Mode |
{Sign language, Speech, Both Sign and Speech} |
|
9 |
Speech Therapy- before age 5 |
{Yes, No} |
|
10 |
Speech Therapy- after age 5 |
{Yes, No} |
Table 5. Calculated p-value for deafness-related attributes
|
Attribute |
Calculated p-value |
|
Degree of HL |
0.011 |
|
Type of HL |
0.628 |
|
Family History |
0.154 |
|
Cochlear Implant |
0.174 |
|
Hearing Aid Use |
0.001 |
|
Type of School –Class 10 |
5.343e-08 |
|
Type of School –Class 12 |
0.001 |
|
Communication Mode |
0.004 |
|
Speech Therapy- before age 5 |
0.183 |
|
Speech Therapy- after age 5 |
1.945e-09 |
Table 6. Identified attributes and student categories
|
ATTRIBUTE |
A |
B |
C |
|
Gender |
|
|
|
|
Male |
40 |
67 |
21 |
|
Female |
21 |
59 |
7 |
|
Communication Mode |
|
|
|
|
Sign Language |
18 |
61 |
23 |
|
Speech |
2 |
1 |
0 |
|
Sign and Speech |
41 |
64 |
5 |
|
Speech Therapy – after age 5 |
|
|
|
|
Yes |
39 |
70 |
9 |
|
No |
22 |
56 |
19 |
|
Hearing Aid Use |
|
|
|
|
Yes |
27 |
35 |
9 |
|
No |
34 |
91 |
19 |
|
Degree of HL |
|
|
|
|
Mild |
2 |
9 |
0 |
|
Moderate |
4 |
4 |
3 |
|
Moderately Severe |
7 |
7 |
4 |
|
Severe |
24 |
63 |
12 |
|
Profound |
24 |
43 |
9 |
|
Type of School-Class 10 |
|
|
|
|
Regular School |
20 |
27 |
3 |
|
Special School |
41 |
100 |
25 |
|
Type of School –Class 12 |
|
|
|
|
Regular School |
19 |
29 |
4 |
|
Special School |
42 |
97 |
24 |
Table 7. Model accuracy comparison
|
Model |
Accuracy |
|
Logistic Regression Model |
0.565 |
|
Decision Tree Model |
0.593 |
|
Support Vector Machine |
0.733 |
|
KNN Model |
0.645 |
|
Naive Bayes Model |
0.601 |
|
Random Forest Model |
0.811 |
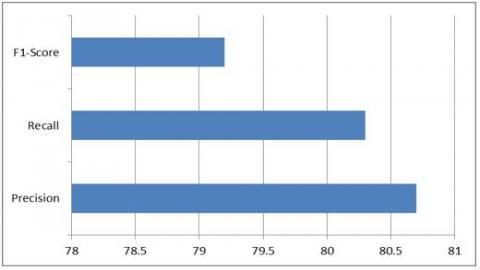
Figure 5. Model evaluation
The data is modeled using six different classification algorithms – Linear regression, Decision tree, Naïve Bayes, KNN, Support Vector Machine, and Random Forest. For the classification, 10 significant features are selected. These include gender, gender, district, state, percentage of marks in class 10 and class 12, communication mode, speech therapy after the age of 5, usage of hearing aid, type of schooling, and degree of hearing loss.
The performance of different models in terms of accuracy is tabulated in Table 7. The performance of various models is compared and it is observed that Random Forest model is better in terms of accuracy compared to others. The 10-fold cross validation is used to achieve this accuracy. The dataset is split into 10 non overlapping folds through the 10-fold cross validation process. Each fold is held again as test set whilst all different folds are used a train dataset. In a 10-fold cross-validation process, 10 models are fit and evaluated on 10 test sets and the mean overall performance is considered. Repeated k-fold cross-validation allows to enhance the predicted overall performance of a machine learning model. In this process the cross validation procedures are repeated and mean value from all folds from of all runs is taken. This mean result, calculated using the standard error, is thought to be a more accurate illustration of the real unknown underlying mean overall performance of the model on the dataset. An accuracy of 81% is obtained with Random forest model after the 10 fold cross-validation method.
The model is evaluated using classification reports and accuracy. The F1 Score, Recall, and Precision of Random Forest model is graphically represented in Figure 5. The hyperparameters used to tune the model are n_estimators - 1000, random state - 62, and criterion ‘gini’.
In this study, it is observed that the factors related to deafness also need to be considered in the case of students with hearing impairment. For a hearing student, the prior academic results along with background features have a strong relationship with the grade he obtained in the first semester [17]. In the case of a student with hearing impairment, one of the major barriers he faces throughout his life is the communication barrier. Sign language is considered as his mother tongue and recent studies show that bilingual education that is written language through sign language is very effective in the education of students with hearing impairment. This study emphasizes the importance of communication mode and type of school in the academic performance of students with hearing impairment. The positive impact of speech therapy also calls for policies that can provide more audiological services to the hearing-impaired population. Another significance of this study is an attempt to develop a dataset with variables related to deafness. This is a considerable contribution to further research in this area. Though the limited higher education opportunities for students with hearing impairment justify the smaller size of the dataset, the model accuracy can be further increased by improving the dataset size. The classification of students based on the pre-admission data can help the teachers to make customized teaching plans for each group. The development of a front-end tool for this classification can be considered as one of the future scopes of this study.
[1] John, T. (2020). The rights of persons with disabilities act 2016 and psychiatric care. Kerala Journal of Psychiatry, 33(1): 1-4. https://doi.org/10.30834/kjp.33.1.2020.183
[2] Mandke, K., Chandekar, P. (2019). Deaf education in India. Deaf Education Beyond the Western World: Context, Challenges, and Prospects, 261-84. https://doi.org/10.1093/oso/9780190880514.003.0014
[3] Roald, I. (2002). Norwegian deaf teachers’ reflections on their science education: Implications for instruction. Journal of Deaf Studies and Deaf Education, 7(1): 57-73. https://doi.org/10.1093/deafed/7.1.57
[4] Qi, S., Mitchell, R.E. (2012). Large-scale academic achievement testing of deaf and hard-of-hearing students: Past, present, and future. Journal of Deaf Studies and Deaf Education, 17(1): 1-18. https://doi.org/10.1093/deafed/enr028
[5] Knoors, H., Marschark, M. (2012). Language planning for the 21st century: Revisiting bilingual language policy for deaf children. The Journal of Deaf Studies and Deaf Education, 17(3): 291-305. https://doi.org/10.1093/deafed/ens018
[6] Stassen, M.L.A., Doherty, K., Poe, M. (2001). PROGRAM-Based Review and Assessment. in OAPA Handbook, p. 64.
[7] Agyire-Tettey, E.E.M., Cobbina, M., Hamenoo, E.S. (2017). Academic challenges of students with hearing impairment (SHIs) in Ghana. Disability, CBR & Inclusive Development, 28(3): 127–150. https://doi.org/10.5463/DCID.v29i3.646
[8] Smith, D.H., Andrews, J.F. (2015). Deaf and hard of hearing faculty in higher education: enhancing access, equity, policy, and practice. Disability & Society, 30(10): 1521-1536. https://doi.org/10.1080/09687599.2015.1113160
[9] D.V., E.R., Chandrakala, D. (2021). A comparative study on academic achievement of normal children and hearing-impaired children in inclusive education at primary level. International Conference on Management, Science, Technology, Engineering, Pharmacy and Humanities (ICM STEP) – 2021, 8(1): 89-93. https://ijirt.org/master/publishedpaper/IJIRT151363_PAPER.pdf.
[10] Hrastinski, I., Wilbur, R.B. (2016). Academic achievement of deaf and hard-of-hearing students in an ASL/English bilingual program. Journal of Deaf Studies and Deaf Education, 21(2): 156-170. https://doi.org/10.1093/deafed/env072
[11] Su, J.Y., Guthridge, S., He, V.Y., Howard, D., Leach, A.J. (2020). The impact of hearing impairment on early academic achievement in Aboriginal children living in remote Australia: A data linkage study. BMC Public Health, 20(1): 1-13. https://doi.org/10.1186/s12889-020-09620-6
[12] Marschark, M., Shaver, D.M., Nagle, K.M., Newman, L.A. (2015). Predicting the academic achievement of deaf and hard-of-hearing students from individual, household, communication, and educational factors. Exceptional Children, 81(3): 350-369. https://doi.org/10.1177/0014402914563700
[13] Durga, V.S., Jeyaprakash, T. (2021). Predicting academic performance of deaf students using feed forward neural network and an improved PSO algorithm. Webology, 18(SI01): 112-126. https://doi.org/10.14704/WEB/V18SI01/WEB18048
[14] Alsraisri, N. (2021). Predicting academic performance of deaf and hard of hearing students using predicting academic performance of deaf and hard of hearing students using educational data mining techniques. (Publication No.1442/8346) [Doctoral Diss. King Saud Univ. https://doi.org/10.13140/RG.2.2.21887.94881
[15] Hailikari, T., Nevgi, A., Komulainen, E. (2008). Academic self-beliefs and prior knowledge as predictors of student achievement in Mathematics: A structural model. Educational Psychology, 28(1): 59-71. https://doi.org/10.1080/01443410701413753
[16] Alasadi, S.A., Bhaya, W.S. (2017). Review of data preprocessing techniques in data mining. Journal of Engineering and Applied Sciences, 12(16): 4102-4107. https://doi.org/ 10.3923/jeasci.2017.4102.4107
[17] Verma, S., Yadav, R.K. (2020). Effect of different attributes on the academic performance of engineering students. In 2020 IEEE International Conference on Advent Trends in Multidisciplinary Research and Innovation (ICATMRI), Buldhana, India, pp. 1-4. https://doi.org/10.1109/ICATMRI51801.2020.9398442