Ravi Kumar Palacharla* | Valli Kumari Vatsavayi
© 2022 IIETA. This article is published by IIETA and is licensed under the CC BY 4.0 license (http://creativecommons.org/licenses/by/4.0/).
OPEN ACCESS
The textual information is abundantly increasing in the internet through different types of social media platforms. Knowing the type of information is one challenging task to different information retrieval systems and researchers. Text classification is one research domain used to categorize the textual information into different classes. Most of the researchers proposed approaches based on the content used in the textual documents. Identification of appropriate terms for differentiating the text is one important task in text classification. After identification of terms for experiment, next very important task is determining the importance of a term in document representation. The term weight measures are used for finding the importance of a term in a document. In this work, a new supervised term weight measure named as TF-NRF-IPNDF-PNDDF is proposed. The performance of proposed term weight measure is compared with eight popular term weight measures such as TFIDF, TFIEF, TFRF, TF-IDF-ICSDF, TF-PROB, TF-IGM, CDallc and CDc. The experiment conducted on six standard classification datasets such as IMDB, HSS, FN, 20NG, AGN and CBN. Six different classification algorithms such as KNN, NB, LR, SVM, DT and RF are used for evaluating the performance of the proposed term weight measure. The proposed term weight measure attained best accuracies for different standard datasets compared with other term weight measures.
text classification, term weight measure, machine learning algorithms, accuracy
Every research domain directly or indirectly used the concepts of text classification. Text Classification (TC) or Text Categorization is a task of predicting the class label of an unknown document as well as classifying the documents into different classes. Several approaches are proposed for text classification in research community. The text classification approaches are proposed by using different concepts such as features like terms used in the text, word N-Gams, Character N-Grams, Part of Speech N-Grams, Features selection algorithms, term weight measures, similarity measures, distance measures, machine learning techniques, deep learning techniques etc. In general, the text classification approaches are divided into several steps such as data collection, data pre-processing, feature extraction, dimensionality reduction, document vector representation, machine learning techniques and exploration of results.
In data collection step, the known dataset is collected from different sources. This step is very important because the wrongly labelled data reduce the accuracy of text classification. Next step is applying data pre-processing techniques on collected dataset. This step removes unwanted data based on the type of features extracted from the dataset. The researchers used different types of pre-processing techniques like punctuations removal, tokenization, stop words removal, lemmatization, stemming, removal of URL’s etc. After cleaning the data from dataset, the important step is extracting the features which are useful to differentiate the content in different classes. The problem in feature extraction is huge number of features are extracted from the dataset. This problem is avoided by using dimensionality reduction techniques. In the next step, apply various feature selection techniques like gain ratio, information gain, mutual information, principle component analysis etc., to decrease the irrelevant features. These reduced set of features are used to represent the document vectors. In document vector representation step, the most important issue is how to represent the feature value in the vector representation. Several Term Weight Measures (TWMs) are proposed to determine the suitable weight of terms in the representation. After representing the documents as vectors, the next important step is identification of suitable machine learning algorithm. The machine learning algorithm trained on these vectors and generates a classification model. This model is used to classify the test documents and detect the label of an unknown document.
The document vector is very important in text classification to avoid the over-fitting problems and reduce the time complexity. The type and number of features are used for representing the document vectors are influencing the performance of text classification [1]. The impact of feature values in vector representation also more in improving the accuracy of text classification. In initial times, the term frequency is used to represent the vector value in document vector representation. The researchers observed that the frequency is not a good solution for feature value representation because some of the words are frequently used in the text but they don’t have any distinguishing power to differentiate the classes of documents. Later, the researchers started proposal of different term weight measures to determine the weight of a term in vector representation of document. Term weight measures are majorly divided into two classes such as supervised and unsupervised term weight measures based on class label information of document is used in the weight computation of terms [2]. The supervised term weight measures used the class label information of documents, whereas unsupervised doesn’t used that information. Most of research works observed that the supervised term weight measures performance is good in text classification than unsupervised term weight measures.
In this work, a term weight measure based machine learning approach is proposed for text classification. In this approach, the experiment conducted with different standard term weight measures and proposed a new supervised term weight measure. The proposed term weight measure is prepared by using the distribution information in different classes of documents. It was observed that the proposed term weight performance is good when compared with standard term weight measures performance. Most frequent terms in the dataset are considered as features for vector representation of documents. The experiment carried out with different standard text classification datasets. Various machine learning algorithms are used to evaluate the performance of the proposed approach. Most of the times, the Random Forest classifier shows good performance than other machine learning methods.
This work is planned in 11 sections. Section 2 discuss about different works in text classification that are implemented term weight measures. The descriptions about the datasets used in this work are presented in section 3. The section 4 describes the evaluation measures that are used to represent the performance of the proposed system. The term weight measures based approach for text classification, the necessity of term weight measures and existing term weight measures that are used in this experiment are analysed in section 5. The proposed term weight measure is explained in section 6. The analysis of existing and proposed term weight measures is discussed in section 7. The section 8 presents the experiment results of text classification of proposed approach on different datasets. The results are analysed and discussed in section 9. The conclusions of this work are listed and future improvements of this work are described in section 10.
Text classification is a technique of classifying textual documents into known classes. Several researchers proposed approaches based on machine learning and deep learning techniques. Text classification is a crucial task in Natural Language Processing (NLP) techniques. In general, term weight schemes are used to achieve effective representation for text by assigning suitable weight to every term in text classification process. Generally, the term weight schemes are developed with different types of information of terms such as Term Frequency Factor [TFF], Normalization Factor [NF] and Collection Frequency Factor [CFF]. The NF is used to normalize the length of a document. Long Chen et al., observed [3] that most of the existing term weight schemes concentrated on determining the more efficient collection frequency factor and paid less concentration on developing a novel TFF. They proposed a novel TFF named as Modified Term Frequency (MTF). The MTF factor directly adjusts the raw term frequency by focusing on all training documents length information. Then, they proposed a novel TWM named as MTF-MDFS (MDFS based MTF) by combining the existing CFF such as Modified Distinguishing Feature Selector (MDFS) and MTF. The experimented conducted on 6 popular text datasets and 19 benchmark text datasets with different types of classification algorithms such as LR, SVM and MNB. They observed from results that the proposed MTF-MDFS and MTF achieved best weighted average of F1-score and accuracy when compared with popular competitors in TC.
In TC, the performance of classification is improved by the efficient representation of the relationship among the textual documents and their contents. The text documents are represented in better way by assigning suitable weights to the terms in vector space by using term weight measures. In the literature of text classification, the development of appropriate term weight schemes affects the efficiency of text classification. Turgut Dogan et al. [4] proposed a new term weight scheme named as MONO by using the terms non-occurrence information. Based on the MONO weight scheme, they developed two new supervised term weight schemes such as SRTF-MONO and TF-MONO for text classification. Various classification algorithms like KNN and SVM are used to test the efficiency of proposed schemes. The experiment conducted on datasets such as WebKB, 20-Newsgroups and Reuters-21578. The efficiency of proposed term weight schemes are compared with five different schemes like TF-IGM, TF-RF, TF-IDF, TF-IDF-ICSDF and TF-IDF-ICF. They observed from the results that the SRTF-MONO performance is good on all datasets when compared with other six term weight schemes.
The researchers increased their attention on text classification with the exponential improvement of text in the internet. Vector Space Model (VSM) is one of the popularly used methods for text representation. In VSM, the documents are represented as vectors and term frequency measure is used to compute the term value in vector. The development of a suitable TWM is very important to increase the efficiency of text classification because different importance is assigned to different terms in the document. Chen et al. [5] conducted a broad survey on the famous existing term weight schemes in their study and observed that these measures are not fully influencing the improvement of TC performance. To increase the efficiency of text classification, they developed a new term weight scheme named as TF-MDFS based on Modified Distinguishing Feature selector (MDFS). They observed from the results that the TF-MFDS accuracy was good for text classification when compared with most popular existing term weight schemes.
TC is one of the important problems where the better vector representation of features is provided explicitly to increase the performance of classification. Thus, the assignment of suitable weights to the terms or features is an important task to achieve efficient vector representations of features. The term weight schemes are used to compute the term weight in text classification tasks. The researchers are still concentrated on development of a new term weight schemes because most of the existing term weight schemes are not fully effective in text classification. Dogan and Uysal [6] derived two new term weight schemes such as TF-IGMimp and SQRT_TF-IGMimp from original TF-IGM formula which was proposed based on standard inverse gravity moment to increase the efficiency of text classification. The proposed term weight schemes efficiency is compared with five popular term weight methods and two typical IGM based schemes. They experimented on both balanced datasets of 20 Newsgroups and 20 Mini Newsgroups, unbalanced dataset of Reuters-21578 with different types of classifiers such as NN, SVM and KNN. The Macro-F1 and Micro-F1 are used as evaluation measures. The experiment conducted with several sizes of feature sets to analyse the influence of feature set size in the success of weight schemes. It was observed from the results the proposed SQRT_TF-IGMimp measure achieved good performance than all other schemes like SQRT_TF-IGM and standard TF-IGM schemes. Another proposed measure TF-IGMimp also proved to obtain better efficiency when compared with standard TF-IGM.
In text classification tasks, the representation of text is one of the important topics. The influence of text representation is more to increase the efficiency of the TC. The TFIDF measure is developed especially for information retrieval tasks rather than text classification tasks, but the TFIDF is mostly used in the approaches of text classification as a term weight measure for text representation of contents. Tang et al. [7] developed many alternative unsupervised term weight methods in their study based on the inspiration of IDF in TFIDF measure. The representation of test documents as vectors in suitable way is very important in text classification when compared with information retrieval especially in case of supervised term weight methods where these methods used the class information while assigning weight to the terms. Most of the present weight methods not described clearly the way the test documents are represented. To address this problem, they analysed three STWM and a classical UTWM to explain the procedure of representation of test documents. They developed three sets of experiments to analyse the efficiency of proposed work and compared with existing works. It was observed that the proposed methods increase the efficiency of TC when compared with traditional supervised term weight methods.
In this work, the most well-known and benchmark datasets in the domain of text classification are used for the experimentation. For covering the aspect of classification type, four binary datasets and two categorical datasets are selected. The selected datasets have different numbers of classes (from 2 to 20), and different numbers of instances (from 200 to 120000). They are also from different real-world areas such as sentiment analysis, fake news detection and hate speech spreaders detection. The datasets are selected with an expectation that they are well representatives of real-world problems. Table 1 shows the statistics pertaining to the datasets. The descriptions about the dataset are represented in Table 1.
Table 1. Dataset characteristics
|
S. No. |
Dataset |
Number of Classes |
Number of Instances |
Web Link |
|
1 |
Hate Speech Spreaders (HPS) [8] |
2 |
200 (200 tweets in each instance) |
https://pan.webis.de/clef21/pan21-web/author-profiling.html |
|
2 |
Fake News (FN) [9] |
2 |
25200 |
https://www.kaggle.com/clmentbisaillon/fake-and-real-news-dataset |
|
3 |
IMDB [10] |
2 |
50000 |
https://www.kaggle.com/lakshmi25npathi/imdb-dataset-of-50k-movie-reviews |
|
4 |
20 News Group (20NG) [11] |
20 |
18828 |
http://qwone.com/~jason/20Newsgroups/ |
|
5 |
AG News dataset (AGN) [12] |
4 |
127600 |
https://www.di.unipi.it/~gulli/AG_corpus_of_news_articles.html |
|
6 |
Clikbaits News (CBN) [13] |
2 |
32000 |
https://www.kaggle.com/vikassingh1996/news-clickbait-dataset |
The machine learning algorithms shows the performance of a system by using different evaluation measures such as accuracy, precision, recall and F1-score. In text classification, researchers are used these measures to compare the performance of their approaches with other approaches. To describe these evaluation measures, a confusion matrix is required. Confusion matrix shows how the actual class label of a document is changed after prediction of machine learning algorithm. The Table 2 shows the confusion matrix for determining the evaluation measures.
Table 2. Confusion matrix for evaluation measures
|
|
|
Predicted label |
|
|
Actual Label |
|
Cp |
Cn |
|
Cp |
TP |
FN |
|
|
Cn |
FP |
TN |
|
In Table 2, the TP is count of documents have original and predicted class label as positive class label, FN is count of documents have original class label as positive class and predicted class label as negative class, FP is count of documents have original class label as negative class and predicted class label as positive, TN is count of documents have both original and predicted class label as negative class.
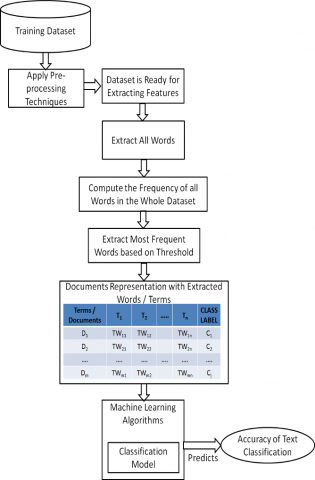
The proposed approach for text classification is displayed in Figure 1. In this approach, the First and foremost important work is collection of standard dataset for the experiment of text classification. Once the dataset is collected, prepare the dataset for extracting suitable features for analysis by applying different type of pre-processing techniques. The pre-processing techniques used in this work are tokenization, removal of punctuation symbols, URL’s removal, stop words elimination, stemming. The stop-words are words like articles, prepositions, determiners, conjunctions etc., which are frequently used by the authors in their text but they don’t have any class distinguishing power. Stemming is a technique of reducing the number of distinct terms by converting the term into its root form [14]. For example, computing, computation, computable words are stemmed into a root form of “comput”. The porter stemmer algorithm [15] is used in this work for stemming. After removing the noisy data from the dataset, now the dataset is ready for extracting the appropriate features for analysis. Extract all the words from the dataset and compute the frequency of each term in the whole dataset. Identify the terms for analysis based on their frequency.
Once the terms are identified for experiment, the next important step is document representation with these identified terms. The documents are represented as vectors because the machine learning algorithms understand vector representation only.
Figure 1. The proposed system
Every approach for text classification in machine learning domain prepared document vectors by using different types of features [16]. The value of a term used to represent the vector value in vector representation shows significant impact on improvement in accuracy of text classification. To determine the value of a term, term weight measure is a concept used by the researchers. Term weight measures compute the weight of a term by using different factors of information related to a term. Researchers proposed different types of term weight measures in various research domains. In this work, a new term weight measure is proposed to determine the weight of a term in a document. After representing the vector values with the weights of terms, now the documents are given as input to machine learning algorithms. The machine learning algorithms prepares classification model internally and predict the accuracy of proposed system for text classification.
In Figure 1, D1, D2, …., Dm are the documents in the dataset, T1, T2, …..,Tn are the terms identified for experiment, C1, C2,……,Cj are the classes in the dataset, TWmn is the weight of term Tn in document Dm.
The TWMs determine the value of a term based on the importance of a term in document. Initial times, binary measure is used. This measure assigns 1 to a term if the term is present in a document and assign 0 if the term absent in a document. The binary measure doesn’t consider the number of times the term is occurred in a document. Later, the term frequency measure is used by the researchers to find the importance of a document. This measure assigns more weight to the terms which are occurred more number of times in a document. Most of the research works faced a problem with this measure because this measure assigns more weight to some of the terms like a, the, an etc. that are used commonly in the text but these terms are not having any distinguishable power in text classification. To overcome the problems with term frequency measure, researchers developed alternative TWMs to calculate the importance of a term in a document. In this work, a new term weight measure is proposed and compared the performance of proposed measure several popular term weight measures.
5.1 TFIDF (Term Frequency and Inverse Document Frequency)
The TFIDF measure assign more weight to the terms are occurred in less number of documents in whole dataset [17]. Eq. (5) is used to determine the weight of a term Ti in a document Dk by using TFIDF measure. Where, TF(Ti, Dk) is number of times term Ti occurred in document Dk, N is number of documents in dataset, DF(Ti) is number of documents contain term Ti in total dataset.
5.2 TFIEF (Term Frequency and Inverse Exponential Frequency)
TFIEF measure also assigns more weight to the terms that are occurred in fewer documents in a dataset [18]. This measure is developed to overcome some of the problems occurred while using TFIDF measure. TFIEF measure is represented in Eq. (1).
$\operatorname{TFIEF}\left(T_{i}, D_{k}\right)=T F\left(T_{i}, D_{k}\right) \times e^{\frac{-D F\left(T_{i}\right)}{N}}$ (1)
where, N is number of documents in dataset, DF (Ti) is number of documents containing term Ti in total dataset.
5.3 TFRF (Term Frequency and Relevance Frequency)
TFRF measure gives more weight to the terms that are occurred in more positive class documents than negative class documents [19]. Eq. (2) is used to compute the TFRF of a term Ti in document Dk.
$\operatorname{TFRF}\left(T_{i}, D_{k}\right)=T F\left(T_{i}, D_{k}\right) \times \log \left(2+\frac{A}{C}\right)$ (2)
where, A is Number of positive class documents contain term Ti, C is Number of negative class documents contain term Ti.
5.4 TF-IDF-ICSDF (Term Frequency – Inverse Document Frequency – Inverse Class Space Density Frequency)
TF-IDF-ICSDF measure allots more weight to the terms that are occurred in less number of documents and that are distributed in less number of classes [20]. TF-IDF-ICSDF measure of a term is computed by using Eq. (3).
$T F-I D F-I C S D F\left(T_{i}, D_{k}\right)=T F\left(T_{i}, D_{K}\right) \times\left(1+\log \left(\frac{N}{D F\left(T_{i}\right)}\right)\right) \times\left(1+\log \left(\frac{m}{\sum_{j=1}^{m}\left(\frac{n_{c j}\left(T_{i}\right)}{N_{c j}}\right)}\right)\right)$ (3)
where, N is number of documents in dataset, DF (Ti) is number of documents contain term Ti in total dataset, m is number of classes in the dataset, ncj(Ti) is number of documents in class jth class contain term Ti, Ncj is number of documents in jth class.
5.5 TF-Prob
TF-Prob measure allocates more weight to the terms that are occurred in more positive class documents and less number of negative class of documents [21]. Eq. (4) represents the TF-Prob measure.
$T F-\operatorname{Prob}\left(T_{i}, D_{k}\right)=T F\left(T_{i}, D_{k}\right) \times \log \left(1+\frac{A}{B} \frac{A}{C}\right)$ (4)
where, A is Number of positive class documents contain term Ti, C is Number of negative class documents contain term Ti, B is Number of positive class documents doesn’t contain term Ti.
5.6 TF-IGM (Term Frequency – Inverse Gravity Moment)
TF-IGM measure considers the ranking information of the classes [22]. The rankings are given to classes based on the number of documents contain the term in each class. When a term is occurred in more number of documents in a class, that class got highest rank when compared with other classes. This measure is mainly proposed for multi class classification. TF-IGM weight of a term is calculated by using Eq. (5).
$T F-\operatorname{IGM}\left(T_{i}, D_{k}\right)=T F\left(T_{i}, D_{k}\right) \times\left(\frac{f_{i 1}}{1+\lambda \times \sum_{j=1}^{m} f_{i j \times j}}\right)$ (5)
where, l is an adjustable coefficient, where l is changed from 5 to 9. In general, the default value for l is 7. fi1 is number of documents in highest ranked class contain term Ti, m is number of classes, fij is number of documents in jth class contain term Ti.
5.7 Term weighting based on class density (CD) relative to all class documents (CDallc)
CDallc measure determines the weight of the term in a class of documents with respect to total number of documents in the dataset [23]. Eq. (6) is used to compute the CDallc measure weight of a term in a class c.
$C D_{\text {allc }}\left(T_{i}\right)=\frac{N_{c}\left(T_{i}\right)}{D\left(T_{i}\right)}$ (6)
The weight of term in all classes is determined by using the Eq. (7).
$\operatorname{TW}_{\text {CDallc }}\left(T_{i}\right)=\arg _{c} \max \left[C D_{\text {allc }}\left(T_{i}\right)\right]$ (7)
where, Nc(Ti) is number of documents of class c contains term Ti, D(Ti) is number of documents in whole dataset contain term Ti.
5.8 Term weighting based on class density (CD) relative to all documents in the same class (CDc)
CDc measure determines the weight of the term in a class of documents with respect to number of documents in that class [23]. Eq. (8) is used to compute the CDc measure weight of a term in a class c.
$C D_{c}\left(T_{i}\right)=\frac{N_{c}\left(T_{i}\right)}{n c}$ (8)
The weight of term in all classes is determined by using the Eq. (9).
$T W_{C D C}\left(T_{i}\right)=\arg _{c} \max \left[C D_{C}\left(T_{i}\right)\right]$ (9)
where, Nc(Ti) is number of documents of class c contains term Ti, nc is number of documents in class c.
The proposed method is a combination of four factors such as TF, NRF, IPNDF and PNDDF. The first factor is term frequency. This factor finds the frequency of a term in a document. Eq. (10) represents the proposed term weight measure.
$T F-N R F-I P N D F-P N D D F\left(T_{i}, D_{k}\right)=$
$T F\left(T_{i}, D_{k}\right) \times \frac{\frac{A}{A+B}}{\frac{C}{C+D}} \times \frac{N}{(A+C)} \times\left|\frac{A-D}{B-C}\right|$ (10)
NRF (Normalized Relative Frequency): A is Number of positive class documents contain term T, C is Number of negative class documents contain term T, A+B is number of documents in positive class, C+D is number of documents in negative class. A>>C indicates the term have good weight in the positive class of documents. The A/C value for a term is more means the term is having more weight in the positive class. In this work, the A and C values are normalized by using the number of documents in that classes. We observed that the term weight is increased after normalizing A and C values. This normalized factor is used in the proposed term weight measure.
IPNDF (Inverse Positive Negative Document Frequency) N / A+C: The A+C indicate the total number of documents contain the term in both positive and negative class of documents. To utilize the information of the proportion of documents in the dataset contain the term, the factor N / (A+C) is used in the proposed term weight measure. This factor assigns less weight to the terms that are occurred more in both positive and negative class of documents.
PNDDF (Positive Negative Documents Differentiating Factor): If a term got good weight in positive class means A>>B and D>>C which indicates the term obtained good weight when the term is distributed in more number of positive class documents (A) and less number of negative class documents (C). The terms that are satisfying the condition |A-D| > |B-C|, those terms got good weight in positive class of documents. In the proposed term weight measure, A-D|/|B-C| is used as one factor.
In this work, the experiment is conducted with different term weight measures. Most of the term weight measures used the information of how the terms are distributed in different classes of documents. To analyse the efficiency of different term weight measures, an example was taken with four different cases of how the term is distributed in positive and negative class of documents. In this example, 40 documents in positive class and 60 documents in negative class are considered. The positive and negative classes are separated based on the term weight is calculated in which class of document. For example, the dataset have multiple classes like C1, C2, C3, ….., Cj, when the term weight is calculated in a document D1 and this document belongs to class C3, then Class C3 becomes positive class and all other classes documents treated as negative class. In this example, binary classification is considered and the weights of terms are calculated in positive class of documents. Table 3 shows the term distribution of T1 in positive and negative class of documents.
Table 3. The term T1 distribution in dataset
|
CASE-1 |
Cp |
Cn |
|
T1 |
31 |
8 |
|
$\overline{T 1}$ |
9 |
52 |
In Table 3, the T1 term occurred in 31 positive class (Cp) of documents and 8 negative class (Cn) of documents. The T1 term is occurred in more number of positive class of documents when compared with negative class of documents (The difference is 23). So, the expected weight of term T1 is more in positive class of documents. Table 4 shows the term distribution of T2 in positive and negative class of documents.
Table 4. The term T2 distribution in dataset
|
CASE-2 |
Cp |
Cn |
|
T2 |
9 |
52 |
|
$\overline{T 2}$ |
31 |
8 |
In Table 4, the T2 term is occurred in 9 positive class (Cp) of documents and 52 negative class (Cn) of documents. In this case, the T2 term is occurred in more number of negative class of documents when compared with positive class of documents (the difference is 52-9 = 43). So, the expected weight of term T2 is very less in positive class of documents. Table 5 shows the term distribution of T3 in positive and negative class of documents.
Table 5. The term T3 distribution in dataset
|
CASE-3 |
Cp |
Cn |
|
T3 |
31 |
52 |
|
$\overline{T 3}$ |
9 |
8 |
In Table 5, the T3 term is occurred in 31 positive class (Cp) of documents and 52 negative class (Cn) of documents. In case – 3, the T3 term occurred in more number of negative class of documents when compared with positive class of documents but the difference (52-31 = 21) is less when compared with case-2. So the expected weight of term T3 is less compared to case-1 and more compared to case-2 in positive class of documents. Table 6 shows the term distribution of T4 in positive and negative class of documents.
Table 6. The term T4 distribution in dataset
|
CASE-4 |
Cp |
Cn |
|
T4 |
9 |
8 |
|
$\overline{T 4}$ |
31 |
52 |
In Table 6, the T4 term is occurred in 9 positive class (Cp) of documents and 8 negative class (Cn) of documents. In case – 4, the T4 term occurred in more number of positive class of documents when compared with negative class of documents but the difference (9-8 = 1) is very less when compared with case-1. So the expected weight of term T4 is very less compared to case-1 and more compared to case-2 and case-3 in positive class of documents. Finally, the expected order of weights for the terms are T1>T4>T3>T2.
All term weight measures used in this work are combination of two factors such as term frequency of a term in a document and the weight of a term in whole dataset. In this analysis, the term frequency factor is not used in the computation of term weight. The second factor impact is more when compared with first factor. So, second factor only used to compute the weight of terms. The Table 7 shows the computations for computing the expected order of term weights using TFIDF measure.
Table 7. The expected weight order of terms when computing with TFIDF measure
|
TFIDF |
|
|
|
IDF (T1) |
log(100/39)=log(2.564) |
0.9416 |
|
IDF (T2) |
Log(100/61)=log(1.6393) |
0.4943 |
|
IDF (T3) |
Log(100/83)=log(1.2048) |
0.1863 |
|
IDF (T4) |
Log(100/17)=log(5.8823) |
1.7719 |
|
|
|
T4>T1>T2>T3 |
In Table 7, the T4 term got more weight than other terms because the number of documents contain the term in whole document is less in case – 4 situation. The T3 term got less accuracy because the T3 term occurred in more number of documents than other terms. The Table 8 shows the computations for computing the expected order of term weights using TFIEF measure.
Table 8. The expected weight order of terms when computing with TFIEF measure
|
TFIEF |
|
|
|
IEF (T1) |
e–(39/100) = e -0.39 |
0.6771 |
|
IEF (T2) |
e–(61/100) = e -0.61 |
0.5434 |
|
IEF (T3) |
e–(83/100) = e -0.83 |
0.4360 |
|
IEF (T4) |
e–(17/100) = e -0.17 |
0.8437 |
|
|
|
T4>T1>T2>T3 |
In Table 8, the results of TFIDF are repeated. T4 term got highest weight and T3 term got less weight. The Table 9 shows the computations for computing the expected order of term weights using TFRF measure.
Table 9. The expected weight order of terms when computing with TFRF measure
|
TFRF |
|
|
|
RF (T1) |
Log(2+(31/8)) =log(2+3.875)=log(5.875) |
1.7707 |
|
RF (T2) |
Log(2+(9/52)) =log(2+0.173)=log(2.173) |
0.7761 |
|
RF (T3) |
Log(2+(31/52)) =log(2+0.596)=log(2.596) |
0.9539 |
|
RF (T4) |
Log(2+(9/8)) =log(2+1.125)=log(3.125) |
1.1394 |
|
|
|
T1>T4>T3>T2 |
Table 10. The expected weight order of terms when computing with TF-IDF-ICSDF measure
|
TF-TDF-ICSDF |
|
|
|
ICSDF (T1) |
1+log(2/(31/40+8/60)) =1+log(2/(0.775+0.134) =1+log(2.2002)=1+0.788 |
1.788 |
|
ICSDF (T2) |
1+log(2/(9/40+52/60)) =1+log(2/(0.225+0.867)) =1+log(1.831) = 1+0.6048 |
1.605 |
|
ICSDF (T3) |
1+log(2/(31/40+52/60)) =1+log(2/(0.775+0.867)) =1+log(1.218)=1+0.197 |
1.197 |
|
ICSDF (T4) |
1+log(2/(9/40+8/60)) =1+log(2/(0.225+0.134)) =1+log(5.571) = 1+1.717 |
2.717 |
|
|
|
T4>T1>T2>T3 |
|
IDF-ICSDF (T1) |
0.9415 * 1.788 |
1.6834 |
|
IDF-ICSDF (T2) |
0.4942 * 1.6048 |
0.7930 |
|
IDF-ICSDF (T3) |
0.1863 * 1.197 |
0.2230 |
|
IDF-ICSDF (T4) |
1.7719 * 2.717 |
4.8142 |
|
|
|
T4>T1>T2>T3 |
Table 11. The expected weight order of terms when computing with TF-PROB measure
|
TF-PROB |
|
|
|
Prob (T1) |
Log(1+31/9 * 31/8) =log(1+3.445*3.875) = log(14.349) |
2.6636 |
|
Prob (T2) |
Log(1+9/31*9/52) =log(1+0.2903*0.173) = log(1.050) |
0.0487 |
|
Prob (T3) |
Log(1+31/9 *31/52) =log(1+3.445*0.596) = log(3.0532) |
1.1161 |
|
Prob (T4) |
Log(1+9/31 *9/8) =log(1+0.2903*1.125) = log(1.3265) |
0.2825 |
|
|
|
T1>T3>T2>T4 |
Table 12. The expected weight order of terms when computing with TF-IGM measure
|
TF-IGM |
|
|
|
IGM(T1) |
1+7*(31/(31*1+8*2)=1+217/(31+16)) = 1+217/47 |
5.617 |
|
IGM(T2) |
1+ 7 *(52/(52*1+9*2)= 1+364/(52+18) = 1+364/70 |
6.2 |
|
IGM(T3) |
1+ 7 *(52/(52*1 +31*2)= 1+364/(52+62) = 1+364/114 |
4.1929 |
|
IGM(T4) |
1+ 7 *(9/(9*1+8*2)= 1+63/(9+16) = 1+63/25 |
3.52 |
|
|
|
T2>T1>T3>T4 |
Table 13. The expected weight order of terms when computing with CDallc measure
|
CDallc |
|
|
|
CDallc(T1) |
Max (31/100, 8/100) = 31/100 |
0.31 |
|
CDallc(T2) |
Max (9/100, 52/100) = 52/100 |
0.52 |
|
CDallc(T3) |
Max (31/100, 52/100) = 52/100 |
0.52 |
|
CDallc(T4) |
Max (9/100, 8/100) = 9/100 |
0.0.09 |
|
|
|
T2>T3>T1>T4 |
Table 14. The expected weight order of terms when computing with CDc measure
|
CDc |
|
|
|
CDc(T1) |
Max (31/40, 8/60) =max(0.775, 0.134) |
0.775 |
|
CDc(T2) |
Max (9/40, 52/60) =max(0.225, 0.867) |
0.867 |
|
CDc(T3) |
Max (31/40, 52/60) =max(0.775, 0.867) |
0.867 |
|
CDc(T4) |
Max (9/40, 8/60) =max(0.225, 0.134) |
0.225 |
|
|
|
T2>T3>T1>T4 |
Table 15. The expected weight order of terms when computing with TF-NRF-IPNDF-PNDDF measure
|
TF-NRF-IPNDF-PNDDF |
$T F\left(T_{i}, D_{k}\right) \times \frac{\frac{A}{A+B}}{\frac{C}{C+D}} \times \frac{N}{(A+C)} \times\left|\frac{A-D}{B-C}\right|$ |
|
|
|
Log((31*60)/(8*40))*(100/(31+8))*|((31-52)/(8-9))|= log(1860/320) * (100/39) *|(21/-1)|= log(5.8125) * 2.564 * 21 = 1.760*2.56*21 |
94.6176 |
|
|
Log((9*60)/(52*40))*(100/(9+52))*|((9-8)/(52-31))|= log(540/2080) * (100/61) * (1/21)= log(0.259)*1.639 *0.0476= -1.35*1.639 *0.0476 |
-0.1053 |
|
|
Log((31*60)/(52*40))*(100/(31+52))* |((31-8)/(52-9))|= log(1860/2080)*(100/83)*(23/43)= log(0.8942)*1.204 *0.534 = -0.112* 1.204 * 0.5348 |
-0.0721 |
|
|
Log((9*60)/(8*40))*(100/(9+8))*|((9-52)/(8-31))|= log(540/320) * (100/17) *(43/23)= log(1.687) *5.882 *1.869 = 0.5238*5.882*1.869 |
5.7644 |
|
|
|
T1, T4, T3, T2 |
In Table 9, the T1 got the highest weight because the term T1 is occurred in more number of positive documents than negative documents. The term T2 got the less weight because the term T2 is occurred in more number of negative class documents than positive class documents. TFRF measure satisfies the expected weight order of terms. The Table 10 shows the computations for computing the expected order of term weights using TF-IDF-ICSDF measure.
In Table 10, the T4 got highest weight and T3 got lowest weight by the TF-IDF-ICSDF measure. The expected weight order of terms is not satisfied by TF-IDF-ICSDF measure.
The Table 11 shows the computations for computing the expected order of term weights using TF-PROB measure. In Table 11, the TF-PROB measure assigns more weight to the T1 term and less weight to the T4 term. The expected weight order of terms is not achieved by this TF-PROB measure.
The Table 12 shows the computations for computing the expected order of term weights using TF-IGM measure. In Table 12, the term T2 got highest weight and T4 got less weight by the TF-IGM measure. The expected weight order of terms is not attained by TF-PROB measure.
The Table 13 shows the computations for computing the expected order of term weights using CDallc measure. In Table 13, the CDallc measure assigns more weight to the term T2 and less weight to the term T4. The expected weight order of terms is not obtained by this measure.
The Table 14 shows the computations for computing the expected order of term weights using CDc measure. In Table 14, the T2 term got highest weight and T4 term got less weight by the CDc measure. The CDc measure is not attained the weight order of terms.
The Table 15 shows the computations for computing the expected order of term weights using proposed TF-NRF-IPNDF-PNDDF measure. In Table 15, the proposed term weight measure assigns highest weight to the term T1 than other terms and lowest weight to the term T2 than other terms. The proposed measure obtained expected weight order of terms. This measure used the correct combination of term distribution information.
In this work, the experiment is conducted for text classification. Six different popular datasets such as IMDB, HSS, FN, 20NG, AGN and CBN are considered in this work for text classification experiments. The task is determining the performance of proposed approach for text classification. The experiment conducted with content words like most frequent words for text classification. The most frequent words of 8000 words are considered in this experiment. It was observed that the accuracies of text classification is not changed or reduced when experiment conducted with more than 8000 words. The experiment started with 2000 words and incremented by 2000 in every iteration. These most frequent words are used to represent the document vectors and six different machine learning algorithms are used to generate the classification model by using these document vectors. Vector values in these vectors are calculated with term weight measures. The experimental results of different term weight measures including proposed term weight measure on HSS dataset by using different machine learning algorithms are presented in Table 16.
In Table 16, the proposed term weight measure attained best accuracy of 0.8505 for text classification on HSS dataset when experimented with RF classifier. The RF classification algorithm performance is good when compared with other classification algorithms. The proposed TF-NRF-IPNDF-PNDDF measure attained highest accuracies of 0.7375, 0.7, 0.7625, 0.8, 0.6825 and 0.8505 for text classification than other term weight measures when experimented with KNN [24], NBM [25], LR [26], SVM [27], DT and RF [28, 29] classifiers respectively.
Table 17 displays the experimental results of different term weight measures including proposed term weight measure on FN dataset by using different machine learning algorithms. In Table 17, the proposed term weight measure attained best accuracy of 0.858 for text classification on FN dataset when experimented with RF classifier. The RF classification algorithm performance is good when compared with other classification algorithms. The proposed TF-NRF-IPNDF-PNDDF measure attained highest accuracies of 0.810, 0.816, 0.823, 0.846, 0.812 and 0.858 for text classification than other term weight measures when experimented with KNN, NBM, LR, SVM, DT and RF classifiers respectively.
Table 18 displays the experimental results of different term weight measures including proposed term weight measure on IMDB dataset by using different machine learning algorithms. In Table 18, the proposed term weight measure attained best accuracy of 0.875 for text classification on IMDB dataset when experimented with RF classifier. The RF classification algorithm performance is good when compared with other classification algorithms. The proposed TF-NRF-IPNDF-PNDDF measure attained highest accuracies of 0.692, 0.781, 0.861, 0.869, 0.706 and 0.875 for text classification than other term weight measures when experimented with KNN, NBM, LR, SVM, DT and RF classifiers respectively.
Table 19 displays the experimental results of different term weight measures including proposed term weight measure on 20NG dataset by using different machine learning algorithms. In Table 19, the proposed term weight measure attained best accuracy of 0.927 for text classification on 20NG dataset when experimented with RF classifier. The RF classification algorithm performance is good when compared with other classification algorithms. The proposed TF-NRF-IPNDF-PNDDF measure attained highest accuracies of 0.817, 0.833, 0.885, 0.895, 0.817 and 0.927 for text classification than other term weight measures when experimented with KNN, NBM, LR, SVM, DT and RF classifiers respectively.
Table 20 displays the experimental results of different term weight measures including proposed term weight measure on AGN dataset by using different machine learning algorithms. In Table 20, the proposed term weight measure attained best accuracy of 0.9072 for text classification on AGN dataset when experimented with RF classifier. The RF classification algorithm performance is good when compared with other classification algorithms. The proposed TF-NRF-IPNDF-PNDDF measure attained highest accuracies of 0.8751, 0.8369, 0.8990, 0.9005, 0.8793 and 0.9072 for text classification than other term weight measures when experimented with KNN, NBM, LR, SVM, DT and RF classifiers respectively.
Table 21 displays the experimental results of different term weight measures including proposed term weight measure on CBN dataset by using different machine learning algorithms. In Table 21, the proposed term weight measure attained best accuracy of 0.8275 for text classification on CBN dataset when experimented with RF classifier. The RF classification algorithm performance is good when compared with other classification algorithms. The proposed TF-NRF-IPNDF-PNDDF measure attained highest accuracies of 0.7595, 0.7785, 0.8100, 0.8135, 0.7665 and 0.8275 for text classification than other term weight measures when experimented with KNN, NBM, LR, SVM, DT and RF classifiers respectively.
Table 16. The accuracies of text classification when experimented with HSS dataset
|
Term Weight Measures / ML Algorithms |
TF-IDF |
TF-IEF |
TFRF |
TF-IDF-ICSDF |
TF-PROB |
TF-IGM |
CDallc |
CDc |
TF-NRF-IPNDF-PNDDF |
|
|
KNN |
2000 |
0.6875 |
0.5875 |
0.675 |
0.675 |
0.5775 |
0.6 |
0.6125 |
0.6125 |
0.725 |
|
4000 |
0.6625 |
0.45 |
0.675 |
0.7 |
0.5825 |
0.625 |
0.6125 |
0.6125 |
0.7375 |
|
|
6000 |
0.6875 |
0.5375 |
0.6625 |
0.7 |
0.5725 |
0.675 |
0.625 |
0.625 |
0.7375 |
|
|
8000 |
0.65 |
0.525 |
0.6875 |
0.625 |
0.5875 |
0.65 |
0.6125 |
0.6125 |
0.725 |
|
|
NBM |
2000 |
0.6875 |
0.4625 |
0.6875 |
0.6875 |
0.6875 |
0.6875 |
0.6375 |
0.6375 |
0.7 |
|
4000 |
0.6125 |
0.475 |
0.6375 |
0.6125 |
0.6875 |
0.625 |
0.6125 |
0.6125 |
0.7 |
|
|
6000 |
0.65 |
0.5375 |
0.6 |
0.6375 |
0.6125 |
0.6375 |
0.625 |
0.625 |
0.6625 |
|
|
8000 |
0.6125 |
0.5625 |
0.5625 |
0.6125 |
0.6375 |
0.6875 |
0.65 |
0.65 |
0.6925 |
|
|
LR |
2000 |
0.625 |
0.45 |
0.6875 |
0.6875 |
0.6375 |
0.7 |
0.675 |
0.6625 |
0.7375 |
|
4000 |
0.625 |
0.475 |
0.6875 |
0.7 |
0.6375 |
0.6875 |
0.675 |
0.675 |
0.7375 |
|
|
6000 |
0.6125 |
0.475 |
0.725 |
0.675 |
0.65 |
0.6875 |
0.675 |
0.675 |
0.75 |
|
|
8000 |
0.6125 |
0.4875 |
0.725 |
0.675 |
0.6375 |
0.725 |
0.675 |
0.675 |
0.7625 |
|
|
SVM |
2000 |
0.625 |
0.45 |
0.7125 |
0.7125 |
0.625 |
0.7375 |
0.7375 |
0.725 |
0.75 |
|
4000 |
0.6375 |
0.4625 |
0.7375 |
0.7 |
0.625 |
0.7375 |
0.725 |
0.7125 |
0.7625 |
|
|
6000 |
0.6125 |
0.4625 |
0.7375 |
0.675 |
0.625 |
0.75 |
0.725 |
0.725 |
0.775 |
|
|
8000 |
0.6125 |
0.4625 |
0.75 |
0.6625 |
0.625 |
0.7375 |
0.725 |
0.725 |
0.8 |
|
|
DT |
2000 |
0.6125 |
0.425 |
0.65 |
0.65 |
0.6125 |
0.6125 |
0.5875 |
0.6 |
0.6575 |
|
4000 |
0.6375 |
0.4875 |
0.6375 |
0.6625 |
0.6125 |
0.5875 |
0.675 |
0.6625 |
0.6825 |
|
|
6000 |
0.6375 |
0.6125 |
0.6625 |
0.625 |
0.6 |
0.6 |
0.5625 |
0.575 |
0.675 |
|
|
8000 |
0.65 |
0.6125 |
0.5875 |
0.625 |
0.6125 |
0.6125 |
0.5375 |
0.55 |
0.675 |
|
|
RF |
2000 |
0.65 |
0.4375 |
0.775 |
0.785 |
0.675 |
0.7825 |
0.725 |
0.7125 |
0.8125 |
|
4000 |
0.625 |
0.5875 |
0.7375 |
0.7925 |
0.7 |
0.785 |
0.75 |
0.675 |
0.8375 |
|
|
6000 |
0.65 |
0.65 |
0.7625 |
0.8125 |
0.725 |
0.775 |
0.6375 |
0.65 |
0.8425 |
|
|
8000 |
0.665 |
0.625 |
0.75 |
0.825 |
0.75 |
0.8125 |
0.7375 |
0.65 |
0.8505 |
|
Table 17. The accuracies of text classification when experimented with FN dataset
|
Term Weight Measures / ML Algorithms |
TF-IDF |
TF-IEF |
TFRF |
TF-IDF-ICSDF |
TF-PROB |
TF-IGM |
CDallc |
CDc |
TF-NRF-IPNDF-PNDDF |
|
|
KNN |
2000 |
0.743 |
0.674 |
0.780 |
0.707 |
0.746 |
0.782 |
0.747 |
0.750 |
0.810 |
|
4000 |
0.735 |
0.625 |
0.771 |
0.773 |
0.757 |
0.767 |
0.746 |
0.750 |
0.806 |
|
|
6000 |
0.759 |
0.649 |
0.752 |
0.763 |
0.747 |
0.761 |
0.746 |
0.750 |
0.804 |
|
|
8000 |
0.741 |
0.695 |
0.750 |
0.740 |
0.755 |
0.761 |
0.746 |
0.750 |
0.809 |
|
|
NBM |
2000 |
0.685 |
0.462 |
0.794 |
0.771 |
0.742 |
0.791 |
0.694 |
0.694 |
0.804 |
|
4000 |
0.688 |
0.588 |
0.779 |
0.789 |
0.747 |
0.756 |
0.698 |
0.697 |
0.816 |
|
|
6000 |
0.685 |
0.663 |
0.789 |
0.777 |
0.754 |
0.768 |
0.703 |
0.692 |
0.814 |
|
|
8000 |
0.689 |
0.639 |
0.765 |
0.791 |
0.750 |
0.796 |
0.703 |
0.693 |
0.810 |
|
|
LR |
2000 |
0.679 |
0.539 |
0.787 |
0.798 |
0.784 |
0.810 |
0.692 |
0.708 |
0.822 |
|
4000 |
0.677 |
0.539 |
0.787 |
0.791 |
0.781 |
0.806 |
0.702 |
0.715 |
0.822 |
|
|
6000 |
0.686 |
0.542 |
0.791 |
0.790 |
0.791 |
0.809 |
0.706 |
0.725 |
0.821 |
|
|
8000 |
0.687 |
0.549 |
0.791 |
0.802 |
0.784 |
0.814 |
0.711 |
0.726 |
0.823 |
|
|
SVM |
2000 |
0.727 |
0.539 |
0.8057 |
0.8140 |
0.8063 |
0.835 |
0.773 |
0.776 |
0.841 |
|
4000 |
0.725 |
0.539 |
0.8060 |
0.8146 |
0.8062 |
0.826 |
0.773 |
0.776 |
0.846 |
|
|
6000 |
0.728 |
0.542 |
0.8177 |
0.8168 |
0.8124 |
0.813 |
0.773 |
0.776 |
0.842 |
|
|
8000 |
0.720 |
0.543 |
0.8177 |
0.8268 |
0.8162 |
0.832 |
0.773 |
0.776 |
0.842 |
|
|
DT |
2000 |
0.717 |
0.539 |
0.760 |
0.773 |
0.757 |
0.788 |
0.741 |
0.750 |
0.801 |
|
4000 |
0.721 |
0.653 |
0.748 |
0.768 |
0.769 |
0.795 |
0.753 |
0.737 |
0.812 |
|
|
6000 |
0.715 |
0.695 |
0.757 |
0.770 |
0.765 |
0.801 |
0.740 |
0.736 |
0.807 |
|
|
8000 |
0.705 |
0.694 |
0.751 |
0.775 |
0.756 |
0.792 |
0.743 |
0.743 |
0.805 |
|
|
RF |
2000 |
0.712 |
0.709 |
0.812 |
0.838 |
0.821 |
0.836 |
0.777 |
0.780 |
0.853 |
|
4000 |
0.726 |
0.703 |
0.818 |
0.836 |
0.825 |
0.842 |
0.772 |
0.778 |
0.858 |
|
|
6000 |
0.728 |
0.715 |
0.817 |
0.832 |
0.823 |
0.837 |
0.777 |
0.778 |
0.853 |
|
|
8000 |
0.738 |
0.714 |
0.816 |
0.833 |
0.826 |
0.836 |
0.773 |
0.771 |
0.856 |
|
Table 18. The accuracies of text classification when experimented with IMDB dataset
|
Term Weight Measures / ML Algorithms |
TF-IDF |
TF-IEF |
TFRF |
TF-IDF-ICSDF |
TF-PROB |
TF-IGM |
CDallc |
CDc |
TF-NRF-IPNDF-PNDDF |
|
|
KNN |
2000 |
0.606 |
0.548 |
0.579 |
0.579 |
0.535 |
0.644 |
0.597 |
0.598 |
0.692 |
|
4000 |
0.574 |
0.563 |
0.582 |
0.556 |
0.536 |
0.658 |
0.597 |
0.598 |
0.688 |
|
|
6000 |
0.589 |
0.546 |
0.574 |
0.637 |
0.536 |
0.63 |
0.597 |
0.598 |
0.674 |
|
|
8000 |
0.568 |
0.573 |
0.567 |
0.594 |
0.536 |
0.627 |
0.597 |
0.598 |
0.669 |
|
|
NBM |
2000 |
0.631 |
0.531 |
0.731 |
0.731 |
0.699 |
0.731 |
0.761 |
0.761 |
0.781 |
|
4000 |
0.691 |
0.543 |
0.691 |
0.69 |
0.639 |
0.693 |
0.72 |
0.719 |
0.774 |
|
|
6000 |
0.637 |
0.564 |
0.629 |
0.635 |
0.646 |
0.637 |
0.684 |
0.686 |
0.708 |
|
|
8000 |
0.635 |
0.608 |
0.618 |
0.636 |
0.67 |
0.646 |
0.674 |
0.674 |
0.683 |
|
|
LR |
2000 |
0.705 |
0.525 |
0.814 |
0.814 |
0.783 |
0.819 |
0.785 |
0.782 |
0.839 |
|
4000 |
0.728 |
0.53 |
0.823 |
0.819 |
0.783 |
0.837 |
0.785 |
0.782 |
0.855 |
|
|
6000 |
0.732 |
0.537 |
0.827 |
0.818 |
0.785 |
0.84 |
0.785 |
0.782 |
0.859 |
|
|
8000 |
0.746 |
0.546 |
0.836 |
0.83 |
0.783 |
0.852 |
0.785 |
0.782 |
0.861 |
|
|
SVM |
2000 |
0.693 |
0.525 |
0.795 |
0.795 |
0.801 |
0.811 |
0.789 |
0.791 |
0.844 |
|
4000 |
0.712 |
0.525 |
0.81 |
0.804 |
0.798 |
0.824 |
0.791 |
0.799 |
0.853 |
|
|
6000 |
0.715 |
0.526 |
0.819 |
0.801 |
0.798 |
0.83 |
0.795 |
0.796 |
0.869 |
|
|
8000 |
0.731 |
0.527 |
0.825 |
0.808 |
0.798 |
0.834 |
0.793 |
0.788 |
0.867 |
|
|
DT |
2000 |
0.653 |
0.528 |
0.659 |
0.659 |
0.659 |
0.669 |
0.668 |
0.66 |
0.691 |
|
4000 |
0.654 |
0.521 |
0.67 |
0.659 |
0.669 |
0.667 |
0.679 |
0.675 |
0.682 |
|
|
6000 |
0.654 |
0.541 |
0.673 |
0.665 |
0.658 |
0.658 |
0.691 |
0.665 |
0.706 |
|
|
8000 |
0.658 |
0.562 |
0.67 |
0.65 |
0.666 |
0.656 |
0.68 |
0.679 |
0.689 |
|
|
RF |
2000 |
0.736 |
0.53 |
0.831 |
0.831 |
0.831 |
0.825 |
0.823 |
0.825 |
0.849 |
|
4000 |
0.736 |
0.569 |
0.828 |
0.834 |
0.846 |
0.825 |
0.824 |
0.837 |
0.851 |
|
|
6000 |
0.737 |
0.578 |
0.824 |
0.83 |
0.846 |
0.841 |
0.836 |
0.838 |
0.875 |
|
|
8000 |
0.741 |
0.601 |
0.842 |
0.846 |
0.836 |
0.841 |
0.826 |
0.84 |
0.862 |
|
Table 19. The accuracies of text classification when experimented with 20NG dataset
|
Term Weight Measures / ML Algorithms |
TF-IDF |
TF-IEF |
TFRF |
TF-IDF-ICSDF |
TF-PROB |
TF-IGM |
CDallc |
CDc |
TF-NRF-IPNDF-PNDDF |
|
|
KNN |
2000 |
0.766 |
0.65 |
0.766 |
0.767 |
0.7 |
0.733 |
0.767 |
0.767 |
0.807 |
|
4000 |
0.783 |
0.533 |
0.783 |
0.75 |
0.7 |
0.75 |
0.733 |
0.733 |
0.813 |
|
|
6000 |
0.75 |
0.583 |
0.717 |
0.733 |
0.7 |
0.75 |
0.733 |
0.733 |
0.817 |
|
|
8000 |
0.733 |
0.583 |
0.716 |
0.733 |
0.7 |
0.733 |
0.733 |
0.733 |
0.817 |
|
|
NBM |
2000 |
0.733 |
0.633 |
0.716 |
0.817 |
0.767 |
0.717 |
0.783 |
0.783 |
0.827 |
|
4000 |
0.75 |
0.5 |
0.783 |
0.75 |
0.783 |
0.717 |
0.717 |
0.717 |
0.833 |
|
|
6000 |
0.766 |
0.566 |
0.767 |
0.75 |
0.733 |
0.817 |
0.75 |
0.75 |
0.823 |
|
|
8000 |
0.733 |
0.6 |
0.767 |
0.733 |
0.75 |
0.8 |
0.717 |
0.717 |
0.823 |
|
|
LR |
2000 |
0.733 |
0.516 |
0.75 |
0.75 |
0.783 |
0.817 |
0.767 |
0.75 |
0.863 |
|
4000 |
0.783 |
0.5 |
0.733 |
0.733 |
0.783 |
0.8 |
0.767 |
0.75 |
0.867 |
|
|
6000 |
0.7 |
0.533 |
0.733 |
0.783 |
0.783 |
0.827 |
0.767 |
0.75 |
0.883 |
|
|
8000 |
0.716 |
0.5 |
0.733 |
0.783 |
0.783 |
0.8 |
0.767 |
0.75 |
0.885 |
|
|
SVM |
2000 |
0.716 |
0.483 |
0.733 |
0.733 |
0.8 |
0.833 |
0.783 |
0.783 |
0.867 |
|
4000 |
0.766 |
0.5 |
0.733 |
0.717 |
0.8 |
0.863 |
0.817 |
0.773 |
0.893 |
|
|
6000 |
0.783 |
0.5 |
0.733 |
0.733 |
0.8 |
0.863 |
0.817 |
0.783 |
0.895 |
|
|
8000 |
0.75 |
0.5 |
0.733 |
0.75 |
0.8 |
0.8 |
0.817 |
0.793 |
0.867 |
|
|
DT |
2000 |
0.733 |
0.55 |
0.716 |
0.717 |
0.733 |
0.733 |
0.767 |
0.783 |
0.803 |
|
4000 |
0.716 |
0.516 |
0.716 |
0.75 |
0.733 |
0.717 |
0.75 |
0.767 |
0.813 |
|
|
6000 |
0.683 |
0.566 |
0.75 |
0.783 |
0.783 |
0.7 |
0.767 |
0.75 |
0.815 |
|
|
8000 |
0.683 |
0.483 |
0.733 |
0.797 |
0.75 |
0.733 |
0.75 |
0.783 |
0.817 |
|
|
RF |
2000 |
0.683 |
0.583 |
0.816 |
0.817 |
0.867 |
0.883 |
0.8 |
0.817 |
0.897 |
|
4000 |
0.7 |
0.583 |
0.766 |
0.783 |
0.883 |
0.883 |
0.717 |
0.833 |
0.915 |
|
|
6000 |
0.716 |
0.6 |
0.8 |
0.767 |
0.883 |
0.867 |
0.767 |
0.75 |
0.927 |
|
|
8000 |
0.7 |
0.55 |
0.8 |
0.817 |
0.867 |
0.817 |
0.767 |
0.783 |
0.923 |
|
Table 20. The accuracies of text classification when experimented with AGN dataset
|
Term Weight Measures / ML Algorithms |
TF-IDF |
TF-IEF |
TFRF |
TF-IDF-ICSDF |
TF-PROB |
TF-IGM |
CDallc |
CDc |
TF-NRF-IPNDF-PNDDF |
|
|
KNN |
2000 |
0.7793 |
0.7475 |
0.8438 |
0.8560 |
0.8341 |
0.8714 |
0.8108 |
0.8105 |
0.8748 |
|
4000 |
0.7708 |
0.7514 |
0.8457 |
0.8602 |
0.8329 |
0.8708 |
0.8184 |
0.8142 |
0.8723 |
|
|
6000 |
0.7642 |
0.7420 |
0.8451 |
0.8566 |
0.8329 |
0.8626 |
0.8178 |
0.8066 |
0.8751 |
|
|
8000 |
0.7505 |
0.7205 |
0.8448 |
0.8354 |
0.8329 |
0.8620 |
0.8129 |
0.8111 |
0.8719 |
|
|
NBM |
2000 |
0.7462 |
0.6319 |
0.7429 |
0.7384 |
0.7417 |
0.7417 |
0.7911 |
0.7917 |
0.8271 |
|
4000 |
0.7866 |
0.6983 |
0.7835 |
0.7805 |
0.7416 |
0.7850 |
0.8014 |
0.8069 |
0.8302 |
|
|
6000 |
0.7881 |
0.6998 |
0.7835 |
0.7811 |
0.7414 |
0.7869 |
0.8032 |
0.8032 |
0.8369 |
|
|
8000 |
0.8002 |
0.7047 |
0.7981 |
0.8129 |
0.7415 |
0.8111 |
0.8078 |
0.8056 |
0.8356 |
|
|
LR |
2000 |
0.7969 |
0.7256 |
0.8957 |
0.8878 |
0.8256 |
0.8930 |
0.8056 |
0.8217 |
0.8990 |
|
4000 |
0.7769 |
0.7256 |
0.8914 |
0.8860 |
0.8265 |
0.8836 |
0.8026 |
0.8233 |
0.8966 |
|
|
6000 |
0.7854 |
0.7256 |
0.8942 |
0.8805 |
0.8259 |
0.8866 |
0.8267 |
0.8211 |
0.8987 |
|
|
8000 |
0.7833 |
0.7256 |
0.8936 |
0.8839 |
0.8255 |
0.8842 |
0.8239 |
0.8299 |
0.8987 |
|
|
SVM |
2000 |
0.7975 |
0.7393 |
0.8920 |
0.8908 |
0.8259 |
0.8920 |
0.8029 |
0.8339 |
0.8978 |
|
4000 |
0.7981 |
0.7523 |
0.8917 |
0.8848 |
0.8305 |
0.8878 |
0.8178 |
0.8414 |
0.8926 |
|
|
6000 |
0.7972 |
0.7368 |
0.8926 |
0.8823 |
0.8317 |
0.8936 |
0.8154 |
0.8333 |
0.8959 |
|
|
8000 |
0.7896 |
0.7587 |
0.8942 |
0.8754 |
0.8307 |
0.8996 |
0.8175 |
0.8442 |
0.9005 |
|
|
DT |
2000 |
0.7920 |
0.7063 |
0.8478 |
0.8557 |
0.8217 |
0.8651 |
0.8151 |
0.8196 |
0.8769 |
|
4000 |
0.7832 |
0.7260 |
0.8396 |
0.8414 |
0.8208 |
0.8626 |
0.8199 |
0.8190 |
0.8793 |
|
|
6000 |
0.7808 |
0.7241 |
0.8251 |
0.8566 |
0.8275 |
0.8605 |
0.8190 |
0.8178 |
0.8745 |
|
|
8000 |
0.7933 |
0.7250 |
0.8439 |
0.8457 |
0.8287 |
0.8629 |
0.8196 |
0.8142 |
0.8773 |
|
|
RF |
2000 |
0.7957 |
0.7072 |
0.8993 |
0.8875 |
0.8720 |
0.8845 |
0.8430 |
0.8587 |
0.9011 |
|
4000 |
0.7975 |
0.7272 |
0.8951 |
0.8872 |
0.8696 |
0.8969 |
0.8469 |
0.8605 |
0.9072 |
|
|
6000 |
0.8136 |
0.7244 |
0.8993 |
0.8893 |
0.8711 |
0.8939 |
0.8587 |
0.8630 |
0.9026 |
|
|
8000 |
0.8063 |
0.7226 |
0.8998 |
0.8893 |
0.8726 |
0.8906 |
0.8493 |
0.8642 |
0.9051 |
|
Table 21. The accuracies of text classification when experimented with CBN dataset
|
Term Weight Measures / ML Algorithms |
TF-IDF |
TF-IEF |
TFRF |
TF-IDF-ICSDF |
TF-PROB |
TF-IGM |
CDallc |
CDc |
TF-NRF-IPNDF-PNDDF |
|
|
KNN |
2000 |
0.6125 |
0.5155 |
0.7175 |
0.7345 |
0.7245 |
0.7445 |
0.7125 |
0.7215 |
0.7555 |
|
4000 |
0.65 |
0.507 |
0.7325 |
0.7485 |
0.7315 |
0.7475 |
0.7325 |
0.7345 |
0.7575 |
|
|
6000 |
0.6375 |
0.496 |
0.74 |
0.7385 |
0.7365 |
0.7484 |
0.7185 |
0.7195 |
0.7525 |
|
|
8000 |
0.6 |
0.4915 |
0.7375 |
0.7565 |
0.7495 |
0.7581 |
0.7115 |
0.7205 |
0.7595 |
|
|
NBM |
2000 |
0.6475 |
0.5025 |
0.7325 |
0.7625 |
0.7445 |
0.7615 |
0.7215 |
0.7335 |
0.7715 |
|
4000 |
0.625 |
0.4945 |
0.7275 |
0.7695 |
0.7325 |
0.7635 |
0.7225 |
0.7385 |
0.7765 |
|
|
6000 |
0.6375 |
0.4995 |
0.7500 |
0.75 |
0.7565 |
0.7655 |
0.7285 |
0.7365 |
0.7785 |
|
|
8000 |
0.6525 |
0.4955 |
0.7475 |
0.7705 |
0.7495 |
0.7715 |
0.7245 |
0.7305 |
0.7755 |
|
|
LR |
2000 |
0.6875 |
0.5995 |
0.7725 |
0.7825 |
0.7705 |
0.7975 |
0.7325 |
0.7495 |
0.8015 |
|
4000 |
0.675 |
0.5985 |
0.7675 |
0.7805 |
0.7785 |
0.7965 |
0.7235 |
0.7325 |
0.8075 |
|
|
6000 |
0.675 |
0.592 |
0.7775 |
0.7875 |
0.7805 |
0.7995 |
0.7255 |
0.7485 |
0.8085 |
|
|
8000 |
0.675 |
0.5935 |
0.7625 |
0.7850 |
0.7725 |
0.7935 |
0.7345 |
0.7475 |
0.8100 |
|
|
SVM |
2000 |
0.675 |
0.5820 |
0.7525 |
0.7545 |
0.7450 |
0.7735 |
0.7045 |
0.7175 |
0.8025 |
|
4000 |
0.675 |
0.5825 |
0.7575 |
0.7565 |
0.7425 |
0.7775 |
0.7115 |
0.7125 |
0.8075 |
|
|
6000 |
0.6875 |
0.5865 |
0.7550 |
0.7525 |
0.7415 |
0.7765 |
0.7195 |
0.7235 |
0.8135 |
|
|
8000 |
0.7 |
0.5855 |
0.7565 |
0.7555 |
0.7525 |
0.7795 |
0.7295 |
0.7305 |
0.8105 |
|
|
DT |
2000 |
0.6505 |
0.5695 |
0.74 |
0.7455 |
0.7305 |
0.7495 |
0.7045 |
0.7185 |
0.7625 |
|
4000 |
0.6535 |
0.5015 |
0.742 |
0.7435 |
0.7405 |
0.7515 |
0.7085 |
0.7145 |
0.7665 |
|
|
6000 |
0.6725 |
0.5795 |
0.7425 |
0.7405 |
0.7355 |
0.7495 |
0.7165 |
0.7245 |
0.7535 |
|
|
8000 |
0.6755 |
0.508 |
0.7415 |
0.7445 |
0.7315 |
0.7415 |
0.7055 |
0.7105 |
0.7575 |
|
|
RF |
2000 |
0.7025 |
0.6025 |
0.7835 |
0.7795 |
0.7750 |
0.7860 |
0.7335 |
0.7415 |
0.8145 |
|
4000 |
0.7175 |
0.6155 |
0.7875 |
0.7825 |
0.7715 |
0.7965 |
0.7385 |
0.7475 |
0.8135 |
|
|
6000 |
0.7125 |
0.6095 |
0.7895 |
0.7795 |
0.7675 |
0.7805 |
0.7295 |
0.7505 |
0.8275 |
|
|
8000 |
0.7165 |
0.6125 |
0.7845 |
0.7800 |
0.7755 |
0.7885 |
0.7325 |
0.7515 |
0.8165 |
|
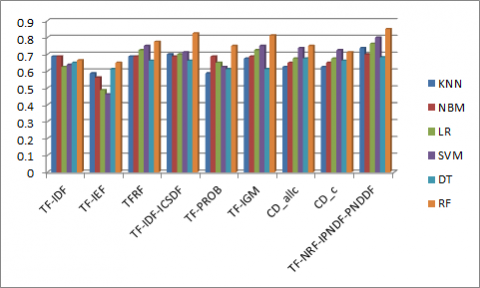
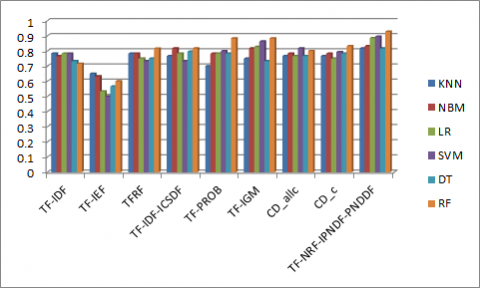
The term weight measures are used in this work to determine the importance of a term in vector representation of documents. In this work, different term weight measures are used and proposed a new term weight measure. Figure 2 shows the performance of different term weight measures for text classification on HSS dataset when experimented with different classifiers. In Figure 2, the proposed TF-NRF-IPNDF-PNDDF term weight measure attained highest accuracy of 0.8505 when RF classifier is used on HSS dataset. The proposed measure performance is good for text classification on HSS dataset when compared with other term weight measures.
Figure 2. The accuracies of text classification on HSS dataset
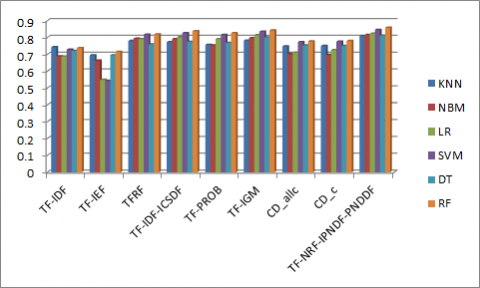
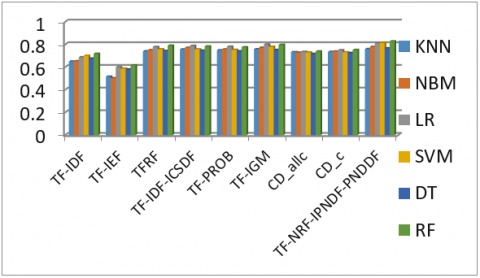
Figure 3. The accuracies of text classification on FN dataset
Figure 3 shows the performance of different term weight measures for text classification on FN dataset when experimented with different classifiers. In Figure 3, the proposed TF-NRF-IPNDF-PNDDF term weight measure attained highest accuracy of 0.858 when RF classifier is used on FN dataset. The proposed measure performance is good for text classification on FN dataset when compared with other term weight measures.
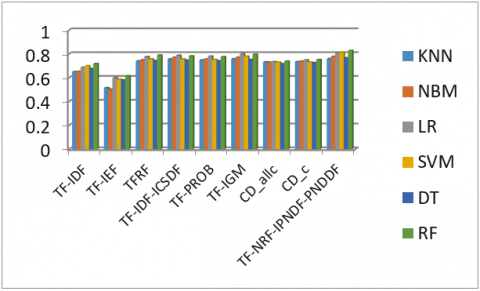
Figure 4 shows the performance of different term weight measures for text classification on IMDB dataset when experimented with different classifiers. In Figure 4, the proposed TF-NRF-IPNDF-PNDDF term weight measure attained highest accuracy of 0.875 when RF classifier is used on IMDB dataset. The proposed measure performance is good for text classification on IMDB dataset when compared with other term weight measures.
Figure 4. The accuracies of text classification on IMDB dataset
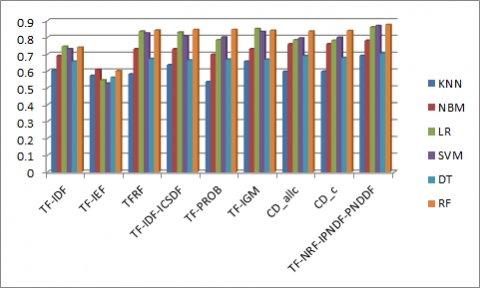
Figure 5 shows the performance of different term weight measures for text classification on 20NG dataset when experimented with different classifiers. In Figure 5, the proposed TF-NRF-IPNDF-PNDDF term weight measure attained highest accuracy of 0.927 when RF classifier is used on 20NG dataset. The proposed measure performance is good for text classification on 20NG dataset when compared with other term weight measures.
Figure 5. The accuracies of text classification on 20NG dataset
Figure 6. The accuracies of text classification on AGN dataset
Figure 6 shows the performance of different term weight measures for text classification on AGN dataset when experimented with different classifiers. In Figure 6, the proposed TF-NRF-IPNDF-PNDDF term weight measure attained highest accuracy of 0.9072 when RF classifier is used on AGN dataset. The proposed measure performance is good for text classification on AGN dataset when compared with other term weight measures.
Figure 7 shows the performance of different term weight measures for text classification on CBN dataset when experimented with different classifiers. In Figure 7, the proposed TF-NRF-IPNDF-PNDDF term weight measure attained highest accuracy of 0.8275 when RF classifier is used on CBN dataset. The proposed measure performance is good for text classification on CBN dataset when compared with other term weight measures.
Figure 7. The accuracies of text classification on CBN dataset
Most of the researchers in text classification used the content of a text to differentiate the type of a text. In this work, the content based features of terms re used for representing the document vectors. The term value in the vector representation is computed by using term weight measures. Term weight measures play an important role for representing the vector value. Researchers proposed different types of term weight measures to compute the weight of a term in a document vector representation. In this work, we proposed a new term weight measure named as TF-NRF-IPNDF-PNDDF and compared the performance of this with various term weight measures such as TFIDF, TFIEF, TFRF, TF-IDF-ICSDF, TF-PROB, TF-IGM, CDallc and CDc. The proposed term weight measure attained text classification accuracies of 0.8505, 0.858, 0.875, 0.927, 0.9072 and 0.8275 on the datasets HSS, FN, IMDB, 20NG, AGN and CBN respectively.
In this work, the individual terms are participated in the vector representation of documents. The information of whether the terms are having more weight in the positive class or negative class is not used in the document vector representation. In future work, we are planning to propose a new document representation technique, where the document weight is calculated by considering the term weight in positive class and negative class of documents. We are also planning to implement best feature selection algorithms along with term weight measures.
[1] Sebastiani, F. (2002). Machine learning in automated text categorization. ACM Computing Surveys (CSUR), 34(1): 1-47. https://doi.org/10.1145/505282.505283
[2] Debole, F., Sebastiani, F. (2004). Supervised term weighting for automated text categorization. In Text Mining and Its Applications, 81-97. https://doi.org/10.1007/978-3-540-45219-5_7
[3] Chen, L., Jiang, L., Li, C. (2021). Using modified term frequency to improve term weighting for text classification. Engineering Applications of Artificial Intelligence, 101: 104215. https://doi.org/10.1016/j.engappai.2021.104215
[4] Dogan, T., Uysal, A.K. (2020). A novel term weighting scheme for text classification: TF-MONO. Journal of Informetrics, 14(4): 101076. https://doi.org/10.1016/j.joi.2020.101076
[5] Chen, L., Jiang, L., Li, C. (2021). Modified DFS-based term weighting scheme for text classification. Expert Systems with Applications, 168: 114438. https://doi.org/10.1016/j.eswa.2020.114438
[6] Dogan, T., Uysal, A.K. (2019). Improved inverse gravity moment term weighting for text classification. Expert Systems with Applications, 130: 45-59. https://doi.org/10.1016/j.eswa.2019.04.015
[7] Tang, Z., Li, W., Li, Y., Zhao, W., Li, S. (2020). Several alternative term weighting methods for text representation and classification. Knowledge-Based Systems, 207: 106399. https://doi.org/10.1016/j.knosys.2020.106399
[8] https://pan.webis.de/clef21/pan21-web/author-profiling.html, accessed on September 6, 2021.
[9] https://www.kaggle.com/clmentbisaillon/fake-and-real-news-dataset, accessed on September 10, 2021.
[10] https://www.kaggle.com/lakshmi25npathi/imdb-dataset-of-50k-movie-reviews, accessed on September 12, 2021.
[11] Lang, K. (2008). 20 Newsgroups. Available: http://qwone.com/~jason/20Newsgroups/, accessed on September 6, 2021.
[12] ComeToMyHead. (2004).
Available: https://www.di.unipi.it/~gulli/AG_corpus_of_news_articles.html, accessed on September 6, 2021.
[13] https://www.kaggle.com/vikassingh1996/news-clickbait-dataset, accessed on September 6, 2021.
[14] Lovins, J.B. (1968). Development of a stemming algorithm. Mech. Transl. Comput. Linguistics, 11(1-2): 22-31.
[15] Porter MF. Developing the English Stemmer; 2002.
[16] Dash, M., Liu, H. (1997). Feature selection for classification. Intelligent Data Analysis, 1(1-4): 131-156. https://doi.org/10.1016/S1088-467X(97)00008-5
[17] Salton, G., Wong, A., Yang, C.S. (1975). A vector space model for automatic indexing. Communications of the ACM, 18(11), pp: 613-620. https://doi.org/10.1145/361219.361220
[18] Tang, Z., Li, W., Li, Y. (2020). An improved term weighting scheme for text classification. Concurrency and Computation: Practice and Experience, 32(9): e5604. https://doi.org/10.1002/cpe.5604
[19] Lan, M., Tan, C.L., Su, J., Lu, Y. (2008). Supervised and traditional term weighting methods for automatic text categorization. IEEE Transactions on Pattern Analysis and Machine Intelligence, 31(4): 721-735. https://doi.org/10.1109/TPAMI.2008.110
[20] Ren, F., Sohrab, M.G. (2013). Class-indexing-based term weighting for automatic text classification. Information Sciences, 23(6): 109-125. http://doi.org/10.1016/j.ins.2013.02.029
[21] Liu, Y., Loh, H.T., Sun, A. (2009). Imbalanced text classification: A term weighting approach. Expert Systems with Applications, 36(1): 690-701. http://doi.org/10. 1016/j.eswa.2007.10.042
[22] Henley, Chen, K., Zhang, Z., Long, J., Zhang, H. (2016). Turning from TF-IDF to TF-IGM for term weighting in text classification. Expert Systems with Applications, 66: 245-260. https://doi.org/10.1016/j.eswa.2016.09.009
[23] Fattah, M.A. (2015). New term weighting schemes with combination of multiple classifiers for sentiment analysis. Neurocomputing, 167: 434-442. http://dx.doi.org/10.1016/j.neucom.2015.04.051
[24] W.E. (1997). Construction of a k-nearest-neighbour credit-scoring system. IMA Journal of Management Mathematics, 8(4): 305-321.
[25] John, G.H., Langley, P. (2013). Estimating continuous distributions in Bayesian classifiers. Proceedings on 11th Conference in Uncertainty in Artificial Intelligence, pp. 338-345. https://doi.org/10.48550/arXiv.1302.4964
[26] Pranckevičius, T., Marcinkevičius, V. (2017). Comparison of naive bayes, random forest, decision tree, support vector machines, and logistic regression classifiers for text reviews classification. Baltic Journal of Modern Computing, 5(2): 221-232. http://dx.doi.org/10.22364/bjmc.2017.5.2.05
[27] Cortes, C., Vapnik, V. (1995). Machine Learning. 20: 273.
[28] Quinlan, J.R. (1986). Induction of decision trees. Machine Learning, 1(1):81-106.
[29] Breiman, L. (2001). Random forests. Machine Learning, 45(1): 5-32.