Amina Taouli* | Djamel Amar Bensaber | Khayra Bencherif | Nabil Keskes
© 2022 IIETA. This article is published by IIETA and is licensed under the CC BY 4.0 license (http://creativecommons.org/licenses/by/4.0/).
OPEN ACCESS
Big Data Analysis is a solution that makes it possible to extract valuable information from the mass of data by using deep learning algorithms and especially the Convolutional Neural Network algorithm. In this article, we have proposed an approach that allows the addition of the semantic aspect in the classification layer of the Convolutional Neural Network algorithm. The proposed approach helps medical professionals to develop an automatic system for identifying various classes of lung cancers. First, the input data are processed to reduce the search space, and the image noise, and normalize data. Then, the preprocessed data are analyzed to reduce image space by preserving all important features. After that, the semantic memory method converts the feature vectors from the analysis layer into semantic feature vectors. Finally, the last layer classifies the input image into two classes. We evaluate our approach using the LUNA16 dataset. Our study led to better results and predictions by reducing false negatives and positives using the Semantic Convolutional Neural Network algorithm. In our approach, cancer tissues can be identified with a maximum of 97.27% for accuracy and 99.46% for AUC. This model has increased efficiency compared with state-of-the-art approaches.
big data analysis, convolutional neural network, medical images, semantic analysis, semantic memory
In recent decades, the quantity of information has increased in an exponential manner in various systems. This information is required to have a wide range of new solutions and useful applications to build organizations and associations [1].
In fact, the data that are generated today are more important than the generated data just a few years ago. This mass also refers to the structural heterogeneity of the data sets. With this explosion of data of different structures, the term big data emerged and presented as the new oil [2] to designate the characteristics defined by Laney (Volume, Velocity, Variety), understand, and fully exploit the value of these datasets [3]. In this context, we face the main challenges from storage to analysis and visualization of these datasets.
Big Data characteristics have pushed the limits of traditional systems. In fact, most data has complex heterogeneous formats from different sources, which necessitate new methods of storage and analysis. Furthermore, traditional data depend on centralized architectures while big data relies on distributed architectures.
However, traditional data management, analysis techniques and infrastructures can no longer be used easily to analyze data. Therefore, there is a requirement for new tools and specialized methods for big data analysis. Big data analysis is the process of adding structures to data in order to identify facts, patterns, and hidden information [4].
In healthcare, we have to analyze massive data related to thousands of patients, detect the relations between the datasets, and introduce predictive models using machine learning techniques [5].
An important sub-domain of machine learning is Deep Learning (DL), which is used to extract valuable information from big data [6, 7]. The use of artificial neural networks in the DL domain is one of the most used methods for extracting information from complex datasets [8]. It allows understanding, detecting relationships between data, predicting future instances, and achieving better results.
Medical imaging is a technique for identifying and treating illnesses. In order to help experts diagnose diseases, deep learning models are coming forefront for the diagnosis, prediction, and detection of diseases like diabetic retinopathy, tuberculosis, and lung cancers [9].
Moreover, the Convolutional Neural Network (CNN) technique has several advantages in image identification, is one of the key reasons that allowed the power of deep learning to be recognized [10-12]. Because of their outstanding performance in computer vision, CNNs have been widely accepted by the medical imaging research community in recent years. The automatic medical imaging analysis is critical for modern medicine [13]; it allows exploiting data at different levels with different techniques. Most of these medical images are high-resolution images that cannot be directly applied to CNN algorithms. However, these images require a preliminary pre-processing step before feeding the CNN to ensure the quality and high performance of the other steps [14].
Recently, semantic analysis has become an active research subject aimed at bridging the gap between the features of low-level images and high-level semantics [15]. In fact, semantic solutions are used to assess, discover new information and resolve data inconsistencies coming from an existing knowledge base.
In order to have better results and predictions in the classification process, and to take advantage of the semantic dimension, we have proposed an approach called Semantic Convolutional Neural Network (SCNN) that introduces the semantic aspect via a statistical method, which is called Semantic Memory in the big data analysis stage [16]. Thus, this statistical method builds a semantic space from the co-occurrences of the input data by connecting the semantic layer to the classification layer to classify the medical images into the different existing classes.
The rest of this article is structured as follows: We review the state-of-the-art approaches in section 2. Section 3 provides an overview of the proposed approach. In section 4, the experimental findings and performance comparison are presented. In section 5, we conclude and suggest directions for future research.
Data itself faces the challenges of big data; which presents challenges at each stage of the value chain, from collecting to visualizing and using the data. The researchers addressed issues related to each step of the big data value chain (Acquisition, Integration, and Analysis) [17].
Naturally, the large datasets mostly contain unstructured data. Thus, the large-scale processing of these semi-structured or unstructured datasets represents a major stake for the analysis of big data [18]. As a result, a semantic context is required in order to assist scientists access and using data to have better results.
In this section, we enhance the state of the art in Ref. [19] by adding approaches that are based on the semantic dimension in the analysis of Big Data. Moreover, we classify these approaches into two classes: approaches that use semantic methods without Deep Learning algorithms and others that use semantic methods with Deep learning algorithms for analysis.
2.1 Semantic without the use of Deep Learning algorithms for analysis
Berat Sezer et al. [20] combined three technologies: IoT, big data, and the semantic web to analyze and semanticize its data. There are five key layers to this framework: data acquisition, extract-transform-load (ETL), semantic-rule reasoning, learning, and action layers. The main objective of the semantic layer is to use basic inferences through RDF data using the rules of reasoning, which are based on the semantic web technologies, as well as the specific rules to the users or the domain. Jabbar et al. [21] propose an approach in the medical field where the data are annotated with RDF schemas to achieve semantic interoperability with different IoT devices (SIMB -IoT). The datasets are queried using SPARQL queries to retrieve patient information.
Rinaldi and Russo [22] have proposed a semantic approach to combine ontological models using OWL and graph models implemented in a NoSQL database to take into account linguistic, multimedia, and semantic aspects. Barba-González et al. [23] proposed an approach called BIGOWL allowing the annotation of big data using the RDF repository. BIGOWL defines taxonomic relationships and instances representing individuals with the aim of maintaining knowledge management by covering a large vocabulary of terms and their ways of being connected.
Shakhovska et al. [24] presented a knowledge ontology to describe the underlying semantics of data retrieved from different sources. The proposed approach allows analyzing a large volume of different two-step structures: the first step consisted in forming the ontology of medical knowledge and the second step allows formalizing the process of the semantic classification. Castillo-Zúñiga et al. [25] have proposed a framework to explore and discover the benefits of information circulating on the internet and models to help with precise decision-making. To meet these objectives, they have combined Big Data analysis techniques with semantic web technologies that allow organizing and classifying information using machine learning algorithms.
Berges et al. [26] proposed a semantic visual query system to visualize and explore big data in an Industry 4.0 scenario for analysis. This system makes it possible to combine a personalized 2D digital representation with semantically annotated data which are associated with semantic descriptions using ontologies. A workflow has been proposed for the purposes of analysis and segmentation of dependencies in order to create the semantic web and extract efficient information in the field of mechanical, electrical, and plumbing (MEP) tasks [27]. To meet these objectives, they used several strategies. The first step consisted in collecting the MEP corpus using the snowball strategy. Then, the named entity recognition (NER) and relationship extraction (RE) methods are organized to distinguish whether the segments are MEP entities and have a syntactic relationship to generate the MEP semantic web. Finally, the strategy of path filtering and meta linking has been proposed to detect new relationships.
The main purpose of these approaches is to improve classification results by introducing ontologies, annotating data using RDF schemas, representing knowledge with OWL, and querying datasets using SPARQL queries. In these approaches, certain aspects related to scalability and heterogeneity are not taken into account. There are also deficiencies in the annotation of new instances and populating ontologies in other uses cases. Moreover, these methods need an experience in semantic web technologies to lead to the choice of a technique often depending on the objective of the analysis.
2.2 Semantic with the use of Deep Learning algorithms for analysis
The models in the study [28] presented an image caption system. They develop two neural networks that convert images and text fragments into a single vector representation. The cosine similarity between the related vectors is used by the authors to determine how similar the images and text are. The sentences are reclassified using the cosine similarity score. Finally, an entity recognition model identifies celebrities, monuments and a classifier to estimate the confidence score for each exit legend.
Burel et al. [29] propose a semantically improved Dual-CNN deep learning model to target the problem of detecting events in crisis situations using social media data. The tweets processed are symbolized in words which are therefore entered as input to the word integration phase. Then, it initializes the word vectors using word embeddings techniques. Afterward, it extracts the concepts and initializes the semantic vectors; because of their short duration and noisy nature, tweets frequently lack context. After that, they represent extracted entities and semantic types as a vector using the words embeddings approach. As a result, the semantic representation of documents is represented as a semantic integration matrix, which is used for the training of the proposed Dual-CNN model. The last phase aims to train the Dual-CNN model from the built-in semantic word matrix.
Zheng et al. [30] have proposed a model based on the CNN algorithm, the LIME algorithm, and the retrieval of external information from medical ontologies in order to detect the semantic similarity between pairs of imaging reports and extract the semantic features of texts. Roccetti et al. [31] attempted to train a recurrent neural network with a large quantity of fifteen million water meter readings. The proposed approach allows for predicting output which water meters are faulty according to water consumption readings. The semantic dimension is introduced in the analysis of big data in order to clean the training data and transform them from a statistical point of view using the semantics of the X factor.
Lin et al. [32] presented an approach that identifies semantic similarity between different address records using deep learning algorithms. First, they converted the address records to vectors using the word2vec model. Then, they applied an in-depth text matching model that can determine if two addresses match. They calculated the similarity after training the vectors between the address pairs. Finally, they applied the Random Forests and Support Vector Machine algorithms to predict the output. Ahmed et al. [33] proposed a system based on deep learning algorithms to semantically segment, classify and detect cancerous regions in MRI medical images. The first step allows removing all existing noise in order to reduce the false-positive rate. Then, they used transfer learning techniques with the pre-trained ResNet model to classify the images. After that, they semantically segmented only nodular areas in cancer patients using the two algorithms DeepLab and Mask RCNN.
The model in Ref. [34] is a combination of a deep convolutional network with a Word2Vec technique to analyze unstructured data to improve classification results. In fact, the Word2Vec technique is a two-layer neural network: an input layer and an output layer. These layers represent documents as sequences of words that will be converted into feature vectors that detect semantic and syntactic relationships between vectors of different lengths. Alam et al. [35] propose a model that allows combining CNN algorithms with different architectures by testing their models with remote sensing images. They proposed a SegNet model which is in fact an improvement of the convolutional neural network with the index pooling technique. Furthermore, they applied the U-net architecture for multi-target semantic segmentation.
Du et al. [36] propose a framework that combines the CNN algorithm with the PnP algorithm in order to obtain the 6D attitude of the pose. For this, they established and labeled a dataset of non-cooperative satellite images. Then, they designed a CNN network with the PnP algorithm to detect the key points to capture the targets in rotations with their corresponding characteristic points. Finally, they trained the BiSeNet model to semantically segment the satellite components in real-time. Guo [37] proposed a model that allows the analysis of semantic texts using deep learning algorithms (DLSTA) in order to detect human emotions using Word embeddings which combines syntactic and semantic features. These characteristics are converted into features vectors, which will be connected in a support vector machine algorithm in order to identify the emotional state of the person.
These approaches propose models by combining the semantic dimension with deep learning algorithms to achieve better results in classification, decision-making, and prediction. The semantic aspect has often been introduced via statistical methods or semantic segmentation with the aim of improving classification results with different metrics. However, these methods make it possible to work with matrices; and their decompositions require too many calculations. In addition, the similarity of documents that are used in some approaches is not bidirectional and does not consider hierarchical relationships.
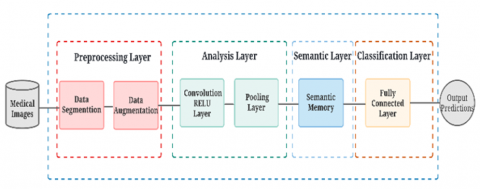
In this paper, we propose an approach based on the CNN algorithm enhanced by adding a semantic dimension via the semantics memory statistical method, which is presented in Figure 1. It allows analyzing a large number of medical images in order to classify lung cancer into two classes nodule, and non-nodule to obtain better results of analysis and prediction in terms of accuracy, AUC, and F-score.
The proposed approach consists of four main layers: The preprocessing layer, the analysis layer, the semantic layer, and the classification layer.
Figure 1. General architecture of our approach SCNN
3.1 Preprocessing layer
The preprocessing layer is a method used to reduce the search space, the image noise, and normalize data by removing regions of low intensity. In order to manage these anomalies and to detect regions of interest, we pre-process the 3D scans using segmentation techniques and data augmentation.
3.1.1 Data segmentation
The segmentation is a basic step in image processing which is based on the classification of objects. In the literature [38], the most used approaches to segment 3D images are the thresholding, the watersheds, and the clustering approach. On the one hand, clustering techniques have not led to better results in the segmentation process. On the other hand, the watershed technique has given good results but it is a lot time-consuming.
Therefore, we use the most frequently used thresholding method in the segmentation of the medical images because it is the most efficient technique to convert a multi-level image into a binary image by dividing its pixels into several zones using the definition of a certain threshold. This technique analyzes the context of the foreground image by removing the background of the image to reduce the complexity of the data and speed up the process of the segmentation; it does not need any prior information. It allows only lung tissue to be left to the classifier and ignores other parts to simplify image recognition and classification. However, candidate regions with nodules are located inside the lung, we hide data that makes our images noisy such as outside air, blood vessels, bones, and other normal anatomical structures.
The unit of measure for medical CT scans is the Hounsfield Unit (HU), which is a measure of the radiodensity. The thresholding method allows us to slice the image range of the scan between -1000 and +400 HU. If the radiodensity of the image is greater than the fixed threshold, the substances are not taken into consideration.
Table 1 shows the typical radiodensities of different parts of a CT scan with the different attenuation values of each tissue which is measured in HU [39, 40].
Table 1. HU radiodensities of different substances
|
Substances |
Radiodensity (HU) |
|
Air |
-1000 |
|
Lung |
-500 to -900 |
|
Fat |
-50 to -100 |
|
Water |
0 |
|
Cerebrospinal Fluid |
+15 |
|
Kidney |
+30 |
|
Blood |
+40 |
|
Muscle |
+10 to +40 |
|
Grey Matter |
+43 |
|
White Matter |
+46 |
|
Liver |
+40 to +60 |
|
Bone |
+1000 |
The bone radiodensity is around +1000 HU,
The blood, water, and other substances are around 0 HU,
The air radiodensity is around -1000 HU,
The lung tissue radiodensity is generally around -500 HU to -900 HU.
For this purpose, we hide the pixels of the image between -1000 HU and +400 HU to have only the lung tissue as the segment.
3.1.2 Data augmentation
Training a deep neural network on very few images is often a challenge: as the model only has access to a limited number of observations, it will tend to be overfitting. Overfitting refers to a position in which a model learns statistical irregularities of the training dataset by memorizing irrelevant noise instead of learning the signal. Thus, it negatively impacts the model performance over time.
In order to reduce overfitting, several methods have been proposed. Among these methods are batch normalization, regularization, random oversampling, and data augmentation, as well as architecture complexity reduction. The best method is to have more training data which will allow a better generalization, although this is not always feasible in medical imaging due to the lack of labeling of the data.
In order to remedy the overfitting problems, we opted for the technique of data augmentation [41]. Data augmentation is most often used when the data are represented by a set of images. For each observation, we create several variants. Thus, the data volume is artificially multiplied. The increase of data size consists of rotations, distortions, cropping, color changes, the addition of noises.
Despite this, we applied the data augmentation method by rotating the existing image a few degrees but we still have a class imbalance in our data. In order to solve this problem, we use random oversampling to duplicate the minority class samples at random and add them to the training dataset [42].
3.2 Analysis layer
This layer allows extracting the high-level features following the repeating pattern: the convolutional layer, the max-pooling layer, and the ReLu activation functions that are detailed in the next subsection.
3.2.1 Convolution layer
The convolution layer allows detecting the most important features of an image by extracting the features of the input. These features are learned using a convolution operation, which is in fact a linear mathematical operation involving the product of a set of weights called a window, filter, or kernel with the input image [43]. This operation produces a feature map which will be the input of the next layer and so on.
3.2.2 Pooling layers
The pooling layers are placed between successions of convolutional layers in the CNN architecture. It uses the max operation to spatially reduce the input data (width and height) without affecting the depth [44]. The maximum value of the part of the image covered by the filter is returned by the max operation while preserving all the important information of the image.
3.2.3 ReLu activation function
Rectified Linear Unit (ReLU) is a non-linear activation function most frequently used in CNN for learning complex relationships in data.
The advantage of the ReLU function is that it does not enable all the neurons to be activated at the same time. It only activates neurons, which have feature map values greater than a certain quantity. Otherwise, neurons will be disabled if the input values are less than zero and the output will be zero. The ReLU function is mathematically defined as [45]:
$f(x)=\max (0, x)$ (1)
Eq. (1) is linear for all positive values and zero for all negative values. Therefore, the ReLU function is better than the non-linear functions [46].
3.3 Semantics layer
The input of this layer is a set of feature vectors that will be connected to the Semantic Memory method.
The semantic Memory (also called Hyperspace Analogue to Language) was introduced by Lund and Burgess [16] to produce large-dimensional semantic spaces and group the neighboring words one beside the other.
The semantic Memory allows creating an n×n matrix of co-occurring where all the unique n words are defined in the form of rows and columns. It defines a sliding window size l, which is applied to these different words of size n by calculating a weighting l-d+1 with d that represents the distance between two words in the sliding window [47]. A co-occurrence matrix is generated after going through all the words and the union of the row with the column is represented to deduce the co-occurrence vectors.
The last step of this method calculates the distance between different pairs of vectors using the cosine similarity measure. When the magnitude of the vectors does not matter we use the cosine similarity as a metric to calculate the distance. It's a measure of similarity between two non-zero n-dimensional vectors in an internal product space that takes into account the measurement of the cosine of the angle between the vectors.
The cosine similitude helps to better understand the semantics of each vector. The vectors that have the same direction are considered as similar in the space; it is given by the following formula:
$\cos (\theta)=\frac{\vec{a} \cdot \vec{b}}{\|\vec{a}\|\|\vec{b}\|}$ (2)
$\cos (\theta)=\frac{\sum_{1}^{n} a_{i} b_{i}}{\sqrt{\sum_{1}^{n} a_{i}^{2}} \sqrt{\sum_{1}^{n} b_{i}^{2}}}$ (3)
where,
$\vec{a} \cdot \vec{b}=\sum_{1}^{n} a_{i} b_{i}=a_{1} b_{1}+a_{2} b_{2}+\cdots+a_{n} b_{n}$ is the product of vector α and vector b.
$\|\vec{a}\|\|\vec{b}\|=\sqrt{\sum_{1}^{n} a_{i}^{2}} \sqrt{\sum_{1}^{n} b_{i}^{2}}$ is the product of the lengths (or magnitudes) of the two vectors $\alpha$ and $b$.
The cosine similarity is advantageous, unlike the Euclidean distance that allows capturing the orientation of the vectors and not the magnitude. According to the cosine similarity, there is a small angle between two vectors if they are similar.
The last step allows sorting the feature vectors according to the similarity measure to have classified semantic vectors, which will be connected to the classification layer.
3.4 Classification layer
The classification layer is a fully connected layer (FC) that is used to classify the input images. It receives a semantic vector as input and produces a new vector as output [48]. These images will be smaller than the original inputs due to the image reductions made in the previous operations.
In this layer, we scan the reduced images and transform each of the values into a 1-D vector of a size N, where N corresponds to the class number of our binary classification problem. By assigning weights that are dependent on the image and the class, each element of the vector indicates the probability that the input image belongs to certain a class.
In order to calculate these probabilities, we multiply each image by weight then we apply the Sigmoid activation function; it is given by the following formula:
$f(x)=\frac{1}{1+e^{-x}}$ (4)
This activation function predicts output probabilities between a scale of [0, 1] in binary classification problems.
A significant role is played by datasets in the field of deep learning. The key advantage of DL is the ability to process and analyze massive amounts of data of different structures, which influence the performance of the model. For this, we evaluate our approach using the LUNA16 benchmark [49], which will be discussed in detail in the subsections that follow.
4.1 Dataset
The data contained in the LUNA16 dataset are collected from the LIDC-IDRI database [50] for analyzing the lung nodule. In the LUNA dataset, the radiologist annotators ignore nodules that have a radius greater than 3 mm. It consists of 888 CT scans with a total of 1186 lung nodules in MetaImage (mhd/raw) format. Each .mhd file is stored with a separate .raw binary file for pixel data.
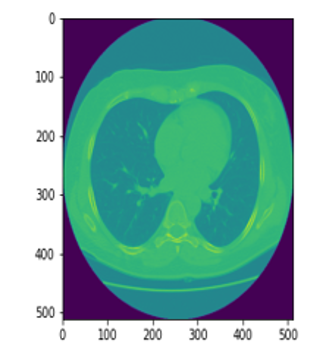
The images have a different resolution depending on the used scan with a size of (z, 512, 512) pixels where z is the number of slices in the scan greater than 2.5 mm. A slice of this image is presented in Figure 2.
Figure 2. Example of lung cancer nodules shown in a 2D slice of a CT scan
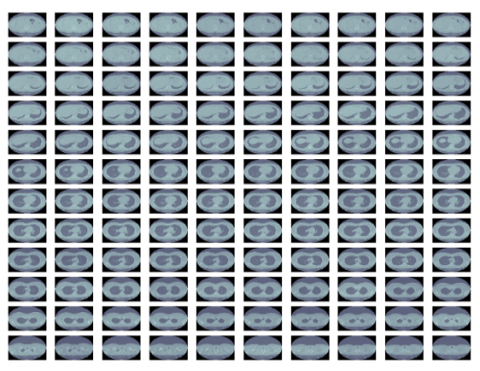
The 3D images contained in the LUNA dataset have multiple slices; each 3D image consists of several numbers of 2D images shown in Figure 3.
Figure 3. 3D image in the form of a succession of 120 slices 2D
4.2 Evaluation measures
To assess the quality and the performance of our approach, we used several metrics (like accuracy, specificity, sensitivity, precision, recall, and F-score) which are defined in Table 2.
Table 2. Metrics computed from confusion matrix
|
Metrics |
Formula |
|
Accuracy |
$\frac{\mathrm{TP}+\mathrm{TN}}{\mathrm{TP}+\mathrm{TN}+\mathrm{FP}+\mathrm{FN}}$ |
|
Specificity |
$\frac{\mathrm{TN}}{\mathrm{TN}+\mathrm{FP}}$ |
|
Sensitivity |
$\frac{T P}{F N+T P}$ |
|
Precision |
$\frac{\mathrm{TP}}{\mathrm{FN}+\mathrm{TP}}$ |
|
Recall |
$\frac{\mathrm{TP}}{\mathrm{FN}+\mathrm{TP}}$ |
|
F-score |
$2 \times \frac{\text { Precision } \times \text { Recall }}{\text { Precision }+\text { Recall }}$ |
Figure 4 represents the confusion matrix of our tests allowing the description of the complete performance of the classifications based on the test data representing the totality of 1836 nodules (918 nodules and 918 non-nodules).
The confusion matrix includes four base numbers that are used to define the classifier metrics. These four numbers are:
True Positive (TP): Represents the number of images that have been correctly classified to have nodules (patients that have lung cancer).
True Negative (TN): Represents the number of images correctly classified to have non-nodule (patients that do not have lung cancer).
False Positive (FP): Represents the number of misclassified images that should have nodules, but are actually classified to have non-nodule.
False Negative (FN): Represents the number of misclassified images that were predicted to have non-nodule but are actually classified to have nodules.
Figure 4. Confusion matrix in our test
4.3 Results and discussion
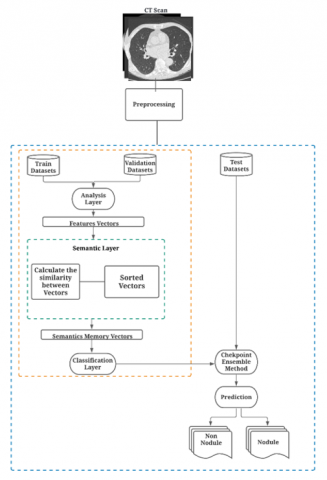
In this section, we evaluate the results of our approach using the LUNA16 benchmark (see Figure 5). Such images with a resolution of 512 x 512 cannot be introduced directly into a CNN architecture due to the high computational cost which leads to poor feature learning.
To this end, before introducing the data into the CNN architecture, we preprocessed the CT in order to locate the regions most likely to have lung cancer by segmenting the images with a threshold of -1000 to +400. Then, we used a CSV file to split the data into two sets: a set that contains nodules and another that does not contain nodules. The CSV file contains the list of candidate nodes, the x, y, and z positions of each candidate, and their corresponding class. After that, the data sets are divided into two sets, 80% for training data and 20% for validation data.
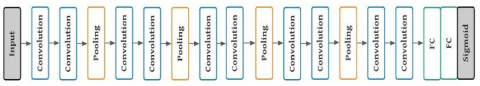
Figure 6 depicts the steps of the CNN algorithm that are used in our experimentations. The input to the algorithm was a set of images that were reduced to a size of [48, 48, 48]. Each hidden layer from the five layers contains two convolutional layers followed by a max-pooling layer.
We applied a RELU activation function Eq. (1) in the hidden layers and a Sigmoid activation function Eq. (4) for the last FC layer. The convolution layer consists of 16, 32, 64, 128, 256 filters for each hidden layer with the convolution kernel size of [3,3,3] and [5,5,5].
Figure 5. Semantic Convolutional Neural Network
In addition, the kernel size for max-pooling layers is [2,2,2] applied with a stride of 2 pixels, and the FC has an output with 1024 neurons.
Figure 6. Diagram of the CNN architecture
Our tests have been trained using cloud computing services offered by Google Colab pro with Deep Learning Tensorflow library (CPU: Intel(R) Xeon(R) CPU @ 2.20GHz; RAM: 25.46 GB; GPU: Tesla P100-PCIE-16GB with CUDA 11.2).
In order to determine the best architecture for the SCNN, several experiments have been conducted. The learning process was trained for 50 epochs and optimized by Adam’s algorithm [51] with a learning rate of 0.0001. Binary Cross-Entropy was used to train the model with a batch size of 64.
Table 3 describes the classification performance using four tests. In the first two tests, we used a CNN model with a filter size of [3,3,3], [5,5,5] respectively. In the last two tests, we used the SCNN model with a filter size of [3,3,3], [5,5,5] respectively.
Using a filter of [3,3,3], the proposed SCNN achieved better performance in our tests in terms of specificity of 99.12%, sensitivity of 95.42%, precision of 95.59%, recall of 99,13%, and accuracy of 97.27% for the classification of CT scans of lung cancer into the nodule and non-nodule classes.
On the other hand, the CNN model achieved a specificity of 91.06%, sensitivity of 87.25%, precision of 87.72%, recall of 91,07%, and accuracy of 89.16%. Similarly, the proposed SCNN obtained better performance results compared with the CNN model in terms of specificity, sensitivity, precision, recall, and accuracy using a filter of [5,5,5]. Therefore, our approach outperformed the CNN model on various tests of the LUNA dataset.
Table 3. Performance of our models with different kernel sizes
|
Model |
Kernel |
Specificity % |
Sensitivity % |
Precision % |
Recall % |
Accuracy % |
|
Test 1 (CNN) |
3x3x3 |
91.06 |
87.25 |
87.72 |
91.07 |
89.16 |
|
Test 2 (CNN) |
5x5x5 |
88.88 |
85.72 |
86.17 |
88.89 |
87.30 |
|
Test 3 (SCNN) |
5x5x5 |
94.55 |
92.81 |
92.93 |
94.55 |
93.86 |
|
Test 4 (SCNN) |
3x3x3 |
99.12 |
95.42 |
95.59 |
99.13 |
97.27 |
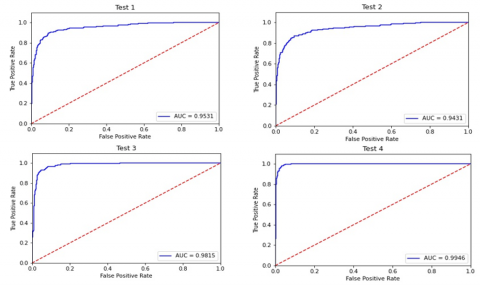
To further show the efficiency of our proposed model, we plotted the Receiver Operating Characteristic (ROC) curves depicted in Figure 7. The curve depicts the true positive rate (Sensitivity) versus the false positive rate (1-Specificity) to calculate the area under the curve (AUC). It also indicates the extent to which the model is able to distinguish between the two classes. In Figure 7, our approach achieved an AUC of 0.9531, 0.9431, 0.9815, and 0.9946 in test 1, test 2, test 3, and test 4, respectively. As the AUC values are between 0.94 and 1.0, the proposed model has a better diagnostic performance.
Figure 7. Receiver operating characteristic curve (ROC curve)
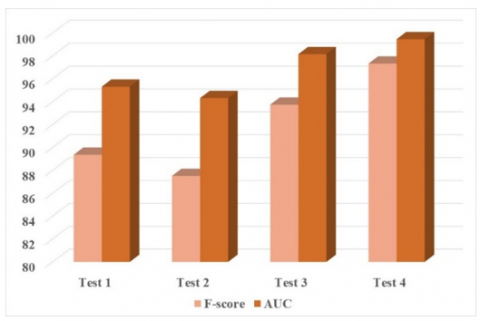
Another metric that is used in the evaluation of our approach is the F-score measure, which is a combination of both recall and precision metrics.
Figure 8 depicts the performance of the proposed technique in terms of F-score and AUC metrics. In test 4, the model achieved the highest F-score of 97.33% and AUC of 99.46%. In all tests, the F-score values are between 87% and 100%, which means that the performance of our approach is relatively stable over the different tests of the LUNA dataset.
Finally, we compare the performance of our approach with existing approaches, which have been tested using the LUNA and LIDC-IDRI datasets, with 2D and 3D images of both filter sizes 3 and 5.
Figure 8. Comparison of F-score and AUC values
Table 4 depicts a comparison between the proposed approach and the state-of-the-art approaches. In order to increase the comparability, we mentioned that the existing approaches evaluate the performance using both accuracy and AUC metrics.
We observe that several approaches in Refs. [52-54] have been evaluated using the LUNA dataset. Other approaches [54-57] have used the LIDC-IDRI dataset to evaluate their performances. Most of the existing approaches have used 3D images with a filter size [3,3,3] and [5,5,5] except for studies [54, 55, 57] which have used 2D images.
In our approach, we used 3D images since 3D CNN can encode richer spatial information from CT images to learn more distinguishable features of both filters [3,3,3] and [5,5,5]. As can be shown in Table 4, our approach provides a significant performance improvement with a filter size [5x5x5] between 6.55% and 15.15% of AUC compared to existing methods. Similarly, the proposed approach shows an improvement between 7.08% and 9.53% in accuracy compared to existing approaches. On the other hand, our approach also brings an important performance improvement between 2.36% and 12.46% of the AUC compared to existing approaches with a filter size [3x3x3]. In the same way, the proposed approach shows an improvement between 2.61% and 9.33% in accuracy compared to existing approaches.
In conclusion, our experiments show that the proposed approach effectively addressed the problem of big data analysis by adding the semantic dimension. However, this allowed the analysis of a large amount of unstructured data represented as medical images, which resulted in an improvement in the classification process in terms of accuracy, F-score, and AUC.
Table 4. Comparison of the proposed with other methods
|
Authors |
DataBase |
Samples |
CNN |
Filters |
Auc |
Accuracy (%) |
|
Song et al. [56] |
LIDC-IDRI |
5024 |
3D |
5x5x5 |
0.916 |
84.15 |
|
Alakwaa et al. [52] |
LUNA16 |
30% |
3D |
5x5x5 |
0.83 |
86.6 |
|
Our Approach (SCNN) |
LUNA16 |
1836 |
3D |
5x5x5 |
0.9815 |
93.68 |
|
Shen et al. [55] |
LIDC-IDRI |
1375 |
2D |
3x3 |
0.93 |
87.94 |
|
Monkem et al. [57] |
LIDC-IDRI |
2635 |
2D |
3x3 2x2 |
0.87 |
88.28 |
|
Banu et al. [54] |
LUNA16 |
460 |
2D |
3x3 |
0.971 |
91.32 |
|
Zhang et al. [53] |
LUNA16 |
1004 |
3D |
3x3x3 |
0.9563 |
91.67 |
|
Banu et al. [54] |
LIDC-IDRI |
409 |
2D |
3x3 |
0.9158 |
94.66 |
|
Our Approach (SCNN) |
LUNA16 |
1836 |
3D |
3x3x3 |
0.9946 |
97.27 |
In this paper, we have presented a deep learning approach for big data analysis using semantic technologies. Our approach used deep learning algorithms to analyze massive amounts of unstructured data. Moreover, we used the Convolutional Neural Network algorithm, which has proven to be quite successful for medical image recognition and classification. The semantic memory method's goal is to improve our findings and allow us to make better predictions. We tested our approach using data from the LUNA16 benchmark, which contained lung cancer CTs for a binary classification into nodule and non-nodule classes. The experimental study used the CNN and SCNN architectures. The two algorithms were tested with the same CNN architecture and the same hyperparameters. Hence, we obtained the highest accuracy and f-score with the SCNN algorithm. The results that are presented in this paper have shown that we have improved the process of data analysis by reducing the false positives and negatives.
The main drawback of our approach is the lack of the availability of large labeled medical data. In the future, we plan to use other similarity measures and semantic segmentation methods. Additionally, due to the limitation of labeled medical data and class imbalance, we will test other augmentation and transfer learning techniques. Furthermore, we will perform several experiments by modifying the network architecture and the hyper-parameters that define the network structure to further improve the results of our approach. So, we will implement this architecture in a real-time data analysis platform such as SPARK to improve processing and analysis time.
[1] Philip Chen, C.L., Zhang, C.Y. (2014). Data-intensive applications, challenges, techniques, and technologies: A survey on Big Data. Information Sciences, 275: 314-347. https://doi.org/10.1016/j.ins.2014.01.015
[2] Iqbal, R., Doctor, F., More, B., Mahmud, S., Yousuf, U. (2020). Big data analytics: Computational intelligence techniques and application areas. Technological Forecasting and Social Change, 153: 119253. https://doi.org/10.1016/j.techfore.2018.03.024
[3] Lee, I. (2017). Big data: Dimensions, evolution, impacts, and challenges. Business Horizons, 60(3): 293-303. https://doi.org/10.1016/j.bushor.2017.01.004
[4] Najafabadi, M.M., Villanustre, F., Khoshgoftaar, T.M., Seliya, N., Wald, R., Muharemagc, E. (2016). Deep learning techniques in big data analytics. Big Data Technologies and Applications, pp. 133-156. https://doi.org/10.1007/978-3-319-44550-2_5
[5] Palanisamy, V., Thirunavukarasu, R. (2019). Implications of big data analytics in developing healthcare frameworks – A review. Journal of King Saud University - Computer and Information Sciences, 31(4): 415-425. https://doi.org/10.1016/j.jksuci.2017.12.007
[6] Chen, X.W., Lin, X.T. (2014). Big data deep learning: Challenges and perspectives. IEEE Access, 2: 514-525. https://doi.org/10.1109/access.2014.2325029
[7] Gheisari, M., Wang, G., Bhuiyan, M.Z.A. (2017). A survey on deep learning in big data. 22017 IEEE International Conference on Computational Science and Engineering (CSE) and IEEE International Conference on Embedded and Ubiquitous Computing (EUC). https://doi.org/10.1109/cse-euc.2017.215
[8] Bouzidi, Z., Amad, M., Boudries, A. (2021). A survey on deep learning in big data and its applications. International Conference on Innovations in Energy Engineering & Cleaner Production IEECP’21. https://doi.org/10.6084/m9.figshare.14737953
[9] Rani, S., Kumar, A., Bagchi, A., Yadav, S., Kumar, S. (2021). RPL based routing protocols for load balancing in IoT network. Journal of Physics: Conference Series, 1950(1): 012073. https://doi.org/10.1088/1742-6596/1950/1/012073
[10] Krizhevsky, A., Sutskever, I., Hinton, G.E. (2017). ImageNet classification with deep convolutional neural networks. Communications of the ACM, 60(6): 84-90. https://doi.org/10.1145/3065386
[11] Zeiler, M.D., Fergus, R. (2014). Visualizing and understanding convolutional networks. Lecture Notes in Computer Science, pp. 818-833. https://doi.org/10.1007/978-3-319-10590-1_53
[12] Sajja, T.K., Kalluri, H.K. (2020). A deep learning method for prediction of cardiovascular disease using convolutional neural network. Revue d’Intelligence Artificielle, 34(5): 601-606. https://doi.org/10.18280/ria.340510
[13] Mohammadi, M., Al-Fuqaha, A., Sorour, S., Guizani, M. (2018). Deep learning for IoT big data and streaming analytics: A survey. IEEE Communications Surveys & Tutorials, 20(4): 2923-2960. https://doi.org/10.1109/comst.2018.2844341
[14] De Raad, K.B., van Garderen, K.A., Smits, M., van der Voort, S.R., Incekara, F., Oei, E.H.G., Starmans, M.P.A. (2021). The effect of preprocessing on convolutional neural networks for medical image segmentation. 2021 IEEE 18th International Symposium on Biomedical Imaging (ISBI). https://doi.org/10.1109/isbi48211.2021.9433952
[15] Khodaskar, A., Ladhake, S. (2015). Semantic image analysis for intelligent image retrieval. Procedia Computer Science, 48: 192-197. https://doi.org/10.1016/j.procs.2015.04.169
[16] Lund, K., Burgess, C. (1996). Producing high-dimensional semantic spaces from lexical co-occurrence. Behavior Research Methods, Instruments, & Computers 28: 203-208. https://doi.org/10.3758/bf03204766
[17] Taouli, A., Amar Bensaber, Djamel., Keskes, N., Bencherif, K., Hassan, B. (2018). Semantic for big data analysis: A survey. INTIS2018: BigData & Internet of Things IoT, Marrakech, Maroc.
[18] Kaisler, S., Armour, F., Espinosa, J.A., Money, W. (2013). Big data: Issues and challenges moving forward. 2013 46th Hawaii International Conference on System Sciences. https://doi.org/10.1109/hicss.2013.645
[19] Taouli, A., Bensaber, D. A., Keskes, N. Bencherif, K. (2018). Semantic classification for big data analysis. Revue des Nouvelles Technologies de l’Information Business Intelligence Big Data, RNTI-B-14, pp. 273-280.
[20] Berat Sezer, O., Dogdu, E., Ozbayoglu, M., Onal, A. (2016). An extended IoT framework with semantics, big data, and analytics. 2016 IEEE International Conference on Big Data (Big Data). https://doi.org/10.1109/bigdata.2016.7840803
[21] Jabbar, S., Ullah, F., Khalid, S., Khan, M., Han, K. (2017). Semantic interoperability in heterogeneous IoT infrastructure for healthcare. Wireless Communications and Mobile Computing, 2017: 1-10. https://doi.org/10.1155/2017/9731806
[22] Rinaldi, A.M., Russo, C. (2018). A semantic-based model to represent multimedia big data. Proceedings of the 10th International Conference on Management of Digital EcoSystems. https://doi.org/10.1145/3281375.3281386
[23] Barba-González, C., García-Nieto, J., Roldán-García, M. del M., Navas-Delgado, I., Nebro, A.J., Aldana-Montes, J.F. (2019). BIGOWL: Knowledge centered big data analytics. Expert Systems with Applications, 115: 543-556. https://doi.org/10.1016/j.eswa.2018.08.026
[24] Shakhovska, N., Fedushko, S., Greguš ml., M., Melnykova, N., Shvorob, I., Syerov, Y. (2019). Big data analysis in development of personalized medical system. Procedia Computer Science, 160: 229-234. https://doi.org/10.1016/j.procs.2019.09.461
[25] Castillo-Zúñiga, I., Luna-Rosas, F.J., Rodríguez-Martínez, L.C., Muñoz-Arteaga, J., López-Veyna, J.I., Rodríguez-Díaz, M.A. (2020). Internet data analysis methodology for cyberterrorism vocabulary detection, combining techniques of big data analytics, NLP and semantic web. International Journal on Semantic Web and Information Systems, 16(1): 69-86. https://doi.org/10.4018/ijswis.2020010104
[26] Berges, I., Ramírez-Durán, V.J., Illarramendi, A. (2021). A semantic approach for big data exploration in Industry 4.0. Big Data Research, 25: 100222. https://doi.org/10.1016/j.bdr.2021.100222
[27] Wu, L.T., Lin, J.R., Leng, S., Li, J.L., Hu, Z.Z. (2022). Rule-based information extraction for mechanical-electrical-plumbing-specific semantic web. Automation in Construction, 135: 104108. https://doi.org/10.1016/j.autcon.2021.104108
[28] Tran, K., He, X., Zhang, L., Sun, J. (2016). Rich image captioning in the wild. 2016 IEEE Conference on Computer Vision and Pattern Recognition Workshops (CVPRW). https://doi.org/10.1109/cvprw.2016.61
[29] Burel, G., Saif, H., Fernandez, M., Alani, H., (2017). On semantics and deep learning for event detection in crisis situations. Presented at the Workshop on Semantic Deep Learning (SemDeep), at ESWC 2017, Portoroz, Slovenia.
[30] Zheng, T., Gao, Y., Wang, F., Fan, C., Fu, X., Li, M., Ma, H. (2019). Detection of medical text semantic similarity based on convolutional neural network. BMC Medical Informatics and Decision Making, 19(1). https://doi.org/10.1186/s12911-019-0880-2
[31] Roccetti, M., Delnevo, G., Casini, L., Salomoni, P. (2020). A cautionary tale for machine learning design: Why we still need human-assisted big data analysis. Mobile Networks and Applications, 25(3): 1075-1083. https://doi.org/10.1007/s11036-020-01530-6
[32] Lin, Y., Kang, M., Wu, Y., Du, Q., Liu, T. (2019). A deep learning architecture for semantic address matching. International Journal of Geographical Information Science, 34(3): 559-576. https://doi.org/10.1080/13658816.2019.1681431
[33] Ahmed, L., Iqbal, M.M., Aldabbas, H., Khalid, S., Saleem, Y., Saeed, S. (2020). Images data practices for semantic segmentation of breast cancer using deep neural network. Journal of Ambient Intelligence and Humanized Computing. https://doi.org/10.1007/s12652-020-01680-1
[34] Yechuri, P.K., Ramadass, S. (2021). Semantic web mining for analyzing retail environment using Word2Vec and CNN-FK. Ingénierie des Systèmes d’Information, 26(3): 311-318. https://doi.org/10.18280/isi.260308
[35] Alam, M., Wang, J.F., Guangpei, C., Yunrong, L., Chen, Y. (2021). Convolutional neural network for the semantic segmentation of remote sensing images. Mobile Networks and Applications, 26(1): 200-215. https://doi.org/10.1007/s11036-020-01703-3
[36] Du, H., Hu, H., Wang, D., Xie, X., Xu, S., Wei, C., Gao, H. (2022). Autonomous measurement and semantic segmentation of non-cooperative targets with deep convolutional neural networks. Journal of Ambient Intelligence and Humanized Computing. https://doi.org/10.1007/s12652-021-03553-7
[37] Guo, J. (2022). Deep learning approach to text analysis for human emotion detection from big data. Journal of Intelligent Systems, 31(1): 113-126. https://doi.org/10.1515/jisys-2022-0001
[38] Masood, S., Sharif, M., Masood, A., Yasmin, M., Raza, M. (2015). A survey on medical image segmentation. Current Medical Imaging Reviews, 11(1): 3-14. https://doi.org/10.2174/157340561101150423103441
[39] Kalra, A. (2018). Developing FE human models from medical images. Basic Finite Element Method as Applied to Injury Biomechanics, 389-415. https://doi.org/10.1016/b978-0-12-809831-8.00009-x
[40] Backer, I., Vos, I., Vanderveken, O., Devolder, D., Braem, M., van Dyck, D., Backer, W. (2022). Combining MIMICS and Computational Fluid Dynamics (CFD) to assess the efficiency of a Mandibular Advancement Device (MAD) to treat Obstructive Sleep Apnea (OSA).
[41] Shorten, C., Khoshgoftaar, T.M. (2019). A survey on image data augmentation for deep learning. Journal of Big Data, 6(1). https://doi.org/10.1186/s40537-019-0197-0
[42] Mohammed, R., Rawashdeh, J., Abdullah, M. (2020). Machine learning with oversampling and undersampling techniques: Overview study and experimental results. 2020 11th International Conference on Information and Communication Systems (ICICS). https://doi.org/10.1109/icics49469.2020.239556
[43] Devendran, M., Rajendran, I., Ponnusamy, V., Marur, D.R. (2021). Optimization of the convolution operation to accelerate deep neural networks in FPGA. Revue d'Intelligence Artificielle, 35(6): 511-517. https://doi.org/10.18280/ria.350610
[44] Palakodati, S.S.S., Chirra, V.R., Dasari, Y., Bulla, S. (2020). Fresh and rotten fruits classification using CNN and transfer learning. Revue d'Intelligence Artificielle, 34(5): 617-622. https://doi.org/10.18280/ria.340512
[45] Patterson, J., Gibson, A., (2017). Deep learning: A practitioner’s approach. O’Reilly Media, Inc.
[46] Singhal, A., Phogat, M., Kumar, D., Kumar, A., Dahiya, M., Shrivastava, V.K. (2022). Study of deep learning techniques for medical image analysis: A review. Materials Today: Proceedings. https://doi.org/10.1016/j.matpr.2022.01.071
[47] Song, D., Bruza, P., Cole, R., (2004). Concept learning and information inferencing on a high-dimensional semantic space. ACM SIGIR 2004 Workshop on Mathematical/Formal Methods in Information Retrieval (MF/IR'2004.
[48] Beysolow II, T. (2017). Convolutional Neural Networks (CNNs). Introduction to Deep Learning Using R, 101-112. https://doi.org/10.1007/978-1-4842-2734-3_5
[49] LUNA16 - Grand Challenge “Lung nodule analysis 2016”. https://luna16.grand-challenge.org/, accessed on Feb.16., 2022.
[50] Armato, S.G., McLennan, G., Bidaut, L., McNitt-Gray, M.F., Meyer, C.R., Reeves, A.P., Hoffman, E.A. (2011). The Lung Image Database Consortium (LIDC) and Image Database Resource Initiative (IDRI): A completed reference database of lung nodules on CT scans. Medical Physics, 38(2): 915-931. https://doi.org/10.1118/1.3528204
[51] Kingma, D.P., Ba, J., (2014). Adam: A Method for Stochastic Optimization. arXiv:1412.6980.
[52] Alakwaa, W., Nassef, M., Badr, A. (2017). Lung cancer detection and classification with 3D Convolutional Neural Network (3D-CNN). International Journal of Advanced Computer Science and Applications, 8(8). https://doi.org/10.14569/ijacsa.2017.080853
[53] Zhang, G., Yang, Z., Gong, L., Jiang, S., Wang, L., Zhang, H. (2020). Classification of lung nodules based on CT images using squeeze-and-excitation network and aggregated residual transformations. La Radiologia Medica, 125(4): 374-383. https://doi.org/10.1007/s11547-019-01130-9
[54] Banu, S.F., Sarker, M.M.K., Abdel-Nasser, M., Puig, D., Raswan, H.A. (2021). AWEU-Net: An attention-aware weight excitation U-net for lung nodule segmentation. Applied Sciences, 11(21): 10132. https://doi.org/10.3390/app112110132
[55] Shen, W., Zhou, M., Yang, F., Yu, D., Dong, D., Yang, C., Tian, J. (2017). Multi-crop Convolutional Neural Networks for lung nodule malignancy suspiciousness classification. Pattern Recognition, 61: 663-673. https://doi.org/10.1016/j.patcog.2016.05.029
[56] Song, Q., Zhao, L., Luo, X., Dou, X. (2017). Using deep learning for classification of lung nodules on computed tomography images. Journal of Healthcare Engineering, 2017: 1-7. https://doi.org/10.1155/2017/8314740
[57] Monkam, P., Qi, S., Xu, M., Han, F., Zhao, X., Qian, W. (2018). CNN models discriminating between pulmonary micro-nodules and non-nodules from CT images. BioMedical Engineering OnLine, 17(1). https://doi.org/10.1186/s12938-018-0529-x