Qiang Guo | Guannan Fu* | Lemei Li
© 2020 IIETA. This article is published by IIETA and is licensed under the CC BY 4.0 license (http://creativecommons.org/licenses/by/4.0/).
OPEN ACCESS
This paper attempts to improve the utilization efficiency of online building data in the age of big data. Focusing on data-driven building design innovation, the authors created an innovation strategy generation method for building design based on the optimization algorithm for dynamic sorting of extension set. Firstly, online building cases were captured by data acquisition software, and processed into a building case library (BCL). Next, the sorting algorithm and operation mechanism of building cases were optimized by setting up a transform mechanism for building problems and query conditions, preliminary screening of building cases based on correlation function, dynamic sorting of building cases based on extension set, etc. Finally, the innovation strategies for building design were automatically generated from the BCL, and the main factors affecting the case sorting were corrected in detailed. The case study shows that our method has high operability, improves the ability of architects to make scientific decisions based on online data, and thus promotes the innovation of computer-aided building design.
building design innovation, innovation strategy generation, dynamic sorting of extension set, online data, building case library (BCL)
In the era of big data, architects are striving to innovate building designs through intelligent use of online data. To realize the innovation, it is necessary to sort building case library (BCL) in an efficient and dynamic manner, and automatically generate building designs based on the sorted data. After all, every excellent building case is the crystallization of the knowledge and experience accumulated by architects in solving building design problems.
So far, many scholars have explored the BCL and its sorting algorithm. For instance, teachers and students from Georgia Institute of Technology designed a BCL called Archie II, which offers interest cases in the past for building design problems. Lin [1, 2] investigated the BCL from multiple perspectives, including the design of the BCL, knowledge discovery based on building cases, case retrieval based on spatial topology, case retrieval based on semantic ontology, and case retrieval based on the combination of semantic ontology and spatial topology. Krauß et al. [3] developed the pART workbench, on which architects can touch on the screen and realize mixed query of cases based on building plans. Ayzenshtadt et al. [4, 5] proposed a case-based semantic retrieval method based on case reasoning and multi-agent system (MAS). In addition to setting up a BCL, Meng [6] presented a method for building scheme retrieval and reuse based on case reasoning. Shen et al. [7] integrated text mining (TM) and case-based reasoning (CBR), enabling designers to query for the most similar cases during the design of new green buildings. Based on multidimensional correlation function, Zhao et al. [8] put forward a dynamic classification method for low-carbon product designs. Sabri et al. [9] designed a relatively mature BCL with the aid of five techniques: graph query, semantic query, case reasoning, accurate graph matching and inaccurate graph matching.
However, the above studies have three common defects: (1) Most of them focus on the design of local BCLs and case sorting algorithms, failing to tackle online building cases. (2) There is a lack of transform mechanisms for building design problems and query conditions. (3) The existing case sorting algorithms are not sufficiently efficient. If the BCL is relatively large, the algorithms may produce lots of results and make inflexible sorting, such that some excellent building cases will be excluded from the query results.
The extension set theory, an important instrument of extenics, can quantify the transform between yes and no [10-13]. This theory is suitable for retrieval behavior analysis of building users, and the dynamic evaluation of building cases. To make efficient use of online building data, this paper puts forward an innovation strategy generation method for building design based on the optimization algorithm for dynamic sorting of extension set. The proposed method promotes the innovation of computer-aided building design.
Based on extension set, our innovation strategy generation method for building design can automatically generate an innovation strategy for building design through the transform of building design problems, preliminary screening of building cases based on correlation function, and dynamic storing of building cases based on extension set.
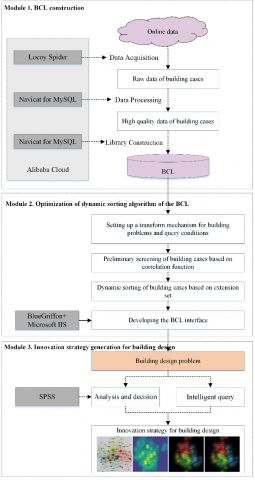
As shown in Figure 1, our strategy consists of three modules: BCL construction (Module 1), optimization of dynamic sorting algorithm of the BCL (Module 2), and innovation strategy generation for building design (Module 3). In Module 1, online building cases are captured by LocoySpider, and processed to form a BCL. In Module 2, the dynamic sorting algorithm is optimized by the extension set theory; In Module 3, the innovation strategy for building design is generated from the BCL.
Figure 1. Our innovation strategy generation method for building design based on extension set
2.1 BCL construction
The building case is the collective name of the knowledge, experience, and design strategies that architects have accumulated or developed in solving building design problems. On a webpage, a building case is presented in the form of building plan, design text, building drawings, images, models, photos, and videos. The specific features of a building case are listed in Table 1.
To facilitate temporal analysis, the architect should collect both the latest published cases and the past data (e.g. building comments). The collected data must be pertinent, broad, and typical.
Table 1. Features of a building case
|
Building source |
Building overview |
Building comments |
Building images |
|
Project website; release data; collection date |
Project number; project name; project type; renovation and extension type; construction location; completion time; design company; architect; height category; building materials; site type; site area; total building area; base area; floor area ratio; green space ratio; parking space; project introduction |
Number of views; comments; number of favorites; number of likes; number of reposts; comment contents |
Image name; image category; image theme |
Note: The architect can determine the features of a building case according to the contents of the webpage and his/her own needs.
Cloud computing greatly simplifies the operations of architects, thanks to its stable network environment, preset function modules, and low economic cost [14, 15]. For dynamic update of the BCL, LocySpider and MySQL were installed on Alibaba Cloud [16], and a detailed plan was prepared to collect data daily and update the BCL early every morning. The data were collected in the following steps:
Step 1. Based on the distribution of URLs, the rules for URL collection are designed, and used to acquire all URLs.
Step 2. The general features (e.g. project name, project type, completion time, and total building area) have already been extracted, and displayed at the top or bottom of the webpage. The architect needs to observe the distribution law of each feature in Table 1, and set up the corresponding collection rules.
Step 3. Many features hidden in the text description of the project have not been extracted in advance. For these features, the language habits of the architect are analyzed before listing as many rules as possible.
Step 4. The building comments can be divided into comment contents and relevant indices. Comment contents reflect the users’ recognition of the building case. With the aid of sentiment analysis software, the sentiment of comment contents is categorized automatically into three types: positive, neutral, and negative. Relevant indices fall into two categories: focus indices (e.g. number of views, and number of comments) and recognition indices (e.g. number of favorites, number of likes, and number of reposts).
Step 5. The data export rules are set up, and used to automatically import the collected data to MySQL database.
Data processing mainly solves the redundancy, missing, and format inconsistency of the collected data [17]. The redundant data are eliminated by the duplication check function of MySQL database, which can detect duplicate URLs in the collected data and delete duplicate items. The missing data, the result of failing to extract all the building features, are deduced from other features, padded with global constants, filled with central metrics, or supplemented manually. The inconsistent formats are unified by setting up conversion tables, namely, geographic location-latitude and longitude conversion table, Chinese and English conversion table, synonyms conversion table, and measurement unit conversion table. Through data processing, the architect can turn the messy original data into orderly, high-quality building data.
To sum up, this paper establishes a BCL from four perspectives (i.e. conceptual design, logical design, functional design, and database operation and maintenance) based on MySQL database and Navicat for MySQL, and thus ensures data stability [18].
2.2 Optimization of dynamic sorting algorithm of the BCL
2.2.1 Setting up a transform mechanism for building problems and query conditions
The starting point of building design is to identify the constraints stemming from the objectives and current conditions of the project. These constraints must be highlighted in the query for building cases.
The query conditions cover two main aspects: the building overview and the keywords. The former ensures that the found cases have a similar overview to the current project; the latter ensures that the found cases face the same difficulties as the current project.
Take the construction of a middle school next to a light rail station for example. There is a conflict between the noise generated by the station and the quiet learning environment required by the middle school. Thus, the building problem can be transformed into: setting the “construction type” in the query conditions to “educational building” (or any other building type that require a quite environment), and including “noise” or its synonyms in the keywords.
During retrieval, the system automatically expands keywords into synonym sets through divergence analysis of extenics, and then matches the synonyms with the project introduction. In this way, much fewer excellent building cases will be missed. The principle of divergence analysis is as follows:
Taking each keyword as a primitive, multiple primitives are extended from each primitive. The set of primitives extended from the same primitive must be non-empty:
$\begin{aligned} B &=\left(\begin{array}{llll}O, & c, & v\end{array}\right) \\ & \dashv\left\{\left(\begin{array}{lll}O, & c_{1}, & v_{1}\end{array}\right),\left(\begin{array}{lll}O, & c_{2}, & v_{2}\end{array}\right), \ldots,\left(O, c_{n}, v_{n}\right)\right\} \\ &=\left\{\left(\begin{array}{lll}O, & c_{i,} & v_{i}\end{array}\right), i=1,2, \ldots, n\right\} \end{aligned}$
e.g.
$B=$Noise$\dashv\{\text {Noise din noisy rackety..}\}$
2.2.2 Preliminary screening of building cases based on correlation function
In extenics, the correlation function indicates the degree to which things have a certain attribute. During the preliminary screening of building cases, the correlation function is adopted to calculate the similarity between the cases in the BCL and the query conditions, i.e. how much the building cases meet the query needs of the architect.
(1) Correlation degree of numeric features
Numeric features are calculated by a simple correlation function. The query condition is usually the numerical range. For example, the optimal range of floor area ratio is [0.5, 2], and the ideal value (the optimal value) is 1. Considering the scalability of the query, the acceptable interval for floor area ratio is generally set to [0.45, 2.05]. There are six typical situations of case retrieval, which can be solved by the following algorithms [10]:
(a) If the positive domain is a finite interval X=<a,b>, and the optimal point MÎX, then the correlation function can be expressed as:
$k(x)=\left\{\begin{array}{ll}\frac{x-a}{M-a}, & x \leq M; \\ \frac{b-x}{b-M}, & x \geq M .\end{array}\right.$ (1)
Algorithm (1) is suitable for case features, whose optimal values fall into a certain query interval. For example, if the architect needs to query for cases with a total building area of 4,000m2, he/she can set the query interval to <3,500, 4,500>, with 4,000 as the optimal value.
(b) If the positive domain is a finite interval X=<a,+∞>, and the optimal point MÎX, then the correlation function can be expressed as:
$k(x)=\left\{\begin{array}{ll}\frac{x-a}{M-a}, & x \leq M; \\ \frac{M}{2 x-M}, & x \geq M .\end{array} \right.$ (2)
Algorithm (2) is suitable for case features, which meet the minimum query value and have an optimal value. For example, if the architect needs to query for cases with a green space ratio of 30%, he/she can set the query interval to <25%, ∞>, with 30% as the optimal value.
(c) If the positive domain is a finite interval X=<-∞,b>, and the optimal point MÎX, then the correlation function can be expressed as:
$k(x)=\left\{\begin{array}{ll}\frac{M}{2 M-x}, & x \leq M ; \\ \frac{x-b}{M-b}, & x \geq M .\end{array}\right.$ (3)
Algorithm (3) is suitable for case features, which meet the maximum query value and have an optimal value. For example, if the architect needs to query for cases with a floor area ratio of 2, he/she can set the query interval to <-∞, 2.5>, with 2 as the optimal value.
(d) If the positive domain is a finite interval X=<-∞,+∞>, and the optimal point MÎX, then the correlation function can be expressed as:
$k(x)=\left\{\begin{array}{ll}\frac{1}{1+M-x}, & x \leq M ; \\ \frac{1}{x+1-M}, & x \geq M .\end{array}\right.$ (4)
Algorithm (4) is suitable for case features, which have an optimal value by which the cases in the BCL are sorted. For example, if the architect needs to query for cases with a total building area of 4,000m2, he/she can set the optimal value to 4,000, calculate the similarity of each case in the BCL to 4,000, and sort the cases by the similarity.
(e) If the value range is a finite interval <a,b], and the positive domain is X=<a1,b] (a1≥a, and b is the optimal point), the correlation function can be expressed as:
$k(x)=\frac{x-a_{1}}{b-a}$ (5)
Algorithm (5) has one more constraint than the above algorithms. It is suitable for expressing numerical features transformed from time features. For example, if the architect needs to query for the latest building cases, he/she can set the query conditions as “the past five years”, with “the past three years; the closer, the better” as the optimal condition.
(f) If the value range is a finite interval [a,b>, and the positive domain is X=<a,b1] (b1≤b, and a is the optimal point), the correlation function can be expressed as:
$k(x)=\frac{b_{1}-x}{b-a}$ (6)
Algorithm (6) has one more constraint than Algorithms (1)-(4). For example, if the architect needs to query for the cases with green space ratio no lower than 35%, he/she can set the query conditions as “[35%, 45%]”, with “[35%, 40%]; the closer to 35%, the better” as the optimal condition.
(2) Correlation degree of time features
The time features are usually stored in the form of “year-month-day”, e.g. “2013-02-14”. During the query for a building case, the time feature is often positively corelated with the design level of the building. These features should be transformed into numerical features, to compute the correlation between the completion time and query time. First, all time features should be transformed into the form of year by “year.(month-1)/12”. Hence, “2013-02-14” should be rewritten as “2013.08”. After the transform, the features can be processed by the correlation functions for numerical features.
(3) Correlation degree of location features
The location features are usually expressed in the form of state, country, province, city, etc., such as the construction location. The architect should convert these features into latitudes and longitudes, and calculate the correlation degree based on the actual distance. For example, “Ningbo City” should be converted into “28°51′-30°33′N; 120°55′- 122°16′E”.
(4) Correlation degree of nominal features
The calculation degree of nominal features cannot be calculated directly. However, these features are critical to the similarity calculation of buildings. Here, the correlation degree of such features is computed by Wu and Palmer’s calculation method for concept similarity based on node distance [19]:
$k(x,y)=\left\{ \begin{matrix} \frac{2\times depth(Msc(x,y))}{Dis(x,y)+2\times depth(Msc(x,y))}, & x\ne y \\ 1, & x=y \\\end{matrix} \right.$ (7)
where, Msc(x,y) is the nearest parent node to two concepts x and y; Dis(x,y) is the shortest distance between the two concepts (the minimum number of nodes on the path from x to y.); depth(Msc(x,y)) is the depth of the nearest parent node in the tree structure (the number of nodes from the parent node to the root node).
(5) Correlation degree of ordinal features
The features should be transformed into numerical features based on their ranks. For example, the four levels of building fire rating, I, II, III, and IV, can be converted into numbers 1, 2, 3, and 4, respectively, and then processed by the correlation functions for numerical features.
(6) Composite correlation degree
Multiple features are often involved in the calculation of case similarity. The weight of each feature should be assigned by architects or construction experts. Suppose λ1, λ2, …, λm, are the weight coefficients of features c1, c2, …, cm, respectively, and satisfy $\sum_{i=1}^{m} \lambda_{i}=1$. The composite correlation degree between building cases can be calculated by:
$K(B)=\sum_{i=1}^{m} \lambda_{i} k_{i}\left(c_{i}(B)\right)=\sum_{i=1}^{m} \lambda_{i} k_{i}\left(x_{i}\right)$ (8)
2.2.3 Dynamic sorting of building cases based on extension set
The previous reports on case sorting often overlook the positive impact of architect’s retrieval behavior on the evaluation of case quality. To realize scientific sorting and dynamic evaluation of building cases, this paper quantifies the transform of things based on the extension set theory, and analyzes the retrieval behavior of architects. The basic principle is explained below:
Let U be the BCL, u be any case in U, k be a mapping from U to the real domain $\Re$, and T is a given transform. Then, an extension set on universe U [10] can be defined as:
$\tilde{E}(T)=\left\{\begin{array}{l}\left(u, y, y^{\prime}\right) | u \in U, y=k(u) \in\Re ; \\ y^{\prime}=T_k k(u)\end{array}\right\}$ (9)
where, y=k(u) and y’=Tkk(u) are the correlation function and extension function of $\tilde{E}(T)$, respectively.
If T=e, then the positive extension domain or positive qualitative change domain of $\tilde{E}(T)$ can be defined as:
$E+(T)=$$\left\{\left(u, y, y^{\prime}\right) | u \in U, y=k(u) \leq 0 ; \quad y^{\prime}=T_{k} k(u)>0\right\}$
During the current and subsequent evaluation periods, if the correlation degree of a case changes from negative to positive, then the case is strongly attractive.
The negative extension domain or negative qualitative change domain of $\tilde{E}(T)$ can be defined as:
$E-(T)=$$\left\{\left(u, y, y^{\prime}\right) | u \in U, y=k(u) \geq 0 ; \quad y^{\prime}=T_{k} k(u)<0\right\}$
During the current and subsequent evaluation periods, if the correlation degree of a case changes from positive to negative, then the case is strongly unattractive.
The positive stable domain or positive quantitative change domain of $\tilde{E}(T)$ can be defined as:
$E+(T)=$$\left\{\left(u, y, y^{\prime}\right) | u \in U, y=k(u)>0 ; \quad y^{\prime}=T_{k} k(u)>0\right\}$
During the current and subsequent evaluation periods, if the check frequency of a case increases from the already high level, then the case is slightly attractive.
The negative stable domain or negative quantitative change domain of $\tilde{E}(T)$ can be defined as:
$E-(T)=$$\left\{\left(u, y, y^{\prime}\right) | u \in U, y=k(u)<0 ; \quad y^{\prime}=T_{k} k(u)<0\right.$
During the current and subsequent evaluation periods, if the check frequency of a case decreases from the already low level, then the case is slightly unattractive.
The extension boundary of $\tilde{E}(T)$, i.e. the critical state of the above situations, can be defined as:
$E_{0}(T)=\left\{\left(u, y, y^{\prime}\right) | u \in U, y^{\prime}=T_{k} k(u)=0\right\}$
By the above definitions, the extension set describes the mutual transform between yes and no of building cases. It not only reflects the quantitative change (stable domain), but also illustrates the qualitative change (extension domain). The extension boundary is the limit of qualitative change. Beyond this boundary, building cases will undergo qualitative change.
For the retrieval behavior of the architect, the correlation between the evaluation values of a building case in the current and subsequent evaluation periods was defined as the correlation degree y, and the transform that causes the two evaluation values to change was defined as T. Then, the check frequency f of building case u in an evaluation period can be normalized by min-max method by:
$y=k(u)=2\left(f-f_{\min }\right) /\left(f_{\max }-f_{\min }\right)-1$ (10)
In this way, the building cases that meet the query conditions can be divided into the above five domains. Considering the increase/decrease of check frequency in positive/negative quantitative change domain, the dynamic evaluation results of building cases were divided into seven levels corresponding to the seven domains: positive qualitative change domain and positive quantitative change domain (increased correlation), positive quantitative change domain (decreased correlation), negative qualitative change domain, negative quantitative change domain (increased correlation), negative quantitative change domain (decreased correlation), and zero domain.
Based on weights, the correlation degrees and levels of building cases were summed up into the final evaluation result of case evaluation, laying the basis for case sorting.
2.2.4 Developing the BCL interface
To realize efficient retrieval of building cases and innovation strategies, in-depth design was carried out for important functions of the BCL, including online data acquisition, data analysis and processing, data format conversion, and data storage and query. The query interface of the BCL (Figure 2) was developed based on BlueGriffon v3.0.1, Microsoft IIS7.0 [20], and JSP10 [21].
Figure 2. The query interface of the BCL
Compared with the traditional interface of case query systems, the proposed query interface supports the query by strategy information, in addition to the queries by basic information and image information. With such a query interface, the architect can draw inspirations from a wide range of design cases.
On the query for innovation strategy, the subitems include type of design conflict, type of innovation strategy, design keywords, design theme, and type of building function. The architect could implement quick and advanced queries based on relevance, innovation heat, and other specified features. Among them, the relevance is the result of dynamic sorting of cases based on extension set.
The query results could be displayed in one of three modes: abstract preview, list preview, and thumbnail preview. To meet the actual needs of the architect, the results are presented in different sequences, depending on the query mode. If the query is performed based on strategy information, the analysis drawings reflecting strategy innovation will be displayed first, followed by the general plans and relevant technical drawing of the cases.
2.3 Innovation strategy generation for building design
Architectural studies aim to summarize the experience of construction activities, reveal the laws and methods of construction, and create material forms and spatial environments that cater to the needs of our life and aesthetics [22]. Building design innovation is the process where architects break through existing thinking patterns, and improve or create things, elements, methods and means. Our query method performs intelligent analysis on the retrieval behavior, providing architects with lots of excellent building cases. By our method, architects can extract useful strategies from building cases based on extenics. The specific solution is detailed by Lian [23], which covers innovation problem modelling, extension analysis, extension transform, strategy priority evaluation, etc.
Once obtained, the multiple strategies for building design should be further summarized and analyzed, forming figures and tables of innovation strategies. Based on these figures and tables, the key factors affecting the case sorting should be corrected in four steps: factor pool construction and questionnaire survey; reliability test and suitability analysis; principal component extraction; classification and analysis of influencing factors. These steps will be illustrated with an actual example in the case study. The figures and tables provide insights into the trend of building design innovation in a certain field, enabling architects to finalize their building schemes.
Upon receiving a design task, the architect must first consider the site conditions and the relationship between the building and the surrounding environment. Site conflicts are common in building design. A new building might conflict with the following objects in its surroundings: traditional blocks and historical buildings, ecologically sensitive areas, high-density urban areas, and industrial heritage. The success of building design hinges on the transform of these conflicts into an innovation strategy.
Suppose the architect is entrusted with the task to design of a natural museum near an ecologically sensitive area. Then, he/she needs to query for similar cases and design an innovation strategy on our system in four steps:
Step 1. Define the types of conflicts in museum design.
The design problem was divided into the current condition and the construction objective. The current condition is the proximity to the ecological sensitive area, while the construction objective is to minimize the environmental impact of the new building, and integrate the new building into the environment.
Step 2. Set up the case query conditions.
First, the design conflict was defined as a single-objective conflict. Then, “natural integration”, “smart borrowing”, and “ecologically sensitive region” were chosen as the keywords. Finally, building function was set as “museum”, while the type of strategy innovation was set as “design method”.
Step 3. Select site design mode and retrieve relevant building cases.
Under this mode, thumbnails are presented in the order of general plans, analysis graphs, and perspective drawings. Besides case title and basic information, the key design strategies are displayed on the left of the case images based on their relevance to the keywords. The cases are sorted in default by the heat of retrieval (Figure 3).
Figure 3. Cases retrieved under the strategy generation mode
Step 4. Generation of site design strategies and correction of factors affecting case sorting.
Based on extenics, useful site design strategies were extracted from the retrieved cases. Then, the input information of the cases and the BCL sorting algorithm were corrected in four steps. Specifically, the main factors affecting case sorting were identified and sorted through principal component analysis (PCA) on SPSS [24]. The factors with large correlation coefficients were applied to update the indices and elements on the interface of the cases.
(1) Factor pool construction and questionnaire survey
From the visual information in the database management system, a total of 30 influencing factors were extracted to serve as the original factors of the factor pool. The selected factors were sorted randomly, and evaluated by the Likert scale: Level 1 means a factor is strongly important to the acceptance of the case; Level 2 means the factor is slightly important; Level 3 means the factor is neutral; Level 4 means the factor is slightly unimportant; Level 5 means the factor is strongly unimportant. The questionnaire was released to the users, who scored the cases displayed on the interface.
(2) Reliability test and suitability analysis
The reliability and representativeness of the questionnaire were verified through reliability test and suitability analysis. The reliability of the questionnaire was measured by the common index, Cronbach’s alpha (α):
$\alpha=\frac{k}{k-1}\left(1-\frac{\sum s_{i}^{2}}{s^{2}}\right)$ (11)
where, k is the total number of items; s2 is the variance of the total score; i is the variance of each item score. For our 30-item questionnaire, the Cronbach’s α stood at 0.875, an evidence of high reliability.
Besides, the factors for the PCA must be highly consistent. The consistency between them was evaluated by the Kaiser-Meyer-Olkin (KMO) test. The closer the KMO is to 1, the stronger the correlation between the factors, and the more suitable the factors are for the PCA. In generally, the original data are suitable for the PCA, if their KMO is greater than or equal to 0.6 [25]. As shown in Table 2, the KMO of our original data was 0.813, while the significance obtained through Bartlett's test of sphericity was smaller than 0.05. The results show that our original data are suitable for the PCA.
Table 2. The results of the KMO test and Bartlett's test of sphericity
|
KMO measure of sampling adequacy |
0.813 |
|
|
Bartlett's test of sphericity |
Approximate Chi-squared |
37929.110 |
|
Degree of freedom |
78 |
|
|
Significance |
0.000 |
|
(3) Principal component extraction
The 30 factors were subjected to the PCA on the SPSS. As shown in Table 3, five principal components were extracted by the maximum variance method. Their cumulative variance contribution rate was 86.197%. Since the PCA effect is negatively correlated with the loss of original information, the five principal components were considered the main factors that affect the case sorting.
Table 3. Cumulative variance contributions and eigenvalues of principal components
|
Components |
Initial eigenvalues |
Extraction sums of squared loadings |
Rotation sums of squared loadings |
||||||
|
|
Total |
Percentage of variance |
Cumulative % |
Total |
Percentage of variance |
Cumulative % |
Total |
Percentage of variance |
Cumulative % |
|
1 |
3.550 |
39.311 |
39.311 |
3.550 |
39.311 |
39.311 |
3.338 |
37.678 |
37.678 |
|
2 |
2.347 |
18.053 |
57.364 |
2.347 |
18.053 |
57.364 |
1.955 |
15.035 |
52.713 |
|
3 |
1.363 |
10.484 |
67.848 |
1.363 |
10.484 |
67.848 |
1.663 |
12.792 |
65.505 |
|
4 |
1.233 |
9.482 |
77.330 |
1.233 |
9.482 |
77.330 |
1.387 |
10.671 |
76.176 |
|
5 |
1.153 |
8.867 |
86.197 |
1.153 |
8.867 |
86.197 |
1.303 |
10.021 |
86.197 |
|
6 |
0.913 |
5.027 |
88.224 |
|
|
|
|
|
|
|
7 |
0.785 |
3.037 |
91.296 |
|
|
|
|
|
|
|
8 |
0.667 |
2.128 |
92.785 |
|
|
|
|
|
|
|
9 |
0.324 |
2.089 |
94.874 |
|
|
|
|
|
|
|
10 |
0.271 |
2.001 |
96.875 |
|
|
|
|
|
|
|
11 |
0.181 |
1.479 |
98.354 |
|
|
|
|
|
|
|
12 |
0.138 |
1.062 |
99.417 |
|
|
|
|
|
|
|
13 |
0.076 |
0.583 |
100.000 |
|
|
|
|
|
|
Figure 4. Visualization of the classification of principal factors
(4) Classification and analysis of influencing factors
To clarify the features of factors, the factor matrix can be rotated to explain the information of multiple factors. The factor load matrix was orthogonally rotated by the maximum variance method. Based on the orthogonally rotated factor load matrix, the subitems of each factor were summed up, and classified into five categories (Table 4).
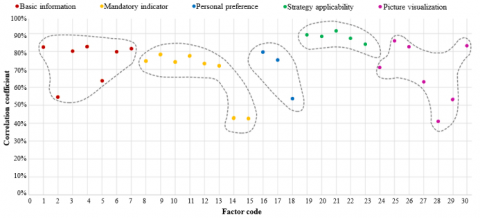
Then, the classification of principal factors was visualized (Figure 4) based on the scatterplots of the correlation coefficients of original factors. It can be seen that the correlation coefficients of subitems under “strategy applicability” were all about 0.85. Thus, “strategy applicability” is the leading influencing factor of case sorting.
The 30 original factors were sorted in descending order of correlation degree (Figure 5). Twelve of them had a correlation coefficient greater than 0.8: integration of strategy in environment, strategy innovation, design method innovation, building generation process analysis, general plan (Y/N), strategy analysis chart (Y/N), image clarity, project introduction, top view (Y/N), project location, building type, and site information. These original factors have great impact on the sorting of building cases, and should be focused on in interface development.
Table 4. Factors and correlation coefficients after orthogonal rotation
|
Class name (principal component) |
Subitem name (original factor) |
Code |
Contribution rate |
|
Basic information |
Project location |
1 |
0.824 |
|
Completion time |
2 |
0.546 |
|
|
Site information |
3 |
0.801 |
|
|
Project introduction |
4 |
0.827 |
|
|
Description of building structure |
5 |
0.638 |
|
|
Physical project (Y/N) |
6 |
0.796 |
|
|
Building type |
7 |
0.815 |
|
|
Mandatory indices |
Total building area |
8 |
0.745 |
|
Total land area |
9 |
0.784 |
|
|
Base area |
10 |
0.742 |
|
|
Floor area ratio |
11 |
0.776 |
|
|
Green space ratio |
12 |
0.731 |
|
|
Building density |
13 |
0.720 |
|
|
Number of parking spaces |
14 |
0.431 |
|
|
Parking method |
15 |
0.425 |
|
|
Personal preference |
Material composition |
16 |
0.798 |
|
Design company/designer |
17 |
0.752 |
|
|
Valuable comments |
18 |
0.536 |
|
|
Strategy applicability |
Strategy innovation |
19 |
0.892 |
|
Design method innovation |
20 |
0.883 |
|
|
Integration of strategy in environment |
21 |
0.915 |
|
|
Building generation process analysis |
22 |
0.874 |
|
|
Strategy analysis chart (Y/N) |
23 |
0.842 |
|
|
Image visualization |
Dimensions of planar and vertical views (Y/N) |
24 |
0.712 |
|
General plan (Y/N) |
25 |
0.857 |
|
|
Top view (Y/N) |
26 |
0.826 |
|
|
Floor plans (Y/N) |
27 |
0.631 |
|
|
Field photos (Y/N) |
28 |
0.412 |
|
|
Interior photos (Y/N) |
29 |
0.534 |
|
|
Image clarity |
30 |
0.831 |
Figure 5. Original factors sorted by correlation degree
Based on extension set, our innovation strategy generation method for building design can automatically generate an innovation strategy for building design through the transform of building design problems, preliminary screening of building cases based on correlation function, and dynamic storing of building cases based on extension set.
(1) Our method enables architects to quickly find excellent building cases and generate innovative designs through such steps as cloud-based BCL construction, optimization of dynamic sorting algorithm, and innovation strategy generation for building design.
(2) To provide the BCL designer with complete information, the original factors were sorted out by correlation degree. The top 12 original factors are the main factors affecting whether a building case is an innovation strategy.
(3) The case study shows that our method is feasible and highly operable, offering a viable solution to mine out sufficient building knowledge from the big data in the era of the Internet.
(4) The extension set, which quantifies the mutual transform between yes and no, was introduced to the architectural studies. This extenics instrument can effectively improve the ability of architects to make scientific decisions based on online data, and thus promote the innovation of computer-aided building design.
This work was supported by the Scientific Research Foundation of Shandong University of Science and Technology for Recruited Talents (No. 2019RCJJ025); the Foundation of Ningbo University (No. XYW20001) and the Teaching and Research Project Foundation of Ningbo University (No. JYXMXYB202053).
[1] Lin, C.J. (2012). Topology pattern mining: A visual approach for detecting and retrieving design patterns of spatial topology in a case library. Computer-Aided Design and Applications, 9(2): 199-205. https://doi.org/10.3722/cadaps.2012.199-205
[2] Lin, C.J., Chiu, M.L. (2010). Spatial topology retrieval: A visual approach for encoding and indexing spatial topology in an architectural design case library. In 2010 Second WRI Global Congress on Intelligent Systems, 4(2): 125-132. https://doi.org/10.1109/GCIS.2010.254
[3] Krauß, V., Fuchkina, E., Molina León, G., Popescu, O. I., Echtler, F., Bertel, S. (2015). pART bench: A hybrid search tool for floor plans in architecture. In Proceedings of the 2015 International Conference on Interactive Tabletops & Surfaces, pp. 265-270. https://doi.org/10.1145/2817721.2823491
[4] Ayzenshtadt, V., Langenhan, C., Bukhari, S.S., Althoff, K.D., Petzold, F., Dengel, A. (2016). Thinking with containers: A multi-agent retrieval approach for the case-based semantic search of architectural designs. In ICAART, pp. 149-156. https://doi.org/10.5220/0005683801490156
[5] Ayzenshtadt, V., Langenhan, C., Bukhari, S.S., Althoff, K.D., Petzold, F., Dengel, A. (2015). Distributed domain model for the case-based retrieval of architectural building designs. In Proceedings of the 20th UK Workshop on Case-Based Reasoning. UK Workshop on Case-Based Reasoning (UKCBR-2015), located at SGAI International Conference on Artificial Intelligence, December, pp. 15-17.
[6] Meng, J. (2014). Study on design process of architectural scheme based on case-based reasoning. Ph.D. dissertation. Harbin Institute of Technology, Harbin, China.
[7] Shen, L., Yan, H., Fan, H., Wu, Y., Zhang, Y. (2017). An integrated system of text mining technique and case-based reasoning (TM-CBR) for supporting green building design. Building and Environment, 124(1): 388-401. https://doi.org/10.1016/j.buildenv.2017.08.026
[8] Zhao, Y.W., Jiang, G.G., Hua, R.T., Zhou, J.Q., Hong, H.H. (2015). Dynamic classification method of product low carbon design cases based on multidimensional correlation function. Computer Integrated Manufacturing System, 21(06): 1428-1435. https://doi.org/10.13196/j.cims.2015.06.003
[9] Sabri, Q.U., Bayer, J., Ayzenshtadt, V., Bukhari, S.S., Althoff, K.D., Dengel, A. (2017). Semantic pattern-based retrieval of architectural floor plans with case-based and graph-based searching techniques and their evaluation and visualization. In ICPRAM, 50-60.
[10] Yang, C., Cai, W. (2013). Extenics: Theory, Method and Application. Science Press. 185-191.
[11] Liu, F., Li, X., Shi, Y. (2016). Scientific breakthrough study of extenics. Procedia Computer Science, 91(7): 526-531. https://doi.org/10.1016/j.procs.2016.07.134
[12] Chen, A., Dong, L., Liu, W., Li, X., Sao, T., Zhang, J. (2015). Study on the mechanism of improving creative thinking capability based on extenics. Procedia Computer Science, 55: 119-125. https://doi.org/10.1016/j.procs.2015.07.017
[13] Li, X., Zhang, H., Zhu, Z., Xiang, Z., Chen, Z., Shi, Y. (2013). An intelligent transformation knowledge mining method based on Extenics. Journal of Internet Technology, 14(2): 315-325. https://doi.org/10.6138/JIT.2013.14.2.15
[14] Varghese, B., Buyya, R. (2018). Next generation cloud computing: New trends and research directions. Future Generation Computer Systems, 79: 849-861. https://doi.org/10.1016/j.future.2017.09.020
[15] Buyya, R., Yeo, C.S., Venugopal, S., Broberg, J., Brandic, I. (2009). Cloud computing and emerging IT platforms: Vision, hype, and reality for delivering computing as the 5th utility. Future Generation computer systems, 25(6): 599-616. https://doi.org/10.1016/j.future.2008.12.001
[16] Jose, B., Abraham, S. (2020). Performance analysis of NoSQL and relational databases with MongoDB and MySQL. Materials Today: Proceedings, 24: 2036-2043. https://doi.org/10.1016/j.matpr.2020.03.634
[17] Han, J.W., Kamber, M., Pei, J. (2006). Data Mining Concepts and Techniques. C Data Mining Concepts Models Methods & Algorithms Second Edition, 6(1): 58-66. https://doi.org/10.1002/9781118029145.ch1.
[18] Connolly, T.M., Begg, C.E. (2014). Database systems: a practical approach to design, implementation, and management. Pearson Education, 58-74.
[19] Xu, L. (2016). Ontology construction and case-based reasoning in the field of Architecture. Ph.D. dissertation. Northeast Forestry University, Harbin, China.
[20] Hancock, B. (2000). Microsoft releases new IIS security tool. Computers & Security, 19(7): 572-572. https://doi.org/10.1016/S0167-4048(00)07004-8
[21] Liu, C.H. (2006). Data flow analysis and testing of JSP-based Web applications. Information and Software Technology, 48(12): 1137-1147. https://doi.org/10.1016/j.infsof.2006.06.003
[22] Zhuang, W.M. (2016). Architectural Planning and Design. China Construction Industry Press, 22-45.
[23] Lian, F. (2010). The study on basic theory and applying methods of extension architectural program. Ph.D. dissertation. Harbin Institute of Technology, Harbin, China.
[24] Liu, R.X., Kuang, J., Gong, Q., Hou, X.L. (2003). Principal component regression analysis with SPSS. Computer Methods and Programs in Biomedicine, 71(2): 141-147. https://doi.org/10.1016/S0169-2607(02)00058-5
[25] Fávero, L.P., Belfiore, P. (2019). Data Science for Business and Decision Making. Academic Press, 383-438.