Youssef Senousy* | Wael K. Hanna | Abdulaziz Shehab | Alaa M. Riad | Hazem M. El-Bakry | Nashaat Elkhamisy
OPEN ACCESS
Social insurance is an important way to defend individuals from the dangers of retirement, sickness, and financial despondency. However, the social insurance data of Egypt are extremely massive, diverse and complex, due to the intricate provisions in Egyptian laws on social insurance. This calls for an effective method to distinguish between the insured and the uninsured based on the big data. Therefore, this paper fully demonstrates the capability of supervised learning algorithms in predicting the insured and the uninsured based on some of the data on social insurance. The big dataset of Egyptian social insurance was preprocessed in details, including replacing the missing values with mean values, normalization, and removal of outliers and extreme values. Next, three supervised learning algorithms, namely, Naive Bayes, Decision Tree Algorithm, and CN2 Rule Induction, were applied to classify the Egyptians based on the preprocessed data. The results show that all three algorithms achieved highly accuracy classification results. The research provides a new way to mine useful information from the big data of social insurance.
social insurance, data pre-processing, supervised learning algorithms, and big data mining
Data mining involves extracting and analyzing large quantities of data in order to explore big data models. Data mining is used to summarize and simplify the data in a manner that we can identify and then allow us to collect facts about particular instances based on patterns. The main purpose of data mining is prediction or classification. The classification is split the data into sets. But, in prediction is focus on continuous variable and predict the rate of it [1].
Data mining is a concrete innovation with great potential to help insurance companies concentrate on the most important information about the actions of their clients and potential customers in the data they have collected. Data mining helps the insurance industry forecast fraudulent claims, medical coverage and predict the trend of the consumer buying new products from insurers. Data mining is introduced in the insurance industry, but the firms that have successfully implemented it have enormous competitive advantages [2].
Some of the data mining fields that may relate to the insurance industry such as risk assessment, forecast income, claims, expenses, financial analysis, and fraud detection. One of the important types of insurance is social insurance. An evolving data mining area is the evaluation of social insurance data in the marriage of machine learning and data mining with insurance industries. Social insurance big data mining aims to find in social insurance data interesting patterns and exceptions [3]. It also aims at supporting new research and offers a leading forum for academics, government agencies and practitioners to discuss complex approaches and establish workable frameworks, methods and case studies to enhance government service goals, improve quality of service and policymaking.
Egyptian Social insurance suffers from critical issues such as collecting the accurate amounts of contribution from insured individuals and pay to them the accurate benefits (pensions). People working in varying societies are increasingly interested in social security data and recognize the importance of data-driven evaluation and choices to improve public service goals, the precision of payments, and compliance. In business applications, particularly in the insurance sector, data mining is increasingly being used. Social insurance data is quite big because it includes a huge number of detailed data about insured individuals like birthdate, name, id, and some information about his participation in the insurance scheme. This paper presents a full description of Egyptian social insurance dataset. Also, the pre-processing methods and steps that implemented in the dataset such as replacing missing values by mean, standardization, detecting outlier and extreme values. Finally applying classification algorithms on this dataset to predict the individuals that registered in the insurance scheme is insured or uninsured. In this paper, we present a proposed model for social insurance big data with a comparison accuracy measures between applied supervised mining algorithms in Egyptian social insurance data.
This paper organizes as follows; the previous section presented the research introduction. The next section presents a literature review of data mining in social insurance. Section three presents the methodology of the proposed model. Section four implements the experiment and section five discusses the results of the experiments. Finally, the last section presents the conclusion and future work.
Big data mining refers to collaborative data mining and extraction techniques conducted on large data sets / volume or big data. Big data mining is done primarily to collect and retrieve desired information or pattern from a humongous amount of data. Typically this is achieved on a large amount of unstructured data that an entity collects over time. Big data mining typically works on algorithms for data discovery, optimization, extraction, and comparison. Big data mining often requires support from the underlying computer systems, specifically their processors and memory, for large amounts of data to perform operations / queries. In big data analytics and business intelligence, big data mining techniques and processes are also used to provide condensed targeted and relevant information, trends and/or relationships between data, systems, processes and more [4].
The concept of insurance works on the premise that a group of people (or perhaps their relatives) who are exposed to a particular risk (e.g., retirement, death and disabling injury or disease) pay contributions to a fund that is then used to pay benefits under defined regulations to compensate those respondents who suffer from the event of the specific risk. Those who are fortunate enough not to experience such an event should generally not expect any return from the fund. The insurance systems generally covered over a set of period, usually one year, and renewed year by year, although life insurance plans and pension schemes run for longer periods of time, for participant's lifetime.
Too many, researches are related to data mining in insurance claims, finance in insurance industries, and pensions. The following literature review focuses on data mining in social insurance which is one of the most important types of insurance.
Liu et al. [5] presented big data platform architecture under the background of financial technology in the insurance industry. To reshape the economic sector, the authors demonstrate the business philosophy, business model, technical means, sales, inner management, and other aspects. They also use a current innovation in big data architecture platform architecture and added space-time data components, coupled with the insurance industry for practical evaluation, put forward a relevant product circle and client circle. Their platform consists of some layers such as data source, acquisition, storage, database, services, and analysis. The research support our paper with more knowledge about big data in insurance industries and its nature.
Ceylan et al. [6] presented a decision tree classification to determine the customer profile. A classification model has been developed using SPSS Clementine 12.0 software. Some client data was obtained from the scheme from a pension business working in Turkey. The Analysis disclosed important customer rules. Analytical findings stated that the CHAID algorithm showed the highest forecast among C5.0, C&R Tree, QUEST, with a precision of 85.64 percent. This research proposed a useful model in an area related to social insurance which is pensions. But the research used a dataset with 171625 records which are not considered as big data. In our research, we will work with a big dataset including all individuals related to insurance schemes in Egypt.
Pijl [7] presented a framework to forecast insurance claims. Preparation of data, reduction of dimensions, classification, forecasting, and assessment is implemented in this study. Also, it presented three dimensionality reduction techniques and four classification techniques were introduced to solve the claim problem. The study discussed that predicting a claim by someone, it is better to split the claim value into bins and predict the observation in each bin, this will most probably enhance the precision of the person but may have an effect on the complete claim amount. The study gives useful data pre-processing steps but the author used a small dataset to speed up the implementation of the classification techniques. This paper will present a model that works with big dataset.
Kareem et al. [8] presented a framework for the identification of fraudulent health insurance claims using association rule mining. The paper proposed a strategy to detect fraudulent claims for health insurance by defining correlations or associations between some of the characteristics in the claim files. By applying a data mining association rules, the research argues that effective determination of correlated characteristics can properly address information discrepancies in fraudulent claims, thereby reducing health insurance fraud. The study presented a good explanation of the importance of detecting fraud in health insurance as one of the most problems in the insurance field in general but not give us the full dataset description used in their study. In this paper, we will identify every attribute in our dataset.
Lin et al. [9] the authors used a sampling strategy coupled with the large-scale insurance company data mining learning algorithm and suggested an ensemble random forest algorithm to evaluate prospective clients using the suggested algorithm, they gathered insurance company information from China Life Insurance Company. Moreover, use F-Measure and G-mean to assess the algorithm's output. The outcome of the experiment demonstrates that the ensemble random forest algorithm has outperformed SVM and other classification algorithms in performance and precision within the imbalanced information and helps enhance product marketing precision compared to traditional artificial strategy. This research presented some of the measurements that will help to identify the accuracy of the applied algorithms in this paper.
Akçapınar et al. [10] the authors used learning analytics to develop an early warning system for at-risk students. They used in the implementation of their research experiment the Orange data mining tool. The findings obtained from this study are important for the determination of features for early warning systems that can be developed for online learning systems and as indicators of student success. At the same time, it will aid researchers in the selection of algorithms and pre-processing techniques in the analysis of educational data. This research helps us to discover some methods in the Orange miner tool that will help us to implement our experiment on the Social Insurance dataset.
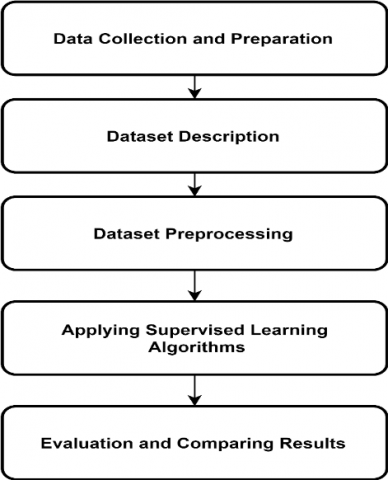
The proposed model going through advanced and important stages that support to achieve the goal of this paper (Figure 1). The first stage is data collection and preparation and this stage discussed in another framework research that illustrates detailed steps of this stage. The second stage includes the description of the dataset. The third stage concludes the pre-processing steps of the dataset. The fourth stage applying supervised learning algorithms. The fifth and last stage is the evaluation and conclusion.
Figure 1. Flow of proposed model
4.1 Dataset
The Egyptian Social Insurance dataset is the final data result from the data collection and preparation stage. It consists of 16 attributes including 24,430,486 records of insured and uninsured individuals. Some of the uninsured individuals are taking pensions from the social insurance schemes when the pension owner dies (family members). The following Table 1 shows the basic characteristics of the dataset.
Table 1. Egyptian social insurance dataset basic characteristics
|
Dataset Characteristics |
Multivariate |
|
Attribute Characteristics |
Numeric, Nominal and Date |
|
Associated Tasks |
Classification |
|
Number of Instances |
24,430,486 |
|
Number of Attributes |
16 |
|
Missing Values |
Yes |
|
Area |
Insurance |
|
Extraction Date |
2019-07-03 |
Egyptian Social Insurance dataset consists of the following attributes:
Insurance No: It is the unique identification for the insured individual.
Gender: It is the gender type of the insured individual Male or Female.
Age: The category of the age of the insured individuals. The "adult" is less than 30, "Middle Adult" from 30 to 45, and "Senior Adult" is more than 45.
City: It contains the last Egyptian city that the insured individual has/had a job in it.
Job Category: The category of work of the insured individual like Doctors, Engineers, Carpenters and etc.
Sector: The insured individual work sector like public, private and some irregular sectors like car drivers, and abroad workers.
Job Start Date: The date of starting his/her work.
Job End Date: The date of ending his/her work.
Total Periods: Calculated by subtracting insured working duration dates the start date and end date and sum the result durations.
Job Period Status: There are two types of period status ‘opened’ which is the insured have a period start date without an end date and ‘closed’ the insured have a period start date and end date.
Net Last Salary: Among the insured individuals have periods and each period has salaries. For example, an individual is working for an employer when he/she starts his job the employer gives him/her a salary and after six months of work, the employer raising his/her salary by 20%. So, every period may contain a lot of salaries. We get the last salary of each insured individual in Egyptian pounds.
Insured End Reason: It contains the reason why the individual ended his job like death, retirement, disability or continue working.
Pension Start Payment Date: the date of the first pension payment if one of the insurance risks happened to the insured individual or pension owner is dead and one of his/her relatives takes the pension.
Pension Value: The value of the pension in Egyptian pounds.
Pension Receiver: It contains if the insured taking the pension by himself or one of his/her relatives or not pensioner yet.
Insurance Status: It contain the status of the insured individual Insured or uninsured.
4.3 Dataset attributes characteristics
To see what dataset can give us, we would begin working on exploratory data analysis that could be summarized as full understanding of the data and drawing attention to its most important features to prepare it to apply more advanced analytical techniques and feed into algorithms for machine learning. It also helps in generating data hypotheses, detecting its anomalies, and revealing the structure. Table 2 shows each attribute in the dataset with its name, type, ranges of values, minimum value, maximum value, mean and standard deviation.
4.4 Dataset pre-processing
In order to achieve optimum outcomes, data cleaning and pre-processing are crucial. The next step is handling insured rows with missing and outlier information. In the pre-processing of the social insurance dataset we used some data filters from WEKA data mining tool.
4.4.1 Missing values
At first, we will attempt to manage missing values. There were many features with missing values in the Egyptian Social Insurance dataset. In order to fill the missing values, several replacement strategies have been adopted. First, it will be removed if a feature was not useful.
Table 2. Egyptian social insurance attributes characteristics
|
No. |
Attribute Name |
Type |
Ranges of Values |
Minimum |
Maximum |
Mean |
StdDev |
|
1 |
Insurance_No |
Numeric |
|
4 |
77424512 |
|
|
|
2 |
Gender |
Numeric |
[Male-Female] |
|
|
|
|
|
3 |
Age |
Numeric |
[Adult – Middle Adult – Senior Adult] |
|
|
|
|
|
4 |
City |
Nominal |
[West Cairo, Sohag, Luxur…] |
|
|
|
|
|
5 |
Job_Category |
Nominal |
[Engineers, Teachers, Doctors …] |
|
|
|
|
|
6 |
Sector |
Nominal |
[Public, Private, Car Drivers, Temporary, Abroad Workers, No Sector] |
|
|
|
|
|
7 |
Job_Start_Date |
Date |
|
|
|
|
|
|
8 |
Job_End_Date |
Date |
|
|
|
|
|
|
9 |
Total_Periods |
Numeric |
|
0 |
40 |
10.884 |
13.272 |
|
10 |
Job_Period_Status |
Nominal |
[Opened, Closed] |
|
|
|
|
|
11 |
Net_Last_Salary |
Numeric |
|
0 |
13919.5 |
572.892 |
1018.465 |
|
12 |
Job_End_Reason |
Nominal |
[Death, Disability, Retirement, … ] |
|
|
|
|
|
13 |
Pension_Start_Payment_Date |
Date |
|
|
|
|
|
|
14 |
Pension_Value |
Numeric |
|
0 |
9997.69 |
420.996 |
903.353 |
|
15 |
Pension_Reciever |
Nominal |
[Pension Owner, Pension Beneficiary, Not Pensioner] |
|
|
|
|
|
16 |
Ins_Status |
Nominal |
[Insured, Uninsured] |
|
|
|
|
Table 3. Dataset missing values
|
Attributes |
Missing Values (%) |
Replace Missing Value by Mean |
Value After Replacing |
|
Insurance_No |
0 (0%) |
|
0 |
|
Gender |
0 (0%) |
|
0 |
|
Age |
0 (0%) |
|
0 |
|
City |
2745428 (11%) |
[East Cairo] |
0 |
|
Job_Category |
3004129 (12%) |
[Employer Owners] |
0 |
|
Sector |
12810255 (36%) |
[Private] |
0 |
|
Job_Start_Date |
3290038 (13%) |
|
0 |
|
Job_End_Date |
12106428 (50%) |
|
0 |
|
Total_Periods |
0 (0%) |
|
0 |
|
Job_Period_Status |
3290038 (13%) |
[Closed] |
0 |
|
Net_Last_Salary |
0 (0%) |
|
0 |
|
Job_End_Reason |
3290038 (13%) |
[Employer Issues] |
0 |
|
Pension_Start_Payment_Date |
18436717 (75%) |
|
0 |
|
Pension_Value |
0 (0%) |
|
0 |
|
Pension_Reciever |
0 (0%) |
|
0 |
|
Insured_Status |
0 (0%) |
|
0 |
Variables measured at various scales do not contribute to the analysis equally. For example, a variable ranging from 0 to 100 in boundary detection would outweigh a variable ranging from 0 to 1. Using these variables in turn without standardization gives the factor in the study with the greater weight range of 100. This problem can be solved by translating information into comparable scales. So, standardization is the method of rescaling the characteristics of data between zero and one so that they have the qualities of a Gaussian distribution with μ=0 and π=1, where μ is the mean and σ is the standard deviation from the mean; standard sample scores z are calculated as follows [11].
$Z=\frac{(\mathrm{x}-\mu)}{\sigma}$ (1)
Before applying standardization in Total_Periods attribute the mean was 10.884 and the standard deviation was 13.272. After applying standardization, the mean is 0.485 and the standard deviation is 1.222.
4.4.3 Outlier and extreme values
The next step is to handle the dataset rows with outlier data which is an observation that in a random sample from a population is an unusual distance from other values. A point on either side beyond an inner fence is regarded to be a minor outlier and extreme outlier is considered to be a point beyond an outer fence [12]. To calculate the outlier and extreme values it begins by divide the dataset into four quartiles Q1, Q2, Q3 and Q4. Then calculate the interquartile range which is the subtraction of the first quartile from the third quartile.
$I Q R=Q_{1}-Q_{3}$ (2)
The outlier and extreme values are calculated with the following formulas:
Outlier $=Q_{1}-1.5(I Q R)$ (3)
Extreme $=Q_{3}+1.5(I Q R)$ (4)
Table 4. Dataset outlier and extreme values
|
Count |
|
Count after removing |
|||
|
Yes |
No |
Yes |
No |
||
|
Outlier |
849047 |
23581439 |
Remove With Values |
0 |
23581439 |
|
Extreme Data |
6624956 |
17803937 |
Remove With Values |
0 |
17803937 |
Table 5. Re-weights dataset by class balancer
|
Label |
Count |
Weight |
Weighted |
|
Insured |
15684058 |
1.5684058E7 |
8541913.0 |
|
Uninsured |
1399768 |
1399768.0 |
8541913.0 |
Class balancer is re-weight the instances in the data so that the total weight of each class is the same. The complete amount of weights will be retained in all cases. For instance, before class balancer in Insured_Status attribute the insured label weight was 1.5684058E7 and uninsured label was 1399768 and after applying class balancer the weight of two labels is 8541913 as shown in Table 5.
In machine learning and statistics, classification is a supervised learning approach in general way in which the computer program learns from the data input given to it and then uses learning to classify new observations. Data mining generally refers to the process of extracting interesting hidden information from available chunks of data, which could otherwise be manually impossible. It encompassed several technical approaches such as classification or supervised learning, clustering unsupervised learning, association rule mining [13]. Classification is a data mining algorithm that creates a step-by-step guide for how to determine the output of a new data instance.
Figure 2. Steps of classification
As shown in Figure 2, data classification consists of two main steps (1) apply the classification algorithm on the training data to initiate the learning phase and build a classification model. (2) Using the model for Classification which includes evaluation of the classification model that can be applied to the new testing data if the accuracy is considered acceptable. We choose an open-source tool called Orange data mining tool to apply the supervised learning algorithms. We partitioned the data set into a training set and a testing set; 80% of the data was used for training, and 20% of the data was used for testing. The training data adjusts the parameters of the classification models, and the testing data to evaluate the predictive ability of the model. The dataset is divided into training and test sets to reduce the overfitting of the implemented model. A target variable indicating insurance status as “insured” or “not insured” is used. Naive Bayes, Decision Tree Algorithm, and CN2 Rule Induction algorithms are used for comparison in Egyptian Social Insurance datasets to determine which of these algorithms get suitable evaluation measurements.
5.1 Naïve Bayes
The naive Bayes algorithm is one of the widely used machine learning algorithms and is used primarily for classification issues. It primarily relates to the joint distribution of input and output probability based on the assumption of conditional independence under the specified training dataset conditions. So, based on this model, the characteristics of the input instance use Bayes theorem to discover the biggest posterior output of probability [14].
5.2 Decision tree algorithm
Decision Tree classification algorithm can be performed in serial or parallel steps depending on the amount of data, algorithm efficiency and available memory. A serial tree is a logical model built using a training data set as a binary tree. This helps by using predictor variables to predict the value of a target variable. It consists of sets of rules hierarchically organized. It is a simple recursive structure in which a future instance is grouped into present predefined categories and tries to divide observations into mutually exclusive subgroups [15]. The tree algorithm used in this experiment is a predecessor of the Random Forest algorithm which aims to divide the data by class purity into nodes and can handle discrete as well as continuous datasets.
5.3 CN2 induction algorithm
The CN2 induction algorithm is a learning algorithm for rule induction. Even when the training data is incomplete, it is designed to work. It is based on AQ (Algorithm Quasi-optimal) algorithm ideas for producing rules and combining learning from decision tree (such as C 4.5, ID3) to handle noise. As a result, it creates a rule set such as that created by AQ but is capable of handling noisy data such as ID3 [16].The CN2 algorithm is a technique designed to induce simple, comprehensible type rules "if condition then predict category" efficiently, even in areas where noise may be present.
5.4 Evaluation
The evaluation is based on some measurements like accuracy, precision, recall, and f-measure. The correct classification represented as True Negatives (TN) and True Positives (TP). (FP) which is False Positive which means the algorithm is incorrectly predicted. Finally, (FN) False Negative is when a particular algorithm is unable to detect the object but the object in present within the test area.
Accuracy: “Percentage of correct predictions”.
Accuracy $=\mathrm{TP} /(\mathrm{TP}+\mathrm{TN})$ (6)
Precision: “Percentage of correct positive predictions”.
Precision $=\mathrm{TP} /(\mathrm{TP}+\mathrm{FP})$ (7)
Recall: “Percentage of positively labelled instances, also predicted as positive”.
Recall $=\mathrm{TP} /(\mathrm{TP}+\mathrm{FN})$ (8)
F-Measure: “A measure that combines precision and recall in the harmonic mean of precision and recall”.
$\mathrm{F} 1=(2 * \text { Precision } * \text { Recall }) /(\text { Precision }+\text { Recall })$ (9)
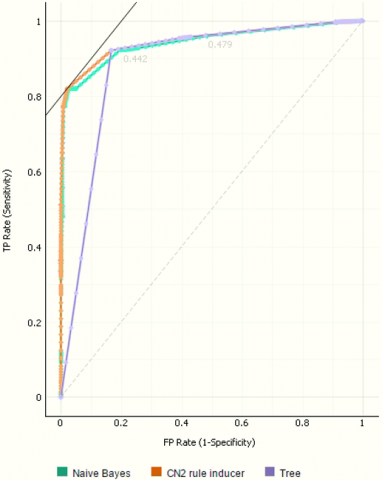
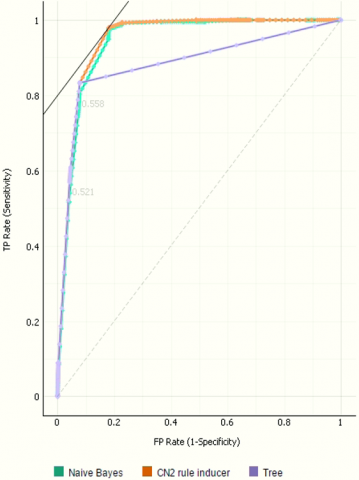
The ROC analysis will be presented in the result discussion to illustrate the performance between the three classification learning algorithms used in the experiment. The ROC curves used to plot the true positive rate against the false-positive rate. The true-positive rate frequency (TPR) is defined as tolerance, recall or probability of detection. The false-positive rate frequency (FPR) is called a false prediction probability.
By using the ranking Information Gain (IG) ratio formulas between features. The following formula represent the general calculation of information gain:
$\mathrm{IG}(\mathrm{S}, \mathrm{a})=\mathrm{H}(\mathrm{S})-\mathrm{H}(\mathrm{S} | \mathrm{a})$ (10)
where, IG(S,a) is the dataset S information for the variable a for a random variable, H(S)is the entropy for the dataset before any adjustment and H(S | a) is the conditional entropy for the variable given a. Table 6 shows the important features that support the classification results arranged from the higher ratio to the lower.
Table 6. Information gain ratio of dataset features
|
Feature |
No. Of Values |
Information Gain Ratio |
|
Job_End_Reason |
5 |
0.112 |
|
Job_Period_Status |
2 |
0.070 |
|
Age |
3 |
0.062 |
|
Sector |
6 |
0.057 |
|
Total_Period |
Many |
0.033 |
|
Net_Last_Salary |
Many |
0.015 |
|
Job_Start_Date |
22470 |
0.013 |
|
Gender |
2 |
0.011 |
|
Job_Category |
81 |
0.006 |
|
City |
35 |
0.004 |
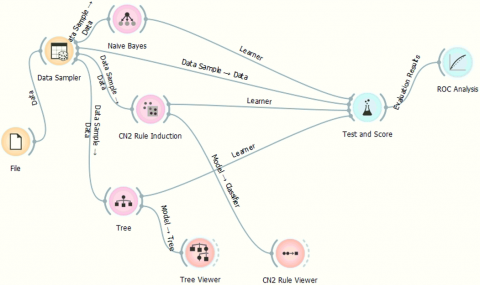
As mentioned before, the classification analyses were carried out using the Orange data mining software in accordance with the process provided in Figure 3.
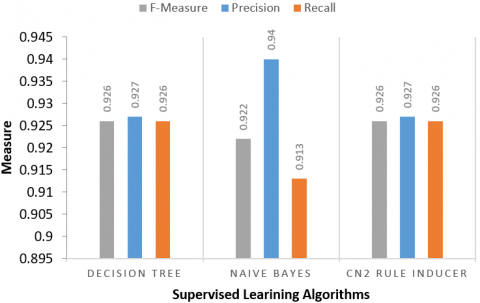
Table 7 shows the result of the classification of the three algorithms Decision Tree, Naive Bayes and CN2 rule inducer. Decision Tree is correctly classified by 92.6%, Naive Bayes by 91.3% and CN2 rule inducer by 92.6 %. Precision, Recall and F-Measure in Decision Tree are 0.927, 0.926 and 0.926 respectively. In Naive Bayes the Precision is 0.940, Recall is 0.913 and F-Measure is 0.922. Furthermore, CN2 rule inducer are 0.927, 0.926 and 0.926.
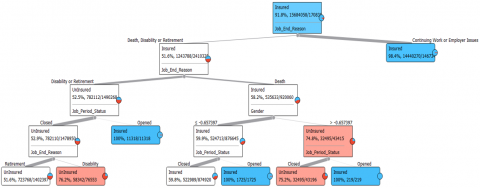
Figure 4 shows the result gaps visually by using a bar chart. Obviously, there is a difference between the results. Decision Tree and CN2 Rule Inducer are similar to each other but the Naïve Bayes algorithm is less than them in accuracy, precision and recall. According to the results, it is obvious that the decision tree and CN2 inducer is the most successful algorithms in prediction of NOSI dataset by a high percentage 92.6%. Therefore, we can rely on these two models to predict is the individual in the Egyptian social insurance scheme is insured or uninsured. The following Figure 5 shows a sample decision tree resulted from the classification experiment.
The below Table 8 illustrate a sample of the rules resulted from the implementation of CN2 inducer algorithm.
Table 7. Classification algorithms results
|
Model |
Accuracy |
F1 |
Precision |
Recall |
|
Decision Tree |
0.926 |
0.926 |
0.927 |
0.926 |
|
Naive Bayes |
0.913 |
0.922 |
0.940 |
0.913 |
|
CN2 rule inducer |
0.926 |
0.926 |
0.927 |
0.926 |
Figure 3. Classification process
Figure 4. A graph of classification results
Figure 5. Sample of decision tree
Table 8. Sample of CN2 inducer rules
|
IF conditions |
THEN class |
|
Job_Period_Status≠Closed AND Job_End_Reason=Disability |
Insured_Status=Insured |
|
Job_Period_Status≠Closed AND Job_End_Reason=Employer Issues |
Insured_Status=Insured |
|
Age=Adult AND Job_End_Reason=Retirement |
Insured_Status=Insured |
|
Job_Period_Status≠Closed AND Age=Adult AND Gender≠Male |
Insured_Status=Insured |
|
Job_Period_Status≠Closed AND Age=Adult AND Job_End_Reason≠Continuing Work |
Insured_Status=Insured |
|
Job_End_Reason=Continuing Work AND Age=Adult AND Gender≠Male |
Insured_Status=Insured |
|
Job_Period_Status≠Closed AND Age=Adult |
Insured_Status=Insured |
Figure 6. ROC analysis of insured and uninsured target
The research initiated a spotlight about a rare and critical field which is social insurance. The paper presented a literature review of how the relationship between big data mining and social insurance is important to give the insurers new insights and views. The current paper presented a strong and unique proposed model that clarifies the pre-processing of the Egyptian social insurance dataset, applying supervised learning algorithms on it. In this paper, we have chosen Decision Tree, Naïve Bayes, and CN2 Rule Inducer algorithms to find which of the three algorithms is more accurate and efficient. The results after applying the algorithms showed that the Decision Tree and CN2 Rule Inducer algorithms perform better results than the Naïve Bayes to predict the individuals are insured and uninsured in the social insurance scheme. In the future, we will try to more classification algorithms using different machine learning libraries in R and Python to exploring new insights into the Egyptian social insurance datasets.
[1] Yenkar, V., Bartere, M. (2014). Review on data mining with big data. International Journal of Computer Science and Mobile Computing, 3(4): 97-102.
[2] Umamaheswari, K., Janakiraman, S. (2014). Role of data mining in insurance industry. In International Journal of Advanced Computer Technology, 3(6): 961-966.
[3] Cao, L. (2012). Social security and social welfare data mining: An overview. IEEE Transactions on Systems Man and Cybernetics Part C, 42(6): 837-853. https://doi.org/10.1109/tsmcc.2011.2177258
[4] Techopedia. https://www.techopedia.com/definition/30215/big-data-mining, accessed on 16 June 2019.
[5] Liu, Y., Peng, J.W., Yu, Z.H. (2019). Big data platform architecture under the background of financial technology. BDET 2018 Proceedings of the 2018 International Conference on Big Data Engineering and Technology, pp. 31-35. https://doi.org/10.1145/3297730.3297743
[6] Ceylan, Z., Gürsev, S., Bulkan, S. (2018). An application of data mining in individual pension savings and investment system. European Journal of Science and Technology, Special Issue, pp. 7-11.
[7] Pijl, T. (2017). A framework to forecast insurance claims. A thesis submitted in fulfilment of the requirements for the degree of Master of Econometrics and Management Science, Erasmus University Rotterdam, Netherlands.
[8] Kareem, S., Ahmad, R.B., Sarlan, A.B. (2017). Framework for the identification of fraudulent health insurance claims using association rule mining. In 2017 IEEE Conference on Big Data and Analytics (ICBDA), pp. 99-104. https://doi.org/10.1109/icbdaa.2017.8284114
[9] Lin, W., Wu, Z., Lin, L., Wen, A., Li, J. (2017). An ensemble random forest algorithm for insurance big data analysis. IEEE Access, 5: 16568-16575. https://doi.org/10.1109/access.2017.2738069
[10] Akçapınar, G., Altun, A., Aşkar, P. (2019). Using learning analytics to develop early-warning system for at-risk students. International Journal of Educational Technology in Higher Education, 16(1): 40-59. https://doi.org/10.1186/s41239-019-0172-z
[11] Lawless, J. (2013) Statistics 231 Course Notes. University of Waterloo, Ontario, Canada. https://www.math.uwaterloo.ca/~pkates/LT3/jsdemos/contest/s231_new_v3.pdf, accessed on 17 May 2019.
[12] Croarkin, C., Tobias, P. (2001). E-Handbook of Statistical Methods. http://www.itl.nist.gov/div898/handbook/, accessed on 23 June 2019.
[13] Zuha, F., Achuthan, G. (2016). Analysis of data mining techniques and its applications. International Journal of Computer Applications, 140(3): 6-14. https://doi.org/10.5120/ijca2016909249
[14] Zhang, L. (2019). Design of a sports culture data fusion system based on a data mining algorithm. Personal and Ubiquitous Computing, 1-12. https://doi.org/10.1007/s00779-019-01273-6
[15] Alsagheer, R.H., Alharan, A. F.H., Al-Haboobi, A.S.A. (2017). Popular decision tree algorithms of data mining techniques: A review. International Journal of Computer Science and Mobile Computing, 6(6): 133-142.
[16] Swe, S.M., Sett, K.M. (2019). Approaching rules induction: CN2 algorithm in categorizing of biodiversity. International Journal of Trend in Scientific Research and Development, 3(4): 1581-1584.