Sitesh Kumar Singh* | Ankit Saraswat
OPEN ACCESS
The purpose of this research is to assess the traffic situations of the existing system by evaluating the Level of service as a key component. Traffic survey have been carried out for the analysis of AADT, Design service volume, capacity and Leve of Service of the city road networks. By using AADT, the LOS have been estimated for the analysis of future traffic condition. Peak hour traffic survey data have been collected for the analysis of AADT and Level of Service. LOS has been converted into percentile form for the analysis of the future LOS. It has been observed that the LOS of the roads of the major traffic operations have mostly same LOS in the morning & evening peak hours which signifies that the traffic movement and the pattern of movement are same in both the traffic session of peak hours. The rapid decrease in LOS has been presented in results, which means, LOS will reduce from time to time and the unimproved existing traffic system will create a problem for motorists and pedestrians. Hence, the existing traffic systems must be evaluated in order to cope with future traffic demands and problems.
capacity, level of service, design service volume, traffic survey, traffic growth, traffic forecasting
Traffic has grown in recently years with urbanization. In the recent scenario traffic is the major consent for any developing nation [1]. Transportation infrastructure plays an important role in the economic and social development of any country. We are moving in the era of smart transportation systems, but we are focusing only on the developed cities [2]. As some of the rural areas have been grown since past few decades, which approached to the urban city. These cities are somewhere about to be called as urban cities which we can call semi-urban cities now. A study on the similar semi-urban city have been carried out for the evaluation of design service volume of the road, capacity of the roads and the level of service. The Design Service Volume of this type of area might vary from Design Service Volume (DSV) of rural area & urban area. Hence, the calculation of DSV as by equation 1 for Mid-sized city or semi-urban or semi-rural can be considered. Capacity of a route is the maximum hourly rate at which persons or vehicles can move in a reasonable order of a point or a lane of road, during a period of time under the prevailing conditions of path, traffic and control [3]. Capacity is considered as the maximum capability of a given transportation mode or its particular component to serve a certain volume of demand, during a specified period of time, under given conditions [4]. A researcher emphasized on the need of developing highway capacity norms for Indian highways [5]. The main emphasis of the study was the development of simpler techniques for evolving capacity norms, based on observed data. A researcher analyzed traffic characteristics in Vadodara Ahmedabad section of the National Highway Number 8 to identify management measures that will lead to better traffic performance [6]. Level of service is defined as the qualitative measure of operational conditions with a traffic stream and their perception by drivers/passengers. Capacity standards are fixed normally in relation to the level of services (LOS) adopted for the design. In determining the level of service, quality terms of traffic flow at the point of drivers and passengers should be measured [7-8]. Level of service describes the conditions in terms of factors such as speed and travel time, freedom to manoeuvre, traffic interruptions, comfort, convenience and safety. Six level of services are recognized commonly, designated as A, B, C, D, E & F with level of service A representing the best operating condition /free flow and level of service F represents the worst/forced or breakdown flow. A researcher carried out study of level of service (LOS) of different segments, it was determined that for V/C ratio as well as for peak hour factor the LOS is F for the stretch path [9]. In determination of service level based on ATS and PTSF based on HCM 2000, generally, service level based on ATS in comparison to service level based on PTSF is in better condition, it means that divers have higher average speed and they almost pay no attention to traffic distance headway and time spent following, so, safety is less and disasters are more [10].
To calculate the current level of service of the roads, the peak hour traffic data have been collected by the traffic survey method. The intersections of the maximum traffic operations have been identified for the conduction of traffic survey. The traffic survey data of peak hour have been converted into Passenger Car Unit (PCU) for uniformity in the units as shown in Table 1. AADT have been also calculated by the traffic survey which is used in LOS forecasting. V/C method have been used to identify the LOS of the road as explained in Table 2. DSV for the urban roads & rural roads are already given in the IRC guidelines. Here, the DSV have been calculated for the semi-urban context which have traffic more than rural traffic & less than urban traffic. By the use of DSV, LOS will be calculated. The future LOS will be calculated by considering the city traffic as a whole. A generalized single LOS will be calculated for the complete city area roads of major traffic operations and will be forecasted according to the future. i.e., next 20 years.
As per IRC 64-1990, the DSV of Single lane road in plain area under Indian conditions is 2000 PCU/day and for urban context, it is 900 PCU/hr [11].
10 % of daily traffic volume is considered as peak hour traffic volume [12].
Hence, 200 PCU/hr.
Consider mid value of DSV between ideal condition & urban condition.
$\operatorname{DSV}_{(\text {semi-urban city })}=(200+900) / 2$ (1)
DSV(semi-urban city)= 550 PCU/hr. (for the case of peak traffic hours).
In Table 1, the peak hour flow has been extracted in terms of vehicle per hour and PCU per hour for all the roads of study by taking mean of the two-hour traffic survey data. From the values obtained in this table as PCU per hour, level of services has been obtained. For the calculation of level of service, the Volume/Capacity ratio was first determined using design service volumes [13] and then the level of service was computed as shown in Table 3. Table 2 shows the Level of Service Criteria based on Volume to Capacity ratio.
Table 1. Peak hour flow of traffic at all sections of the road
|
Sr.No. |
Road |
Period |
Total Vehicle/hr. |
Total PCU/hr. |
|
01 |
Thana Chowk Road |
Morning Peak Hour |
505 |
379.95 |
|
Evening Peak Hour |
559.5 |
334.45 |
||
|
02 |
Neelam Chowk Road |
Morning Peak Hour |
474.5 |
257.55 |
|
Evening Peak Hour |
500 |
276 |
||
|
03 |
Bata Chowk Road |
Morning Peak Hour |
340.5 |
178.2 |
|
Evening Peak Hour |
421.5 |
230.25 |
||
|
04 |
Churi Bazaar Road |
Morning Peak Hour |
439.5 |
237.1 |
|
Evening Peak Hour |
481.5 |
254.3 |
||
|
05 |
Mahila College Road |
Morning Peak Hour |
427 |
241.4 |
|
Evening Peak Hour |
435 |
236.55 |
||
|
06 |
Railway Station Road |
Morning Peak Hour |
640.5 |
450.8 |
|
Evening Peak Hour |
625.5 |
435.85 |
||
|
07 |
Ganga Sagar Chowk Road |
Morning Peak Hour |
598 |
420.55 |
|
Evening Peak Hour |
616 |
418.6 |
||
|
08 |
Old Bus Stand Road |
Morning Peak Hour |
517 |
375.1 |
|
Evening Peak Hour |
490 |
347.2 |
||
|
09 |
Bara Bazaar Road |
Morning Peak Hour |
445 |
297.95 |
|
Evening Peak Hour |
446 |
284.4 |
||
|
10 |
Chavaccha Mor |
Morning Peak Hour |
474 |
291.95 |
|
Evening Peak Hour |
508 |
311.05 |
Table 2. Level of service criteria based on V/capacity ratio
|
Sr.No. |
LOS |
Description |
V/C |
|
1 |
A |
Free flow conditions with unimpeded maneuverability. Stopped delay at signalized intersection is minimum. |
0.00 to 0.60 |
|
2 |
B |
Reasonably unimpeded operations with slightly restricted maneuverability. Stopped delays are not bothersome. |
0.61 to 0.70 |
|
3 |
C |
Stable operations with somewhat more restrictions in making mid-block lane changes than LOS B. Motorists will experience appreciable tension while driving. |
0.71 to 0.80 |
|
4 |
D |
Approaching unstable operations where small increases in volume produce substantial increase in delay and decreases in speed. |
0.81 to 0.90 |
|
5 |
E |
Operations with significant intersection approach delays and low average speeds. |
0.91 to 1.00 |
|
6 |
F |
Operations with extremely low speeds caused by intersection congestion, high delay and adverse signal progression. |
Greater than 1.00 |
Table 3. Level of service for all roads
|
Sr.No. |
Location |
Period |
PCU/hr. |
Width of road per lane (m) |
No. of lanes |
Design Service Volume (DSV)/hr |
V/C ratio |
LOS |
|
01 |
Thana Chowk Road |
Morning Peak Hour |
379.95 |
3.75 |
1 |
550 |
0.690 |
B |
|
Evening Peak Hour |
334.45 |
3.75 |
1 |
550 |
0.608 |
B |
||
|
02 |
Neelam Chowk Road |
Morning Peak Hour |
257.55 |
3.5 |
1 |
550 |
0.468 |
A |
|
Evening Peak Hour |
276 |
3.5 |
1 |
550 |
0.501 |
A |
||
|
03 |
Bata Chowk Road |
Morning Peak Hour |
178.2 |
3.5 |
1 |
550 |
0.324 |
A |
|
Evening Peak Hour |
230.25 |
3.5 |
1 |
550 |
0.418 |
A |
||
|
04 |
Churi Bazaar Road |
Morning Peak Hour |
237.1 |
3.5 |
1 |
550 |
0.431 |
A |
|
Evening Peak Hour |
254.3 |
3.5 |
1 |
550 |
0.462 |
A |
||
|
05 |
Mahila College Road |
Morning Peak Hour |
241.4 |
3.5 |
1 |
550 |
0.438 |
A |
|
Evening Peak Hour |
236.55 |
3.5 |
1 |
550 |
0.430 |
A |
||
|
06 |
Railway Station Road |
Morning Peak Hour |
450.8 |
3.75 |
1 |
550 |
0.819 |
D |
|
Evening Peak Hour |
435.85 |
3.75 |
1 |
550 |
0.792 |
C |
||
|
07 |
Ganga Sagar Chowk Road |
Morning Peak Hour |
420.55 |
3.75 |
1 |
550 |
0.764 |
C |
|
Evening Peak Hour |
418.6 |
3.75 |
1 |
550 |
0.761 |
C |
||
|
08 |
Old Bus Stand Road |
Morning Peak Hour |
375.1 |
3.75 |
1 |
550 |
0.682 |
B |
|
Evening Peak Hour |
347.2 |
3.75 |
1 |
550 |
0.631 |
B |
||
|
09 |
Bara Bazaar Road |
Morning Peak Hour |
297.95 |
3.75 |
1 |
550 |
0.541 |
A |
|
Evening Peak Hour |
284.4 |
3.75 |
1 |
550 |
0.517 |
A |
||
|
10 |
Chavaccha Mor |
Morning Peak Hour |
291.95 |
3.5 |
1 |
550 |
0.530 |
A |
|
Evening Peak Hour |
311.05 |
3.5 |
1 |
550 |
0.565 |
A |
Researcher employed “classical” statistical approaches to predicting traffic; going forward over the years, data driven approaches have become the most discussed field of analysis in the literature, with a rich variety of algorithmic specifications, as effectively exposed by Andrea and Federico [14]. The authors reviewed the last decade of literature, starting from 2004, citing for the previous period three papers: by Vlahogianni, et al. [15], for short-term traffic forecasting literature and related conceptual and methodological issues up to 2003; by Adeli [16] and by Van Lint and Van Hinsbergen [17], for neural network and artificial intelligence applications to short-term traffic forecasting. Traditional methods, generally based on quantitative measurements of average time between vehicles and thresholds, fail to take into account the inherent vagueness of the driving process [18]. As a result of different conditions and driver’s perception, level of service is different at the signalized and unsignalized intersections [19].
Escalona, et al. [20] studies the effect of two service-level measures on the design of a critical-level policy for fast-moving items. Level of Service analysis for future traffic growth helps to relate the future ease of movement of traffic on the existing traffic facilities or road networks. It helps to plan a better strategies of transport system planning including development of road networks, traffic furniture’s and related facilities. Table 3 Level of Service Criteria based on V/Capacity ratio shows the LOS & V/C ratio. LOS is converted into percentile for the generalized LOS value of the city traffic road network on the basics of AADT as shown in Table 4.
Considering the LOS of the various road networks of the city in a generalized condition, the Table 5 shows the percentile average analysis of the LOS.
The generalized LOS of the city traffic is related to the AADT of the city. Hence, future LOS analysis is totally depending upon the relation of LOS & AADT. AADT & LOS are inversely proportional to each other.
Table 6 shows the future LOS of the city road networks and Figure 1, represents the same also.
Table 4. Level of service criteria based on V/capacity ratio percentile
|
Sr.No. |
LOS |
Description |
V/C (Percentile) |
|
1 |
A |
Free flow conditions with unimpeded maneuverability. Stopped delay at signalized intersection is minimum. |
100 |
|
2 |
B |
Reasonably unimpeded operations with slightly restricted maneuverability. Stopped delays are not bothersome. |
90 |
|
3 |
C |
Stable operations with somewhat more restrictions in making mid-block lane changes than LOS B. Motorists will experience appreciable tension while driving. |
80 |
|
4 |
D |
Approaching unstable operations where small increases in volume produce substantial increase in delay and decreases in speed. |
70 |
|
5 |
E |
Operations with significant intersection approach delays and low average speeds. |
60 |
|
6 |
F |
Operations with extremely low speeds caused by intersection congestion, high delay and adverse signal progression. |
50 |
Table 5. Percentile average analysis of LOS
|
Sr.No. |
Location |
Period |
LOS |
Percentile |
|
01 |
Thana Chowk Road |
Morning Peak Hour |
B |
90 |
|
Evening Peak Hour |
B |
90 |
||
|
02 |
Neelam Chowk Road |
Morning Peak Hour |
A |
100 |
|
Evening Peak Hour |
A |
100 |
||
|
03 |
Bata Chowk Road |
Morning Peak Hour |
A |
100 |
|
Evening Peak Hour |
A |
100 |
||
|
04 |
Churi Bazaar Road |
Morning Peak Hour |
A |
100 |
|
Evening Peak Hour |
A |
100 |
||
|
05 |
Mahila College Road |
Morning Peak Hour |
A |
100 |
|
Evening Peak Hour |
A |
100 |
||
|
06 |
Railway Station Road |
Morning Peak Hour |
D |
70 |
|
Evening Peak Hour |
C |
80 |
||
|
07 |
Ganga Sagar Chowk Road |
Morning Peak Hour |
C |
80 |
|
Evening Peak Hour |
C |
80 |
||
|
08 |
Old Bus Stand Road |
Morning Peak Hour |
B |
90 |
|
Evening Peak Hour |
B |
90 |
||
|
09 |
Bara Bazaar Road |
Morning Peak Hour |
A |
100 |
|
Evening Peak Hour |
A |
100 |
||
|
10 |
Chavaccha Mor |
Morning Peak Hour |
A |
100 |
|
Evening Peak Hour |
A |
100 |
||
|
Average |
93.5 |
|||
|
Generalized LOS |
B |
|||
Table 6. Future LOS on the basis of AADT
|
Year |
AADT (PCU) |
LOS |
|
2017 |
15654.57 |
B |
|
2018 |
17188.71 |
B |
|
2019 |
18873.20 |
B |
|
2020 |
20722.77 |
B |
|
2021 |
22753.60 |
B |
|
2022 |
24983.45 |
C |
|
2023 |
27431.82 |
C |
|
2024 |
30120.13 |
C |
|
2025 |
33071.90 |
D |
|
2026 |
36312.94 |
D |
|
2027 |
39871.60 |
D |
|
2028 |
43779.01 |
E |
|
2029 |
48069.35 |
E |
|
2030 |
52780.14 |
E |
|
2031 |
57952.59 |
E |
|
2032 |
63631.94 |
E |
|
2033 |
69867.87 |
F |
|
2034 |
76717.11 |
F |
|
2035 |
84235.38 |
F |
|
2036 |
92490.44 |
F |
|
2037 |
101554.50 |
F |
(1) Level of service have been observed on the different roads in both morning session and evening session as shown in Table 3 & capacity shown in Table 1.
(2) At Thana Chowk road, the LOS is B with capacity of 379.95 PCU/hr. (higher traffic) in both morning and evening session. It means that there are reasonably unimpeded operations with slightly restricted maneuverability.
(3) At Neelam Chowk road, the LOS is A with capacity of 276 PCU/hr. in both morning and evening session. It means that there are free flow conditions with unimpeded maneuverability.
(4) At Bata Chowk road, the LOS is A with capacity of 230.25 PCU/hr. in both morning and evening session. It means that there are free flow conditions with unimpeded maneuverability.
(5) At Churi Bazaar road, the LOS is A with capacity of 254.3 PCU/hr. in both morning and evening session. It means that there are free flow conditions with unimpeded maneuverability.
(6) At Mahila College road, the LOS is A with capacity of 241.4 PCU/hr. in both morning and evening session. It means that there are free flow conditions with unimpeded maneuverability.
(7) At Railway Station road, the LOS is D with capacity of 450.8 PCU/hr. in morning session and LOS is C with capacity of 435.85 PCU/hr. in evening session. It means that there is approaching unstable operations where small increases in volume produce substantial increase in delay and decreases in speed in morning session and stable operations with somewhat more restrictions in making mid-block lane changes than LOS B in evening session.
(8) At Ganga Sagar Chowk road, the LOS is C with capacity of 420.55 PCU/hr. in both morning and evening session. It means that there are stable operations with somewhat more restrictions in making mid-block lane changes than LOS B.
(9) At Old Bus Stand road, the LOS is B with capacity of 375.1 PCU/hr. in both morning and evening session. It means that there are reasonably unimpeded operations with slightly restricted maneuverability.
(10) At Bara Bazaar road, the LOS is A with capacity of 297.95 PCU/hr. in both morning and evening session. It means that there are free flow conditions with unimpeded maneuverability.
(11) At Chavaccha Mor road, the LOS is A with capacity of 311.05 PCU/hr. in both morning and evening session. It means that there are free flow conditions with unimpeded maneuverability.
(12) The generalized LOS of the city road found to be B.
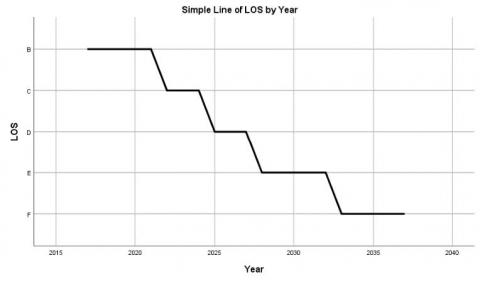
Figure 1. Estimated LOS as per future AADT
(13) As shown in Figure 1, it has been found that, after 05 years, the LOS will decrease from B to C; after 03 years, from C to D; after 03 years, from D to E; after 05 years, from E to F, which means, LOS will reduce from time to time and the unimproved existing traffic system will create problem for the motorists and pedestrians.
(14) Despite of good level of service, maximum road cause congestion due to unauthorized parking and unauthorized markets besides the road.
It has been concluded that the city which is approaching to the urban city also needs to be evaluated in respect with the existing traffic conditions to plan a better transportation facility. The level of service represents the qualitative measures of the traffic movement through the city road networks. The Figure 1 represents the future condition of LOS which creates a serious cause to think of planning the cities approaching the urban cities. This research can also be executed in macro scopic level. This traffic systems may be simulated for a better result.
The author acknowledges and express the gratitude for the motivation & support of Civil Engineering Department of University
[1] Tiwari, A., Chauhan, J. (2017). Traffic study on mid-block section & intersection. International Journal of Innovative Research in Science, Engineering and Technology, 6(5): 7632-7639. https://doi.org/10.15680/IJIRSET.2017.0605044
[2] Navandar, Y.V., Dhamaniya, A., Patela, D.A. (2019). Empirical analysis of level of service based on users perception at manual tollbooth operation in India. Transportation Research Procedia, 37: 314-321. https://doi.org/10.1016/j.trpro.2018.12.198
[3] Highway Capacity Manual. (2000). Chapter20-two lane highway.
[4] Teodorović, D., Janić, M. (2017). Chapter 5 - Capacity and Level of Service. Transportation Engineering Theory, Practice and Modeling 2017, pp. 197-292. https://doi.org/10.1016/B978-0-12-803818-5.00005-6
[5] Sarna, A.C., Jain, P.K., Chandra, G. (1989). Capacity of urban roads - a case study of Delhi and Bombay. Highway Research Bulletin, 40: 1-38.
[6] Panda, H., Pundir, R.S. (2002). Problems and possible solutions for better traffic management: A case study of Vadodara-Ahmedabad section of national highway eight. Institute of Rural Management.
[7] Capacity and Quality of Service of Two-Lane Highways, Transportation Research Board, National Research Council, NCHRP 3-55(3), November 1999.
[8] Wu, N. (1998). The proposed new version of German Highway Capacity Manual. Proceeding of the International Conference on Traffic and Transportation Studies, Beijing, China, July 1998. ASCE, Reston, USA.
[9] Padshala, A. (2014). Traffic studies of urban mid-block section: A case study of Pragatinagar to Akhbarnagar & Akhbarnagar to Ranip Cross road. International Journal of Research in Engineering and Technology, 03(06): 45-54. https://doi.org/10.15623/ijret
[10] Mahmoud, A., Reza, M., Fatemeh, J. (2013). Determination the capacity of two-lane suburban roads with neutral networks and effect of speed on level of service. Eur. Transp. Res. Rev., (2013)5: 179-184. https://doi.org/10.7256/2305-560x.2014.3.10649
[11] IRC-64. (1990). Guidelines for Capacity of Roads for Rural Areas. The Indian Road Congress.
[12] Highway Research Station, Madras. (1980). Report on Research Project R-3, First Year Results of Continuous Traffic Count Station on NH 45 in Tamil Nadu.
[13] IRC-106. (1990). Guidelines for capacity of urban roads in plain areas. The Indian Road Congress.
[14] Andrea, P., Federico, R. (2018). Comparing practice-ready forecast models for weekly and monthly fluctuations of average daily traffic and enhancing accuracy by weighting methods. Journal of Traffic and Transportation Engineering, 5(4): 239-253. https://doi.org/10.1016/j.jtte.2018.01.002
[15] Vlahogianni, E.I., Golias, J.C., Karlaftis, M.G. (2014). Short-term traffic forecasting: Where we are and where we're going. Transportation Research Part C: Emerging Technologies, 43(1): 3e19.
[16] Adeli, H. (2001). Neural networks in civil engineering: 1989-2000. Computer-Aided Civil and Infrastructure Engineering, 16(2): 126e142.
[17] Van Lint, J.W.C., Van Hinsbergen, C.P. (2012). Short term traffic and travel time prediction models, in artificial intelligence applications to critical transportation issues. In: Chowdhury, R., Sadek, S. (Eds.), Transportatin Research Circular. National Academies Press, Washington DC.
[18] Martín, S., Romana, M.G., Santos, M. (2016). Fuzzy model of vehicle delay to determine the level of service of two-lane roads. Expert Systems with Applications, 54: 48-60. https://doi.org/10.1016/j.eswa.2015.12.049
[19] Nedevska, I., Ognjenović, S., Murgul, V. (2016). Methodology for analysing capacity and level of service for roundabouts with one Lane (HCM 2000). Procedia Engineering, 187: 797-802. https://doi.org/10.1016/j.proeng.2017.04.442
[20] Escalona, P., Angulo, A., Weston, J., Stegmaier, R., Kauaka, I. (2019). On the effect of two popular service-level measures on the design of a critical level policy for fast-moving items. Computer & Operations Research, 107: 107-126. https://doi.org/10.1016/j.cor.2019.03.011