Touil Issam
© 2022 IIETA. This article is published by IIETA and is licensed under the CC BY 4.0 license (http://creativecommons.org/licenses/by/4.0/).
OPEN ACCESS
In this research, a statistical research methodology was used for a composite material consisting of a matrix of "unsaturated polyester" with different weight percentages reinforced with glass fibers with different weight percentages as well, in addition to sawdust with the following percentages 0%, 01%, 05%, 10% and this is in order to Knowing the weight ratio range for each of: Matrix / Reinforcement Material / Additive (Unsaturated Polyester / Glass Fiber / Sawdust - Po / gf / sd) to obtain a composite material with high mechanical properties - resistance to tensile forces. By analyzing the results of tensile tests to select the ideal test samples, we conclude that the recommended mass field or peak field is best for obtaining a composite material with high properties - resistance to tensile forces - consisting of an unsaturated polyester matrix reinforced with 300 g/m2 glass fibers added to sawdust as follows: The mass of unsaturated polyester - from 65% to 75% and from 20% to 30% of the mass of fiberglass contains the mass of the additive - sawdust in the amount of 1% to 10%, and this is in relation to the total mass of the sample of the composite material.
unsaturated polyester, glass fiber, tensile strength, sawdust
Over the past decades, materials known as composites have emerged; they are a combination of two or more materials characterized by their unique properties of light weight and high resistance, which qualify them for use as fabrication materials in various fields. These include space, transportation, defense, artificial organs industry, shipbuilding, automotive, among others.
The use of polymer-reinforced polymer-based composite materials has been adopted in most industrial products. Many researches have been devoted to the determination of the ideal ratios for glass fiber addition as a reinforcement to a polymeric-based composite to achieve the best mechanical properties – including tensile strength. Shash [1] studied some of the mechanical properties of a composite material based on unsaturated polyester reinforced with random glass fiber. Sadek Atta et al. [2] investigated the impact of adding different fibers to polyester-based composites on adhesion wear properties. Jubouri et al. [3] investigated the impact of fiber reinforcement on the thermal and mechanical properties of a composite material. Some studies have suggested that polymer-based composites can be strengthened with sawdust alone because of their low cost and availability [4, 5]. Indeed, several studies have emerged on the use of fiber and sawdust as reinforcement materials for composites [6, 7]. In 2001 studies were conducted on the surface of wood fibers using plasma to enhance fibers-matrix adhesion. The results obtained showed increased tensile strength compared to specimens with untreated fibers [6]. In 2002, a chemical treatment was performed on the surface of wood dust and wood fibers using Maleic Anhydride Grafted Polypropylene (MAPP) and the results showed improved tensile and flexural strengths in composites materials based on polypropylene reinforced with treated wood flour particles in comparison to untreated ones [8].
The current research aims to determine the effect of a 01%wt ,05%wt, 10%wt addition of sawdust to a composite based on unsaturated polyester reinforced with glass fiber at different weight ratios, and this by comparing it to the same composite but without sawdust addition 00%wt. For this purpose, tensile tests were conducted and results were compared.
1.1 Composite material
A compound material formed by adding one or more constituent materials, considered a reinforcing material, to a basic material called resin, as these materials do not melt and do not fuse together, but rather join together to form a new material that has distinctive properties. The polymeric basis - the subject of this research, the first method is the closed mold, which contains several techniques for the production of the composite material, such as: - compression molding - injection molding - transfer molding - .... As for the second method, the open mold method, which includes several techniques, including: spray up method - Tape lay up – filament wending – autoclave curing and the most important of which is hand lay up or what is known as manual stacking - used in this research - where the mold is painted with a non-stick material, then a thin layer of polymeric substrate is placed and the reinforcing material is dipped in it, then The rest of the base material is added using a brush or a roller on the surface of the mold, its most important applications: in the production of truck bodies and some machines - fishing boats and boats, some structures and parts, tanks and water containers and touch search...etc. It can also be a mixture of two or more primary materials on a microscopic scale to obtain a third material which possesses properties better than the primary materials in terms of weight, thermal conductivity, thermal insulation, acoustic insulation, fatigue resistance, temperature related behavior, aesthetics, weight, corrosion resistance, wear resistance, hardness and hardness...etc. However, it should be noted that not all of these characteristics improve at the same time and some characteristics may conflict with others.
In order to manufacture a composite material, at least two substances must be available:
The base material; also known as resin [9], which falls into three types:
•Metallic material characterized by significant weight and high hardness.
•Ceramic material characterized by light weight and low impact resistance.
•polymeric material, which can either be recycled such as thermoplastic materials like Polypropylene or non-recyclable and which are known as unsaturated polyester thermoset polymers.
1.2 Reinforcing material
This material is added to the resin in order to obtain mechanical and physical properties that the resin does not possess [10], and this by employing synthetic or natural fibers as reinforcements [11]. These include: Carbon fibers, glass fiber, which is the subject of our study, fine particulates (>1mm) or dispersed particulates (<1mm).
1.3 Sawdust
It is a by-product of the wood industry and is often used in the production of fertilizers. it is characterized by its extreme lightness and irregular form (Figure 1).
Figure 1. Sawdust
-SEM micrographs of sawdust:
It appears in Figure 2. Scanning electron microscopic images of sawdust before preparing the composite material in an irregular shape. It was noticed that there was a fiber-like layer on top of the sawdust particles, which is of a high carbon nature, meaning it contains a high percentage of carbon that helps to adhere to the base material - the unsaturated polyester used in this research.
Figure 2. SEM micrographs of sawdust
The purpose of this research is to assess the effect of adding sawdust to a composite material based on unsaturated polyester reinforced with random glass fibers at different weight ratios of 00%, 10%, 20%-30%, 40%, 50%, 60%, 70%, 80%, and 90% by conducting tensile tests on all the specimens, where we address the specific steps and procedures for tensile testing and in addition to the device parameters used in axis No 4. Tensile test.
We divided the materials used in the sampling process into two sets.
3.1 Set 1: in this set of specimens, we used:
3.1.1 A mold made of glass material
A resin made of unsaturated polyester to which a hardener was added to stimulate and speed up reaction, Polyester is characterized by its durability and flexibility, and this toughness and flexibility varies with the amount of tension after spinning. Polyester fibers absorb moisture under normal conditions by 0.5% moisture absorbed at normal temperatures, and the saturation degree does not exceed 0.8% and does not swell in water except by a small percentage.
The polyester material withstands heating for a long period without significant disintegration, as the melting point of polyester is 249 degrees Celsius, which is the highest melting point for chemical fibers [12].
Saturated polyester was selected for its various properties and features, including being easy to manufacture, cost effective, heat resistant, resistant to electrical insulation, possessing high chemical resistance, good resistance to harsh environmental conditions, ... etc. It is also widely used in the manufacture of naval structures, steamers, boats and in various other industrial applications.
Unsaturated polyester resin is the most commonly used. it consists of a (polyhydric alcohol) together with (multiple acid alcohol), which bind together with addition of a catalyst under appropriate temperature.
- The mechanical properties of the unsaturated polyester used in this research:
- Density .................... 1200 Kg/m3
- Tensile strength....... 42 MPA
- Elasticity modulus.... 2.8 GPA
- Elongation ............... 3.2%
Figure 3. Reinforcement material "Glass fiber"
3.1.2 Hardener- catalyst
It is a substance usually added to the resin i.e., unsaturated polyester, in a ratio of 2.3% in order to reach a complete curing of the saturated polyester as well as to speed up the reaction. It is worth mentioning that it is not recommended to use a hardener by more than 3% to speed up the curing of the mixture since this will cause cracks in the material.
Reinforcement material "glass fiber" of E-type was used. These were random glass fiber MAT with a density of 300gr/m2 (Figure 3).
3.1.3 Properties of the reinforcing material: Glass fiber used in the research
Low weight - highly resistant to breakage but can break when folded - subject to wear and tear if exposed to friction - cost effective - low thermal conductivity and good electric insulation.
We used MAT type E glass fiber (300 gr/m2).
As for its mechanical properties, these include:
- Density .......... 2500 Kg/m3
- Tensile strength....... 2400 MPA
- Elasticity modulus....... 85 GPA
- Elongation .............. 0.01 %
3.2 SET II
We used:
A mold was made of thick glass material (Figure 4).
Figure 4. Glass mold
A resin made of unsaturated polyester, to which a hardener was added. The latter is a catalyst material used to speed up reaction.
Sawdust at a rate of 01%, was used directly. The moisture factor is neglected in our study due to the preparation procedure.
The additive material (sawdust) was prepared according to the following steps:
The sawdust was oven-dried at 100℃ for 24h to remove the moisture.
Then it was ground using an electric mill.
Next, it was sieved using a 2mm mesh sieve.
3.3 Specimens'preparation
The specimens were prepared at the laboratory of the University of 20th August Skikda (Algeria) at a room temperature of 25℃, As the procedures and the specific step for preparing the samples we address in axis.
Two sets of specimens were prepared, the physical properties of samples are any properties that you can perceive or observe without changing the chemical identity of the sample. Any property that you can see, smell, touch, hear, detect and measure without having to perform a chemical reaction. Matter, colour, shape, sound, density, temperature, boiling point and viscosity, and because physical properties include such a set of properties, they are classified into extensive properties, as they depend on the amount of matter in the sample such as volume and mass, and intensive properties that do not depend on quantity Matter and its size in the body, but related to the boiling point and the state of matter and density.
3.3.1 Set I
These specimens were made of a composite material which consisted of unsaturated polyester (300gr/m2) of type E glass fiber randomly oriented at different weight ratios: 00%, 10%, 20%, 30%, 40%, 50%, 60%, 70%, 80%,90%, 100%.
3.3.2 Set II
These specimens were made of a composite material, which consisted of unsaturated polyester containing type E glass fiber (300gr/m2) randomly oriented at different weight ratios: 00%, 10%, 20%, 30%, 40%,50%, 60%, 70%, 80%,90%, 100%, to which sawdust was added (1%wt).
Preparation and mass weighing of the first set of specimens (unsaturated polyester resin/reinforcement:
This process was performed using an electronic balance. Unsaturated polyester resin used in this research had a density of 1.2g/cm3 for a specimen dimension of 20cm length x2cm width x2mm thickness. The resulting specimens, 9.6g of total net weight each, were taken as reference for varying the mass of the unsaturated polyester resin with glass fiber ratios of 00%, 10%, 20%, 30%,40%,50%, 60%, 70%, 80%,90%, 100%. The results for the first set are shown in Table 1 and Table 2.
We use the following coding throughout this article:
Mass ratios of unsaturated polyester resin: po.
Mass of Glass fiber: gf.
Mass of sawdust: sd.
Preparation and mass weighing of the second set of specimens po/gf / sd.
Table 1. State coding table Mass ratios of unsaturated polyester resin/ Mass of Glass fiber
|
Matrix “sawdust =0” |
Mass of unsaturated polyester resin (g) |
Mass of reinforcing Glass fiber (g) |
|
po100 / gf 00/sd 00 |
9.60g |
00g |
|
po 90 / gf 10/sd 00 |
8.64g |
0.96g |
|
po 80 / gf 20/sd 00 |
7.68g |
1.92g |
|
po 70 / gf 30/sd 00 |
6.72g |
2.88g |
|
po 60 / gf 40/sd 00 |
5.76g |
3.84g |
|
po 50 / gf 50/sd 00 |
4.80g |
4.80g |
|
po 40 / gf 60/sd 00 |
3.84g |
5.76g |
|
po 30 / gf 70/sd 00 |
2.88g |
6.72g |
|
po 20 / gf 80/sd 00 |
1.92g |
7.68g |
|
po 10 / gf 90/sd 00 |
0.96g |
8.64g |
Table 2. Mass ratios of unsaturated polyester resin % / glass fiber reinforcement %
|
Matrix “sawdust =0” |
Mass ratios of unsaturated polyester resin % |
Mass of Glass fiber (%) |
|
po100 / gf 00 /sd 00 |
100% |
00% |
|
po 90 / gf 10 /sd 00 |
90% |
10% |
|
po 80 / gf 20 /sd 00 |
80% |
20% |
|
po 70 / gf 30 / sd 00 |
70% |
30% |
|
po 60 / gf 40 /sd 00 |
60% |
40% |
|
po 50 / gf 50 /sd 00 |
50% |
50% |
|
po 40 / gf 60 /sd 00 |
40% |
60% |
|
po 30 / gf 70 /sd 00 |
30% |
70% |
|
po 20 / gf 80 /sd 00 |
20% |
80% |
|
po 10 / gf 90 /sd 00 |
10% |
90% |
These specimens were prepared and weighed in respect to: mass of the unsaturated polyester resin, mass of glass fiber and mass of sawdust, With an allowable error range of 10 mg g - 10 mg g accuracy for all samples.
This was performed by using an electronic balance (Figure 5).
Figure 5. Electronic balance
Table 3. State coding table Mass ratios of unsaturated polyester resin/ Mass of Glass fiber + 01% Mass of sawdust
|
Matrix |
Mass ratios of unsaturated polyester resin % |
Mass of Glass fiber (%) |
Mass of sawdust (%) |
|
Po99/ gf 00 /sd01 |
99% |
00% |
01% |
|
po 89 / gf 10 /sd01 |
89% |
10% |
01% |
|
po 79 / gf 20/sd01 |
79% |
20% |
01% |
|
po 69 / gf 30 /sd01 |
69% |
30% |
01% |
|
po 59 / gf 40/sd01 |
59% |
40% |
01% |
|
po 49 / gf 50/sd01 |
49% |
50% |
01% |
|
po 39 / gf 60/sd01 |
39% |
60% |
01% |
|
po 29 / gf 70/sd01 |
29% |
70% |
01% |
|
po 19 / gf 80/sd01 |
19% |
80% |
01% |
|
po 09 / gf 90/sd01 |
9% |
90% |
01% |
Table 4. Weight ratios of unsaturated polyester resin material and glass fiber reinforcement + 01 %wt added sawdust
|
Mass weight ratios of unsaturated polyester resin% / glass fiber % / 01% of sawdust |
Mass of unsaturated polyester block (g) |
Mass of Glass fiber(g) |
Mass of sawdust(g) |
|
Po99/ gf 00 /sd 01 |
9.504g |
00g |
0.096g |
|
po 89 / gf 10 /sd 01 |
8.544g |
0.960g |
0.096g |
|
po 79 / gf 20/sd 01 |
7.584g |
1.92g |
0.096g |
|
po 69 / gf 30 /sd 01 |
6.624g |
2.88g |
0.096g |
|
po 59 / gf 40/sd 01 |
5.664g |
3.84g |
0.096g |
|
po 49 / gf 50/sd 01 |
4.704g |
4.80g |
0.096g |
|
po 39 / gf 60/sd 01 |
3.744g |
5.76g |
0.096g |
|
po 29 / gf 70/sd 01 |
2.784g |
6.72g |
0.096g |
|
po 19 / gf 80/sd 01 |
1.824g |
7.68g |
0.096g |
|
po 09 / gf 90/sd 01 |
0.864g |
8.64g |
0.096g |
Table 5. State coding table Mass ratios of unsaturated polyester resin/ Mass of Glass fiber + 05% Mass of sawdust
|
Matrix |
Mass ratios of unsaturated polyester resin % |
Mass of Glass fiber (%) |
Mass of sawdust (%) |
|
Po 95/ gf 00 /sd 05 |
95% |
00% |
05% |
|
po 85 / gf 10 /sd 05 |
85% |
10% |
05% |
|
po 75 / gf 20/ sd 05 |
75% |
20% |
05% |
|
po 65 / gf 30 / sd 05 |
65% |
30% |
05% |
|
po 55 / gf 40/ sd 05 |
55% |
40% |
05% |
|
po 45 / gf 50/ sd 05 |
45% |
50% |
05% |
|
Po 35 / gf 60/ sd 05 |
35% |
60% |
05% |
|
po 25 / gf 70/ sd 05 |
25% |
70% |
05% |
|
po 15 / gf 80/ sd 05 |
15% |
80% |
05% |
|
po 05 / gf 90/ sd 05 |
5% |
90% |
05% |
We weighed the mass of unsaturated polyester resin used in this research with a density of 1.2 g/cm3 in 20 cm length x 2cm width x 2 mm thickness specimens. The result was: 9.60 g of total net weight for each specimen. This is considered as the reference for varying the proportions of the mass of unsaturated polyester material and the mass ratios of glass fiber material in proportions of: 00%, 10%, 20%, 30%, 40%, 50%, 60%, 70%, 80%, 90%, 100%, while the weight ratios of the unsaturated polyester resin were as follow: 00%, 09%, 19%, 29%, 39%, 49%, 59%, 69%, 79%, 89%, 99%, +01% of sawdust. The results for the second set are shown in Table 3 and Table 4.
The same as the previous steps with the addition 05% of sawdust from Table 5 and Table 6.
And add 10% of sawdust from Table 7 and Table 8.
Table 6. Weight ratios of unsaturated polyester resin material and glass fiber reinforcement + 05 %wt added sawdust
|
Mass weight ratios of unsaturated polyester resin% / glass fiber % / 05% of sawdust |
Mass of unsaturated polyester block (g) |
Mass of Glass fiber(g) |
Mass of sawdust(g) |
|
Po95/ gf 00 /sd 05 |
9.12g |
00g |
0.48g |
|
po 85 / gf 10 /sd 05 |
8.16g |
0.960g |
0.48g |
|
po 75 / gf 20/ sd 05 |
7.2g |
1.92g |
0.48g |
|
po 65 / gf 30 / sd 05 |
6.24g |
2.88g |
0.48g |
|
po 55 / gf 40/ sd 05 |
5.28g |
3.84g |
0.48g |
|
po 45 / gf 50/ sd 05 |
4.32g |
4.80g |
0.48g |
|
Po 35 / gf 60/ sd 05 |
3.36g |
5.76g |
0.48g |
|
po 25 / gf 70/ sd 05 |
2.4g |
6.72g |
0.48g |
|
po 15 / gf 80/ sd 05 |
1.44g |
7.68g |
0.48g |
|
po 05 / gf 90/ sd 05 |
0.48g |
8.64g |
0.48g |
Table 7. State coding table Mass ratios of unsaturated polyester resin/ Mass of Glass fiber + 10 % Mass of sawdust
|
Matrix |
Mass ratios of unsaturated polyester resin % |
Mass of Glass fiber (%) |
Mass of sawdust (%) |
|
Po 90/ gf 00 /sd10 |
90% |
00% |
10% |
|
po 80 / gf 10 / sd10 |
80% |
10% |
10% |
|
po 70 / gf 20/ sd10 |
70% |
20% |
10% |
|
po 60 / gf 30 / sd10 |
60% |
30% |
10% |
|
po 50 / gf 40/ sd10 |
50% |
40% |
10% |
|
po 40 / gf 50/ sd10 |
40% |
50% |
10% |
|
Po 30 / gf 60/ sd10 |
30% |
60% |
10% |
|
po 20 / gf 70/ sd10 |
20% |
70% |
10% |
|
po 10 / gf 80/ sd10 |
10% |
80% |
10% |
|
po 00 / gf 90/ sd10 |
00% |
90% |
10% |
Table 8. Weight ratios of unsaturated polyester resin material and glass fiber reinforcement + 10 %wt added sawdust
|
Mass weight ratios of unsaturated polyester resin% / glass fiber % / 10% of sawdust |
Mass of unsaturated polyester block (g) |
Mass of Glass fiber (g) |
Mass of sawdust(g) |
|
Po 90/ gf 00 /sd10 |
8.64g |
00g |
0.96g |
|
po 80 / gf 10 / sd10 |
7.68g |
0.96g |
0.96g |
|
po 70 / gf 20 / sd10 |
6.72g |
1.92g |
0.96g |
|
po 60 / gf 30 / sd10 |
7.76g |
2.88g |
0.96g |
|
po 50 / gf 40/ sd10 |
4.8g |
3.84g |
0.96g |
|
po 40 / gf 50/ sd10 |
3.84g |
4.80g |
0.96g |
|
Po 30 / gf 60/ sd10 |
2.88g |
5.76g |
0.96g |
|
po 20 / gf 70/ sd10 |
1.92g |
6.72g |
0.96g |
|
po 10 / gf 80/ sd10 |
0.96g |
7.68g |
0.96g |
|
po 00 / gf 90/ sd10 |
00g |
8.64g |
0.96g |
3.4 Method
The specimens of the first set were made of a composite material which consists of unsaturated polyester reinforced with randomly oriented glass fiber of type E (300gr/m2) in weight ratios of 00%, 10%, 20%, 30%, 40%, 50%, 60%, 70%, 80%, 90%, 100% according to the following method:
3.4.1 First set: Po / gf /sd 00
A thin layer of Vaseline was spread on the surface of the mold to allow easy removal of the composite. 2%wt of a hardener was added to the unsaturated polyester and the mixture was thoroughly mixed. Next, a first amount of the mixture was poured into the mold and spread using a brush to ensure an even distribution. Then, random glass fiber was cut to the dimensions of the mold and spread on the mixture. Finally, the remaining mixture was poured onto the layer of glass fiber and rolled using a metal roller (Figure 6) to ensure even distribution and removal of air bubbles, The dimensions of the metal cylinder shown in Figure 6 are about 2 cm. The length of the metal cylinder is 01 cm in diameter.
Figure 6. Metal roller
3.4.2 The second set: Po / gf /sd 01
The same steps followed for the preparation of the first set of specimens were performed; the only difference being the addition of sawdust (01%wt). After addition of the remaining mixture of unsaturated polyester with glass fiber using a metal roller to ensure regular distribution. It should be noted that the process of pouring the mixture and preparing the specimens should be performed quickly to prevent a hardening of the mixture before the completion of the preparation. Ten (10) specimens of composite material reinforced with glass fibers (300g/m2) were obtained.
In the last stage, the specimens were left at moderate temperature for 48 hours until they dried and cured before tensile tests could be performed (Figure 7), The temperature is 25 degrees Celsius, which is the laboratory temperature.
Figure 7. Composite material specimens
3.4.3 The third set: Po / gf /sd 05
The same steps followed for the preparation of the first set of specimens were performed; the only difference being the addition of sawdust (05%wt)
3.4.4 The fourth set: Po / gf /sd 10
The same steps followed for the preparation of the first set of specimens were performed; the only difference being the addition of sawdust (10%wt).
- SEM micrographs of composites: Figure 8: SEM micrographs of composites: po 70 / gf 20/ sd10 and po 69 / gf 30 /sd01.
Figure 8. SEM micrographs of composites: Po/ gf /sd
The specimens were prepared in the following dimensions: 20cm length x 2cm width x 2mm thickness.
The tests were carried out at the Mechanical Measurement Laboratory in the Mining Department of Badji Mokhtar Annaba University (Algeria) using a Zwich Roell type Z 50 -KN50 testing machine (Figure 9).
Figure 9. Zwich Roell type Z 50 -50 KN testing machine
The specimens were axially fixed at both ends and a load was gradually applied at a rate of 50Kg/Min starting from zero until the breaking of the specimen while recording yield stress and plastic strain. The Tensile strength which expresses the breaking stress of the composite according to the following relation:
4.1 Examination steps
1- The length of the sample (Lo), its width (bo) and its thickness (to) are measured before conducting the test.
2 - The sample is installed in the general test device shown in Figure 9, with the device calibrated before conducting the test.
3- The force in (kN) is applied to the test model in a hydraulic way and gradually, and the readings of the applied force for each elongation are taken and recorded.
4 - The download process continues until the model fails and is interrupted, then the model is uploaded from the device and measurements are taken after the failure, which we need in the calculations, as will be mentioned later.
Note: Modern machines often show test results automatically after breaking, if the sample dimensions were entered into the machine before and after the test. If the case is otherwise, the machine will output the load and elongation values drawn in a curve or tabulated values. Calculate the tensile properties from the load and elongation curve as follows:
• Stress: It is calculated by dividing the load by the initial cross-sectional area. The result is called the geometric stress (its value differs from the real stress).
• Strain: It is calculated by dividing the elongation by the initial length of the parameter, and it is called the geometric strain (its value differs from the real strain).
• The engineering stress-strain curve can be drawn based on the previously calculated values.
• Tensile strength is the highest value of stress in the stress-strain curve.
• The yield strength is determined by the required yield criterion, the neutral yield strength and the yield strength at the total expansion of the curve.
• Calculate the ductility values, which are (elongation percentage and area decrease percentage) on the sample after fracture.
• The modulus of elasticity is calculated from the slope of the first straight part of the curve.
The AllroundLine Z050 traction machine is suitable for the most diverse applications. The test machines used (classic and ground model) of the AllroundLine Z050 range were equipped with test forces of 50 kN.
5.1 Tensile results for the first set Po / gf /sd 00
The tensile test was performed on the specimens of the first set consisting of a composite material consisting of unsaturated polyester reinforced by glass fiber (300 gr/m2) at different weight ratios, and the results of the resistance to stress R m expressed in MPA according to the Table 9.
Table 9. Results of the tensile for the first set
|
Matrix + sawdust =00 |
Cross section S (mm2) |
Tensile strength Rm (MPA) |
|
po100/ gf 00/ sd00 |
20 |
1,55 |
|
po 90 / gf 10/ sd00 |
20 |
52,53 |
|
po 80 / gf 20/ sd00 |
20 |
63,18 |
|
po 70 / gf 30/ sd00 |
20 |
66,92 |
|
po 60 / gf 40/ sd00 |
20 |
61,10 |
|
po 50 / gf 50/ sd00 |
20 |
54,01 |
|
po 40 / gf 60/ sd00 |
20 |
48,13 |
|
po 30 / gf 70/ sd00 |
20 |
/ |
|
po 20 / gf 80/ sd00 |
20 |
/ |
|
po 10 / gf 90/ sd00 |
20 |
/ |
5.2 Results of the tensile tests for the second set: Po / gf /sd 01
The tensile tests were carried out on the second set of specimens comprising unsaturated polyester based composite reinforced with glass fiber (300g/m2) at different weight ratios to which 01%wt of sawdust was added. The results are shown in Table 10.
5.3 Results of the tensile tests for the third set: set: Po / gf /sd 05
The tensile tests were carried out on the third set of specimens comprising unsaturated polyester based composite reinforced with glass fiber (300g/m2) at different weight ratios to which 05%wt of sawdust was added. The results are shown in Table 11.
Table 10. Tensile strength results for a composite material based on unsaturated polyester reinforced by glass fiber + 1% sawdust
|
matrix |
Cross section S (mm2) |
Tensile strength Rm (MPA) |
|
Po99/ gf 00 /sd01 |
20 |
8,43 |
|
po 89 / gf 10 /sd01 |
20 |
55,42 |
|
po 79 / gf 20/sd01 |
20 |
65,02 |
|
po 69 / gf 30 /sd01 |
20 |
68,28 |
|
po 59 / gf 40/sd01 |
20 |
60,32 |
|
po 49 / gf 50/sd01 |
20 |
53,28 |
|
po 39 / gf 60/sd01 |
20 |
47,85 |
|
po 29 / gf 70/sd01 |
20 |
/ |
|
po 19 / gf 80/sd01 |
20 |
/ |
|
po 09 / gf 90/sd01 |
20 |
/ |
Table 11. Tensile strength results for a composite material based on unsaturated polyester reinforced by glass fiber + 05% sawdust
|
matrix |
Cross section S (mm2) |
Tensile strength Rm (MPA) |
|
Po 95/ gf 00 /sd 05 |
20 |
15,20 |
|
po 85 / gf 10 /sd 05 |
20 |
58,04 |
|
po 75 / gf 20/ sd 05 |
20 |
68,02 |
|
po 65 / gf 30 / sd 05 |
20 |
65,88 |
|
po 55 / gf 40/ sd 05 |
20 |
58,04 |
|
po 45 / gf 50/ sd 05 |
20 |
50,98 |
|
Po 35 / gf 60/ sd 05 |
20 |
42,08 |
|
po 25 / gf 70/ sd 05 |
20 |
/ |
|
po 15 / gf 80/ sd 05 |
20 |
/ |
|
po 05 / gf 90/ sd 05 |
20 |
/ |
5.4 Results of the tensile tests for the fourth set: Po / gf /sd 10
The tensile tests were carried out on the fourth set of specimens comprising unsaturated polyester based composite reinforced with glass fiber (300g/m2) at different weight ratios to which 10%wt of sawdust was added. The results are shown in Table 12.
Table 12. Tensile strength results for a composite material based on unsaturated polyester reinforced by glass fiber + 10% sawdust
|
matrix |
Cross section S (mm2) |
Tensile strength Rm (MPA) |
|
Po 90/ gf 00 /sd10 |
20 |
20,45 |
|
po 80 / gf 10 / sd10 |
20 |
56,98 |
|
po 70 / gf 20/ sd10 |
20 |
66,09 |
|
po 60 / gf 30 / sd10 |
20 |
62,56 |
|
po 50 / gf 40/ sd10 |
20 |
54,13 |
|
po 40 / gf 50/ sd10 |
20 |
45,12 |
|
Po 30 / gf 60/ sd10 |
20 |
/ |
|
po 20 / gf 70/ sd10 |
20 |
/ |
|
po 10 / gf 80/ sd10 |
20 |
/ |
|
po 00 / gf 90/ sd10 |
20 |
/ |
5.5 Graphs
Vernier Graphical Analysis Pro (Vernier, USA) was used to process the results of the tensile tests, During the experiment both the sample section and its effective length are usually measured, from which the stress and elongation are determined. In technical applications, the initial section is measured for ease and initial length, and the elongation values are recorded.
Figure 10. Tensile test results and proportions of fiberglass
Figure 11. Average tensile results of po% / gf% / sd%
Figure 12. Tensile test results po%/ gf%/ sd% by po%
The tensile strength is equal to the maximum tensile the specimen can withstand and is set for its dependence on the specimen section. After exceeding the tensile strength points, the material is said to have failed or failed, as it is not possible to avoid breaking one of the parts of the machine after exceeding the tensile strength point. In this study, we take the tensile strength values for all samples and enter the data for tensile experiments, and the following curves were obtained Figure 10, Figure 11 Figure 12.
5.6 Discussion and analysis
We can notice from graph 1 and through the tensile strength results curve for the four groups po% / gf% / sd% with respect to the change in the proportions of the reinforcement material - glass fibers to unsaturated polyester -, where we notice (Figure 10). It increases significantly with the addition of 10% weight and continues to increase until 30% addition as it reaches its maximum. After this value and starting at 40%, it begins to decrease gradually and slowly, eventually reaching the minimum tensile strength of 60% of the reinforcement. After this value and up to 90% of the reinforcement, it is difficult to obtain the results of tensile experiments due to the fragility of the samples of the composite material and the impossibility of its realization in some cases. This can be explained by the fact that the amount of unsaturated polyester resin is not sufficient to guarantee the bonding of the reinforcement material.
* which leads to weakening the material and reducing its tensile strength up to 60% of the reinforcement, and from this ratio to 90%, it is impossible to embody these samples.
When interpreting the curves of the four groups po% / gf% / sd% for the ratios of the support or reinforcing material - fiberglass -, the most important points were as follows:
• The tensile strength of the second group po/ gf /sd 01 is better than that of the first group po/ gf /sd 00 for the proportions of 00%, 10%, 20%, 30%.
• The tensile strength of the third group po/ gf /sd 05 is better than that of the second and first group for the proportions of 00%, 10%, 20%, 30%.
• The tensile strength of the fourth group po/ gf /sd 10 is better than that of the third, second and first group for the proportions of 00%, 10%, 20%, 30%.
• The tensile strength of the first group is better than that of the second, third and fourth groups with percentages of 40%, 50%, 60%.
• The tensile strength of the second group is better than that of the third and fourth groups with percentages of 40%, 50%, 60%.
• The tensile strength of the third group po/ gf /sd 05 is better than that of the fourth group po/ gf /sd 10 for 40%, 50%, 60%.
One can clearly see that the additive (sawdust material) in the second group po100/ gf 00 /sd 01 and the third group po100/ gf 00 /sd 05 and the fourth group po100/ gf 00 /sd 10 at the proportions 00% - 10% - 20% - 30% of the glass fibers played the role of reinforcement, where we notice that the value of the tensile strength is in an upward trend with the increase in the percentage of sawdust during this area 00% - 30% of the reinforcing material.
• We notice a significant decrease in the tensile strength results for the four groups beyond the maximum value at 30%. However, the samples of the second group show a faster decline compared to the samples of the first group, the third group shows a faster decline compared to the samples of the second and first group, and the fourth group also shows a faster decline compared to the samples of the third, second and first group.
• Peak field: It can be seen that the maximum value of the tensile strength of the four groups po % / fb / sd % is confined to the peak field between 20% - 30% of the ratios of the reinforcement material or the reinforcing material.
Peak points: are the maximum values, and by interpreting the results and curve, we find that the value of the peak point of the tensile strength for each of the composite materials of the first group (po 70 /gf 30/sd 00) is about (MPA 66,92), while the composite material for the second group (po 69 / gf 30 / sd01) consisting of 69% unsaturated polyester and reinforced with 30% glass fibers added to it 01% of sawdust, where we recorded the value of the peak point of tensile strength of about (MPA 68,28), where it had the best value compared to the rest of the results of the composite material with other ratios and for the rest of the groups, then followed by a close ratio of the composite material of the third group (po 75 / gf 20 / sd 05) consisting of 75% unsaturated polyester and reinforced with 20% glass fibers added to it 05% of sawdust with a value of the peak tensile strength point of about (MPA 68,02). As for the composite material of the fourth group (po 70 / fb20 / sd 10), we recorded the value of the peak point of the tensile strength by about (MPA 66.09), where we notice the convergence between the values of the peak points of the four groups (Figure 11).
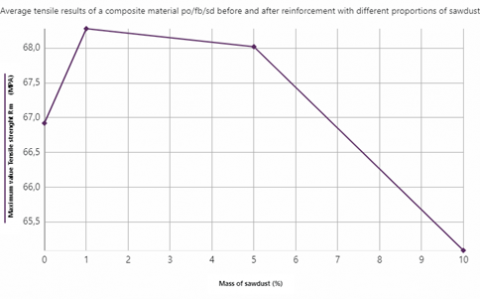
• Peak range: It can be seen that the maximum value of the tensile strength of the four groups po% / gf% / sd is confined to the peak range between 01% -10% of the proportions of the additive.
- Figure 12: In the third curve, the percentage change of the base material “unsaturated polyester” is curved in relation to the obtained tensile strength values, where we note that the tensile strength values are monitored starting from 35% of the base material “unsaturated polyester” for the composite material polyester / glass fibers. po/ gf /sd 00.
And starting from 40% of the base material "unsaturated polyester" for the composite material polyester / glass fibers / sawdust % po100 / gf 00 / sd. The four groups take an ascending curve until the “peak range” is between 65% to 75% of unsaturated polyester, it can be explained that the amount of unsaturated polyester resin is sufficient to ensure the bonding of the reinforcement material - glass fibers - and the additive - sawdust -, then we notice a decline The values for the four groups are up to 100% unsaturated polyester.
Where it is clearly noticed during the phase of decline from 75% to 100% of the percentage of the base material "unsaturated polyester" that the tensile strength values for the first group po/ gf / sd 00 are better than the results of the second group po/ gf / sd 01 to which 01% of sawdust is added. Wood, which in turn is better than the results of the third group po/ gf /sd05 added to it 05% of sawdust, which in turn is better than the results of the fourth group po/ gf /sd10 added to it 10% of sawdust, where it can be explained, the amount of unsaturated polyester resin is not enough to ensure the bonding of the reinforcement material - glass fibers - and the additive - sawdust, as the latter has become an additional burden to the reinforcement material that weakens the bond guarantee.
• Peak field: It can be seen that the maximum value of the tensile strength of the four groups po / gf %/sd % is confined to the peak field between 65% - 75% of the matrix or matrix ratios.
The most important points that can be drawn from the search results are the following:
•We note that the tensile strength of the specimens made only of unsaturated polyester without a reinforcing material is very low.
•We note that the higher is the percentage of the reinforcing material (glass fiber) the greater is its tensile strength, up to a maximum value. This can be attributed to fact that most of the stress applied during the tensile tests is borne by the reinforcing material (glass fiber). This allows to conclude that the key role in the composite material is that of the reinforcing material as shown by the tensile test.
•We note that each time we add another percentage of glass fiber reinforcement material to the specimens their tensile strength improves and this is due to the fact that the added glass fiber occupies more space within the matrix- allowing for a better distribution of the tensile strength and the load applied [13].
•It can be concluded that to obtain a maximum value of tensile strength for a composite based on unsaturated polyester reinforced with glass fibers (300 gr/m2) it needs only about 30% of the mass weight of the same reinforcing material; beyond that value the tensile strength starts to decrease.
•We may conclude that beyond the maximum value of 30% of added reinforcing material a decrease in tensile strength is observed, and this can be attributed to the fact that the amount of unsaturated polyester resin is not sufficient to ensure the binding between the resin and the reinforcement material, which leads to decreased tensile strength.
•One may also conclude that the third material (sawdust) exhibits the behavior of a reinforcing material as can be clearly be seen from the results of the relative tensile strength even though this improvement is relatively small.
•The peak field of a composite material with high characteristics - resistant to tensile forces - consisting of an unsaturated polyth matrix reinforced with glass fibers type mat 300 gr / m2 added to sawdust for long samples of hand molding, are as follows:
- Between 65% to 75% of the mass of the base material - unsaturated polyester - in relation to the total mass of the sample of the composite material.
- Between 20% to 30% of the mass of the reinforcement or reinforcing material - unsaturated polyester.
- Between 1% to 10% of the mass of the additive-sawdust.
- Correlation and integration relationship between the percentage of the base material, the percentage of the reinforcement material, and the percentage of the additive within those areas [14, 15].
|
Po |
Unsaturated Polyester |
|
gf |
Glass Fiber |
|
sd |
Sawdust |
|
F |
the maximum stress “Newton” |
|
B |
width of the specimen expressed in mm. |
|
e |
thickness of the specimen expressed in mm. |
|
l |
length of the specimen expressed in mm. |
[1] Shash, M. (2014). Studying the mechanical properties of composite material based on unsaturated polyester reinforced with random fiberglass, Syria: Al baath University, pp. 3-14. https://shamra-academia.com/show/57473096db27c.
[2] Sadiq Atta, A.S., Nasse, N.J., Abd-lrazaq, E.A. (2017). Studying the effect of adding different fiber types to polyester composite on the adhesive wear property. Al-Qadisiyah Journal for Engineering Sciences, 8(1): 1-14.
[3] Jubouri, A.A., Al-Moussawi, A.I., Sajid, A.K.A. (2009). Effect of fiber reinforcement ratio on thermal and mechanical properties of a polymeric composite material. Iraqi Journal of Mechanical and Materials Engineering, 2009(A(s)): 70-82. https://search.emarefa.net/detail/BIM-330787.
[4] Dobreva, D., Nenkova, S., Vasileva, S. (2006). Morphology and mechanical properties of polypropylene – wood flour composites. BioResources, 1(2): 209-219. https://doi.org/10.15376/biores.1.2.209-219
[5] Barbu, M.C., Réh, R., Irle, M. (2013). Wood – based composites. Research Developments in Wood Engineering and Technology, pp. 2-42. https://doi.org/10.4018/978-1-4666-4554-7.ch001
[6] Zoalfokkar, K. (2001). The effects of chemical treatment of wood cinder on the mechanical properties of the composite materials (polyester-wood excelsior) bio Graphies and abstracts. 6th International Conference on Wood Fibers – Plastic Composites, USA.
[7] Xue, Y.B., Veazie, D., Glinsey, C., Wright, M., Rowell, R.M. (2003). Mechanical properties of wood fiber composites under the influence of temperature and humidity. Seventh International Conference on Woodfiber Plastic Composites (and Other Natural Fibers), Madison, Wisconsin, USA.
[8] Starck, N.M., Rowlands, R.E. (2003). Effects of wood fiber characteristics on mechanical properties of wood/polypropylene composites. Wood and Fiber Science: Journal of the Society of Wood Science and Technology, USA, 35(2): 167-174.
[9] Chohan, J.S., Boparai, K.S., Singh, R., Hashmi, M.S.J. (2020). Manufacturing techniques and applications of polymer matrix composites: A brief review. Advances in Materials and Processing Technologies. https://doi.org/10.1080/2374068X.2020.1835012
[10] Gay, D., Hoa, S.V., Tsai, S.W. (2003). Composite Materials Design and Applications. CRC Press, LLC. https://doi.org/10.1201/9781420031683
[11] Kaw, A.K. (2005). Mechanics of Composite Materials, 2nd Edition. Taylor & Francis Group, LLC. https://doi.org/10.1201/9781420058291
[12] Choi, S., Kim, J., Kwon, M. (2022). The effect of the physical and chemical properties of synthetic fabrics on the release of microplastics during washing and drying. Polymers, 14(16): 3384. https://doi.org/10.3390/polym14163384
[13] Richard, F., Perreux, D. (2001). The safety factor calibration of laminates for long،term applications: behavior model and reliability method. Composites Science and Technology, 61(14): 2087-2094. https://doi.org/10.1016/S0266-3538(01)00154-3
[14] de Kok, J.M.M., Meiger, H.E.H. (1999). Deformation, yield and fracture of unidirectional composites in transverse loading. 1. Influence of volume fraction and test-temperature. Composites Part A: Applied Science and Manufacturing, 30(7): 905-916. https://doi.org/10.1016/S1359-835X(98)00170-5
[15] Mesquita, F., Swolfs, Y., Lomov, S.V., Gorbatikh, L. (2019). Ply fragmentation in unidirectional hybrid composites linked to stochastic fibre behaviour: A dual-scale model. Composites Science and Technology, 181: 107702. https://doi.org/10.1016/j.compscitech.2019.107702