Reem Alaa Mohammed* | Marwah Subhi Attallah | Aseel B. Al-Zubidi | Layth Al-Gebory
© 2022 IIETA. This article is published by IIETA and is licensed under the CC BY 4.0 license (http://creativecommons.org/licenses/by/4.0/).
OPEN ACCESS
Nowadays, the trend to benefit from environmentally friendly waste and recycle it instead of incineration processes that can cause pollution in the environment to have a clean and green environment that is free from pollution and can work for a long time without consumption and damage. This study is designed to manufacture prosthetics limbs from PMMA (polymethyl methacrylate) reinforced with different weight percentages of waste paper layers (0%, 3%, 6%, 9%, and 12%) by the “hand lay” method. The tensile, flexural, impact, compression, and hardness of these composites are tested before and after adding weight percentages waste paper layers to determine the mechanical properties behavior. The average values of all the samples are collected and analyzed by one-way analysis of variance (ANOVA) to interpret the results. When discussing the results of mechanical tests, it is found that the addition (12%-waste paper layers) to (PMMA) increased the average values (tensile, flexural, impact, compression, and hardness) by 142.1%, 532.3%, 146%, 99.2%, and 6.37%; respectively, compared to the mean values of other samples. It is clear from this work there is an improvement in the properties of PMMA after strengthening with waste paper layers.
natural waste (paper fibers), mechanical properties, poly methyl methacrylate polymer
Natural waste is one of the causes of environmental pollution and one of the big problems facing society. In order to solve this problem, we recycle, for example, paper waste to take advantage of the natural fibers found in paper material [1]. Natural fibers are advantageous because they are renewable, have high specific strength, are inexpensive in cost and density, have acceptable mechanical qualities, are easily separated, are biodegradable, and have excellent thermal and acoustic insulation capabilities [2]. Usually, natural fibers are employed as matrix-strengthening compounding in thermoplastics and resins. Polymethyl methacrylate (PMMA) is one of the most widely used materials in prosthetics. Successfully used for prosthetics for several reasons, including ease of treatment, lightweight, and low cost compared to previously used metals [3]. Poly (methyl methacrylate) has many and varied uses including a clear glass substitute, redirecting daylight, medical techniques, its use in dentistry, acrylic prosthetics, artificial teeth, artistic and aesthetic uses [4]. A prosthesis is an interchangeable device that is worn and used as needed. Researches are facing considerable effort in prosthetic research towards the creation of artificial limbs as a substitute for real limbs [5]. Numerous factors, such as illnesses, mishaps, and congenital deformities, as well as how the human body changes with age owing to growth or a change in body weight, contribute to the urgent need for prostheses [6]. A portion of the bone was replaced in 1993 with a titanium alloy component that is more durable than the original bone but loses the bone's capacity to adjust to varied stresses [7]. The constant need to change or amend the prosthetic limbs has become cost huge sums due to the cost of the materials used. Therefore, many scientists and engineers have focused on using natural fibers as an alternative to synthetic fibers with polymers [8]. There are many reasons for using polymeric composite filled with natural fibers as an alternative to polymeric composite filled with synthetic fibers is that they have good mechanical properties, low cost, wear resistance, lightweight, corrosion-resistant. There are comprehensive studies on the mechanical properties of PMMA filled with natural fibers. The tensile and fatigue tests have been studied for five groups of composite samples, the first group (EP.-Perlon fiber), the second group (EP.-glass fibers), the third group (EP.-carbon fibers), the fourth group (EP.-carbon and glass fibers), and the fifth group (EP.-carbon and glass fibers-1% micro and nano SiO2 particles). The results detect that sample (EP.-carbon fibers) has a high tensile and fatigue values compared to other groups [9]. The impact test analysis has been studied for three groups of samples, the first group consists of (PMMA-4 Per. layers+2 carbon fiber layer+4 Per. layers), the second group consists of (PMMA-3 Per.n layers+2 carbon fiber layer+3 Per. layers) and the third group consists of (PMMA-3 Per. layers +1 layer of carbon fiber +3 Per. layers). It was observed from the results of the impact test that the third group samples (PMMA-3 Per. layers+1 layer of carbon fiber +3 Per. layers) gave the best value of impact strength when compared to other samples [10]. There have been descriptions of the tensile and buckling for composites made from (PMMA-4 Per. layers-1 jute, 2 jute, 3 jute layers-4 Per. layers), and the fibers were arranged with three angles (0°/90°) and (45). The results showed that the samples (PMMA-4 layers Perlon-1 jute, 2 jute, 3 layers jute-4 layers Perlon) at the angle (0°/90°) gave the best properties [11]. The main objective of this work is to add different weight fractions of paper waste layers (3%, 6%, 9%, and 12%) to PMMA (Poly Methyl methacrylate). Tensile, flexural, impact, compression, and hardness tester are investigated for these samples. The average values of all the samples were collected and the data obtained were analyzed by one-way analysis of variance (SPSS) to interpret the results. Also, this study aims to rid the environment of waste and benefit from it in medical industries.
2.1 Prepare materials and samples
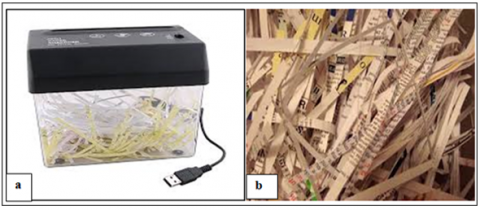
Waste A4 paper was utilized for this study (damaged paper), which is found in offices, official departments, universities, and ministries, as shown in Figure 1. Figure (1- a) shows the shredder device used to cut paper and Figure (1-b) shows the fibers from the waste paper after they are damaged. The paper fibers have a size of (18 cm) length, (5mm) width, and (1mm) thickness. Table 1 shows the characteristics of the waste paper [12]. PMMA (polymethyl methacrylate) is used as a liquid with a hardener and the mixing ratio (80:20) using manual mixing and Table 2 illustrates the characteristics and features of PMMA that we obtained from the company [13]. Due to its mild qualities, simplicity of handling and treatment, and inexpensive cost, PMMA is frequently favored over poly since it does not contain the potentially dangerous "Bisphenol A" that may be found in poly. Unreinforced PMMA behaves brittle under the influence of any load because when a load is applied it will initially crack and the crack will start to grow and thus will break. The polymethyl methacrylate was strengthened by adding the weight fraction of the waste paper fibers at proportions (3%, 6%, 9%, and 12%) at room temperature of 25℃. Glass molds with dimensions (18 x 15 cm) were prepared for the manufacture of samples by (hand casting) method. To prevent the resin from adhering to the mold, a nylon layer (thermal paper of nylon) composed of PVA rather than vaseline is placed on the inside face of the mold. Waste paper fibers were prepared with dimensions (175 x 145 mm) based on the weight fractions and Table 3 shows the composition of the samples. The samples are treated in an oven at a temperature of (60℃) for a duration of (24) hours to finish the solidification process after being placed in the mold at room temperature “60 minutes”. This procedure is crucial for achieving the best bonding between polymer chains and for reducing tensions brought on by the preparation and final solidification of the specimens [14]. For each test, specimens were cut using a CNC machine (control computer numerical) in accordance with ASTM.
Figure 1. (a) The shredder device (b) The fibers from waste paper
Table 1. The characteristics of the waste paper
|
Properties |
Values |
|
Moisture content (%) |
2.67 |
|
Gramm age (gm/m2) |
80 |
|
Aspect ratio |
100 |
|
Specific gravity |
0.98 |
|
Absorption % |
198 |
Table 2. Characteristics of PMMA (Poly methyl methacrylate)
|
Properties |
Values |
|
Young's modulus (GPa) |
2.24-3.24 |
|
Tensile strength (MPa) |
48.3-72.4 |
|
Percentage elongation |
2-5.5 |
|
Thermal conductivity (W/m.K) at 23ºC |
0.17-0.25 |
|
Density (g/cm³) |
1.19 |
|
Poisson’s ratio |
0.35 |
Table 3. Specimens' composition
|
Specimens |
Composition |
|
1 |
Pure PMMA |
|
2 |
PMMA- 3% weights fraction waste paper layers |
|
3 |
PMMA- 6% weights fraction waste paper layers |
|
4 |
PMMA-9% weights fraction waste paper layers |
|
5 |
PMMA-12% weights fraction waste paper layers |
2.2 Mechanical properties tests
Tensile tested according to “ASTM D 638M-87 b” [15], using a “cross speed” stress rate tensile machine (5 mm/min-1) produced by the Laryee Company (China). With a three-point test and a crosshead speed (strain rate) of 5 mm/min under load 5 KN, the flexural was evaluated in accordance with "D 790-86" [16]. The impact was tested according to "ISO-180" [17] (Izod Charpy). The compression was tested according to "ASTM D- 695" [18]. Shore D hardness is measured "ASTM D 2240" [19].
The average values of all the tests were collected and analyzed data by one-way analysis of variance to interpret the results. The purpose of the ANOVA is to determine the differences between samples for all tests and then set the statistical significance at (P<0.05).
4.1 Tensile strength
The results of the mean tensile strength and standard deviation of the samples (PMMA - 3%, 6%, 9%, and 12% wt. Paper layers waste) are appearing in Table 4 and Figure 2. Noted that the mean values of samples (PMMA- 3%, 6%, 9%, and 12% wt. paper layers waste) (64 ±4.583, 77.3 ±2.082, 92.67±3.512, 107.3±2.517 MPa) respectively, are increased by increasing weight fraction of paper layers waste when compared with the average of specimens (PMMA) (44.3±4.509 MPa). Because (PMMA) specimens without any reinforcement have less mechanical properties compared to specimens filled with fibers (waste paper). The presence of these fibers, the strength of the bond between the polymer and the fibers (waste paper) increases because they contain a high percentage of cellulose and thus these specimens can resist the tensile strength imposed during testing on the prosthesis, these results agree with the researchers [20, 21].
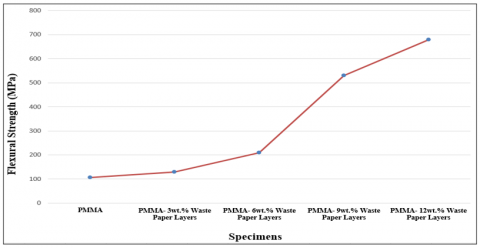
4.2 Flexural strength
The flexural strength is the maximum stress that the samples can withstand before failure [22]. Flexural strength means and standard deviation values are displayed in Table 5 and Figure 3 for samples composite (PMMA - 3%, 6%, 9%, and 12% wt. paper layers waste). The results of the Table and Figure make it clear that the average flexural strength values rise as the weight fraction of the reinforcement (paper waste layers) increases. The mean values of the flexural strength of the pure samples (PMMA) were (107.3 ± 3.215 MPa), when comparing to the values mean of other samples it was found that weight fraction (12% wt. waste paper layers) improved the flexural strength by (532.2%). Usually, the fillers are stronger and stiffer than the matrix because they have a higher flexural strength than a matrix [23].
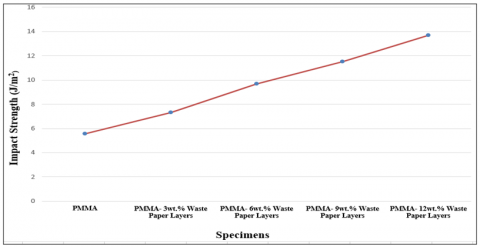
4.3 Impact strength
Table 6 and Figure 4 show the results of the average values of the maximum energy absorbed for samples (PMMA - 3%, 6%, 9%, and 12% weight of waste paper layers) before they break. The mean impact strength values of the samples (PMMA) without any filler were (5.567 ± 0.4163 J/m2). While the average values of the impact strength began to increase gradually when adding (3%, 6%, 9%, 12% wt. waste paper layers) to (PMMA). The highest average impact resistance of the samples was (PMMA-12 wt%. Waste paper layers) (13.700 J/m2±0.2168). Since thermoplastics are often weak, introducing fibers (waste paper layers) to polymer (PMMA) prevents fractures from spreading, which is the cause of the rise in (impact resistance) values, these results agree with [24].
Table 4. The means tensile strength for samples
|
Specimens |
N. |
Mean MPa |
Std. Deviation |
95% Confidence Interval for Mean |
Minimum |
Maximum |
|
|
Lower Bound |
Upper Bound |
||||||
|
PMMA |
5 |
44.33 |
4.509 |
33.13 |
55.53 |
40 |
49 |
|
PMMA- 3wt.% Waste Paper Layers |
5 |
64.00 |
4.583 |
52.62 |
75.38 |
60 |
69 |
|
PMMA- 6wt.% Waste Paper Layers |
5 |
77.33 |
2.082 |
72.16 |
82.50 |
75 |
79 |
|
PMMA- 9wt.% Waste Paper Layers |
5 |
92.67 |
3.512 |
83.94 |
101.39 |
89 |
96 |
|
PMMA-12wt.% Waste Paper Layers |
5 |
107.33 |
2.517 |
101.08 |
113.58 |
105 |
110 |
Figure 2. Values of tensile strength for samples
Table 5. Means, std. flexural strength for sample
|
Specimens |
N. |
Mean MPa |
Std. Deviation |
95% Confidence Interval for Mean |
Minimum |
Maximum |
|
|
Lower Bound |
Upper Bound |
||||||
|
PMMA |
5 |
107.33 |
3.215 |
99.35 |
115.32 |
105 |
111 |
|
PMMA- 3wt.% Waste Paper Layers |
5 |
130.00 |
5.000 |
117.58 |
142.42 |
125 |
135 |
|
PMMA- 6wt.% Waste Paper Layers |
5 |
210.00 |
10.000 |
185.16 |
234.84 |
200 |
220 |
|
PMMA- 9wt.% Waste Paper Layers |
5 |
530.33 |
5.508 |
516.65 |
544.01 |
525 |
536 |
|
PMMA-12wt.% Waste Paper Layers |
5 |
678.67 |
3.512 |
669.94 |
687.39 |
675 |
682 |
Figure 3. Flexural strength for samples
Table 6. Average values of the maximum impact strength for sample
|
Specimens |
N. |
Mean J/m2 |
Std. Deviation |
95% Confidence Interval for Mean |
Minimum |
Maximum |
|
|
Lower Bound |
Upper Bound |
||||||
|
PMMA |
5 |
5.567 |
0.4163 |
4.532 |
6.601 |
5.1 |
5.9 |
|
PMMA- 3wt.% Waste Paper Layers |
5 |
7.333 |
0.1528 |
6.954 |
7.713 |
7.2 |
7.5 |
|
PMMA- 6wt.% Waste Paper Layers |
5 |
9.700 |
0.2000 |
9.203 |
10.197 |
9.5 |
9.9 |
|
PMMA- 9wt.% Waste Paper Layers |
5 |
11.500 |
0.2050 |
11.003 |
11.997 |
11.3 |
11.7 |
|
PMMA-12wt.% Waste Paper Layers |
5 |
13.700 |
0.2168 |
13.203 |
14.197 |
13.5 |
13.9 |
Figure 4. Impact strength for samples
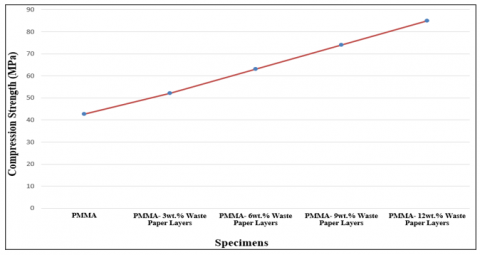
4.4 Compression strength
The results of the mean and standard deviation values compression strength of the specimens are illustrated in Table 7 and Figure 5. It is obvious the mean values compression strength of (PMMA) specimens was (42.67 ± 2.517 MPa) lower than the mean values of another specimen, and the reason is that (PMMA) has few mechanical properties lower. The increase in the weight fractions (3% to 12%) of the paper layer waste increased the mean values of the compressive strength (52±2.000, 63±3.000, 74±3.015, 85±2.050 MPa) respectively. This can be explained because the compressive properties mainly depend on the kind of material and the composition chemical of the reinforcing elements that led to the improvement of the bonding between (the matrix and the polymer) [25].
Table 7. Compression strength for sample
|
Specimens |
N |
Mean MPa |
Std. Deviation |
95% Confidence Interval for Mean |
Minimum |
Maximum |
|
|
Lower Bound |
Upper Bound |
||||||
|
PMMA |
5 |
42.67 |
2.517 |
36.42 |
48.92 |
40 |
45 |
|
PMMA- 3wt.% Waste Paper Layers |
5 |
52.00 |
2.000 |
47.03 |
56.97 |
50 |
54 |
|
PMMA- 6wt.% Waste Paper Layers |
5 |
63.00 |
3.000 |
55.55 |
70.45 |
60 |
66 |
|
PMMA- 9wt.% Waste Paper Layers |
5 |
74.00 |
3.015 |
66.55 |
81.45 |
71 |
77 |
|
PMMA-12wt.% Waste Paper Layers |
5 |
85.00 |
2.050 |
80.03 |
89.97 |
83 |
87 |
Figure 5. The mean and standard deviation of the compression strength for samples
Table 8. Hardness for sample
|
Specimens |
N. |
Mean Shore D |
Std. Deviation |
95% Confidence Interval for Mean |
Minimum |
Maximum |
|
|
Lower Bound |
Upper Bound |
||||||
|
PMMA |
5 |
80.467 |
.2517 |
79.842 |
81.092 |
80.2 |
80.7 |
|
PMMA- 3wt.% Waste Paper Layers |
5 |
82.233 |
.1528 |
81.854 |
82.613 |
82.1 |
82.4 |
|
PMMA- 6wt.% Waste Paper Layers |
5 |
83.600 |
.3000 |
82.855 |
84.345 |
83.3 |
83.9 |
|
PMMA- 9wt.% Waste Paper Layers |
5 |
84.400 |
.2000 |
83.903 |
84.897 |
84.2 |
84.6 |
|
PMMA-12wt.% Waste Paper Layers |
5 |
85.600 |
.3000 |
84.855 |
86.345 |
85.3 |
85.9 |
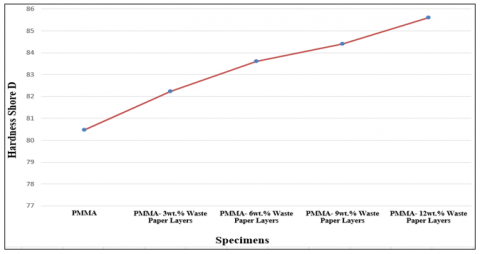
Figure 6. Hardness values for samples
4.5 Hardness (Shore D)
Table 8 and Figure 6 show the effect weight fraction additions of paper waste layers (3%, 6%, 9%, and 12%) on the average hardness and standard deviation of the polymer. The results showed that increasing the weight fractions of paper layers increases the mean values of the material hardness compared to the mean values of the pure specimens. The average hardness of the pure samples (PMMA) was (80.4067 ± .2517) when compared with the average hardness of the reinforced samples (3%, 6%, 9%, and 12% wt. the waste paper layers) it was found the weight fraction (12% wt.) improved the hardness by 6.4%. The cause increase in the mean values of hardness is that the paper contains a high percentage of cellulose, silica, and lignin, which improves the nature of the interaction between (polymer and waste paper) and thus increases the surface resistance of specimens to penetration, these agree with [26].
4.6 ANOVA analysis
Table 9 displays the results of the average values for the tensile, flexural, impact, compression, and hardness tests, that data was gathered and subjected to a one-way analysis of variance. The Sig values of the tensile, flexural, impact, compression, and hardness tests were (0.001, .005, 0.004, 0.006 ≤0.05) respectively. These numbers show a statistically significant discrepancy between the median results for each test (tensile, flexural, impact, compression, and hardness) at a confidence level of 95.0%, therefore means that the presence of paper fibers waste with polymer resin has a proactive effect on the tests, this agreement with references [27].
Table 9. Analysis ANOVA of all tests
|
ANOVA Results of Tensile (MPa) |
|||||
|
Specimens |
Sum of Squares |
df |
Mean Square |
F |
Sig. |
|
Between of Groups |
7205.067 |
4 |
1801.267 |
139.995 |
.001 |
|
Within of Groups |
128.667 |
10 |
12.867 |
|
|
|
Total |
7333.733 |
14 |
|
|
|
|
ANOVA Results of Flexural (MPa) |
|||||
|
Specimens |
Sum of Squares |
df |
Mean Square |
F |
Sig. |
|
Between of Groups |
797022.933 |
4 |
199255.733 |
5597.071 |
.005 |
|
Within of Groups |
356.000 |
10 |
35.600 |
|
|
|
Total |
797378.933 |
14 |
|
|
|
|
ANOVA Results of Impact (J/m2) |
|||||
|
Specimens |
Sum of Squares |
df |
Mean Square |
F |
Sig. |
|
Between of Groups |
125.483 |
4 |
31.371 |
495.326 |
.004 |
|
Within of Groups |
.633 |
10 |
.063 |
|
|
|
Total |
126.116 |
14 |
|
|
|
|
ANOVA Results of Compression (MPa) |
|||||
|
Specimens |
Sum of Squares |
df |
Mean Square |
F |
Sig. |
|
Between of Groups |
3416.667 |
4 |
854.167 |
132.088 |
.003 |
|
Within of Groups |
64.667 |
10 |
6.467 |
|
|
|
Total |
3481.333 |
14 |
|
|
|
|
ANOVA Results of Hardness Shore D |
|||||
|
Specimens |
Sum of Squares |
df |
Mean Square |
F |
Sig. |
|
Between of Groups |
47.243 |
4 |
11.811 |
192.565 |
.006 |
|
Within of Groups |
.613 |
10 |
.061 |
|
|
|
Total |
47.856 |
14 |
|
|
|
Conclude from this work that the prosthetic limbs were manufactured from natural fiber waste (paper fibers) with polymer (PMMA) and used in the medical industries which are characterized by not being damaged or hardened during consolidation, which contributes to the durability of the work and use and not to be damaged. The increase in the percentage of paper fibers in the polymer improved the mean of the mechanical tests. Mechanical test results confirmed that adding (12% wt. waste paper layers - PMMA) increases the mean values (tensile, flexural, impact, compression, and hardness) by 142.1%, 532.3%, 146%, 99.2%, and 6.37%, respectively, compared to the mean values of pure samples (PMMA).
[1] Saferi A., Yusof Y. (2013). A review: Natural fiber as reinforcement in waste paper recycling and its processing methods. Applied Mechanics and Materials, 315: 443-447. https://doi.org/10.4028/www.scientific.net/AMM.315.443
[2] Hosseinpou R., Fatehi P., Latibari A., Javad S., (2010). Canola straw chemimechanical pulping for pulp and paper production. Bioresource Technology, 101(11): 4193-4197. https://doi.org/10.1016/j.biortech.2010.01.055
[3] Majid, S., Nabi, M., Abbas, R. (2014). An experimental investigation of HA/Al2O3 nanoparticles on mechanical properties of restoration materials. Engineering Solid Mechanics, 2: 173-182. https://doi.org/10.5267/j.esm.2014.4.006
[4] Kutz, M. (2002). Handbook of Materials Selection. John Wiley & Sons.
[5] Justin Z., Robert G., (2010). Advances in Lower- limb Prosthetic Technology. Advances in Lower-limb Prosthetic Technology, 21(1): 87-110. https://doi.org/10.1016/j.pmr.2009.08.003
[6] Klodd, E., Hansen, A., Fatone, S., Edwards, M. (2010). Effects of prosthetic foot forefoot flexibility on oxygen cost and subjective preference rankings of unilateral transtibial prosthesis users. Journal of Rehabilitation Research and Development, 47(6): 543-552. https://doi.org/10.1682/JRRD.2010.01.0003
[7] Gailey R., Lawrence D., Burditt C., Spyropoulos P., Newell C., Nash M., (1993). The CAT-CAM socket and quadrilateral socket: A comparison of energy cost during ambulation. Prosthet Orthot Int., 17(2): 95-100. https://doi.org/10.3109/03093649309164363
[8] Gupta, M., Srivastava, R., Bisariaa, H. (2015). Potential of jute fibre reinforced polymer composites: A review. International Journal of Fiber and Textile Research, 5(3): 30-38.
[9] Kahtan A., Jawad K., Sahbah P., (2012). Tensile and fatigue characteristics of lower-limb prosthetic socket made from composite materials. Proceedings of the 2012 International Conference on Industrial Engineering and Operations Management, 3(6).
[10] Jumaa S. (2014). Study the impact behavior of the prosthetic lower limb lamination materials due to low velocity impactor. Journal of Engineering, 20(4). https://doi.org/10.1115/ESDA2014-20007
[11] Oleiwi, J.K. (2016). Studying the tensile and buckling for PMMA reinforced by jute fibers for prosthetic pylon. Eng. &Tech. Journal, 34(1): 111-122.
[12] Charles A. (2005). Handbook of Plastic Processes. John Wiley &Sons Inc.,
[13] India mart, Antares chem. private limited, B-7/8, Satyam Shopping Centre, Ghatkopar East, Mumbai-400077, Maharashtra, India.
[14] Ruaa, H., Marwah, S., Reem, A. (2022). Investigation the effect of nano silica dioxide additives on the properties of epoxy resin for using in industrial applications. Materials Science Forum, 1050: 103-113. https://doi.org/10.4028/www.scientific.net/MSF.1050.103
[15] Annual Book of ASTM Standard. (1988). Standard Test Method for Tensile Properties of plastic D638M-87b, Vol. (09.01). https://www.academia.edu/35737193/Standard_Test_Method_for_Tensile_Properties_of_Plastics, accessed on Mar. 16, 2022.
[16] Annual Book of ASTM Standard. (1986). Standard Test Methods for Flexural Properties of Unreinforced and Reinforced Plastics D 790- 86, 10.01. https://yiqi-oss.oss-cn-hangzhou.aliyuncs.com/aliyun/technology/187902/233175.pdf, accessed on Mar. 16, 2022.
[17] Annual Book of ISO Standard. (2006). Standard Test Method for Unmatched Izod Impact Testing of Plastics ISO-180, Vol.1–2. https://www.iso.org/standard/84394.html, accessed on Mar. 16, 2022.
[18] Annual Book of ASTM Standard. (2002). Standard Test Method for Compressive Properties of Rigid Plastics, D 695-02a, PP. 1-8. https://pdfcoffee.com/astm-d695-standard-test-method-for-compressive-properties-of-rigid-plasticspdf-pdf-free.html, accessed on Mar. 16, 2022.
[19] Annual Book of ASTM Standard. (1988). Standard Test Method for Plastics Properties- Durometer Hardness D 2240, 09.01. https://www.checkline.com/res/downloads/d2240.pdf, accessed on Mar. 16, 2022.
[20] Deborah, D. (2010). Composite Materials: Science and Applications. Springer-Verlag London Limited, 2nd Edition.
[21] Reem A., (20190. Tensile strength, impact strength and experimental analysis wear behavior of modified zinc nitrate filled polymer. Materials Research Express, IOP Publishing, 6(12): 125314. https://doi.org/10.1088/2053-1591/ab5492
[22] Soliman, E., Kandil, U., Taha, M.R. (2014). Improved strength and toughness of carbon woven fabric composites with functionalized MWCNTs. Journal of Materials, 7(6): 4640-4657. https://doi.org/10.3390/ma7064640
[23] Zebarjad, S.M., Sajjadi, S.A., Sadrabadi, T.E., Yaghmaei, A., Naderi, B. (2011). A study on mechanical properties of PMMA/hydroxyapatite nanocomposite. Engineering, 3(8): 795-801.
[24] Badawy, A.A.M. (2012). Impact behavior of glass fibers reinforced composite laminates at different temperature. Ain Shams Engineering Journal, Egypt, 3(2): 105-111. https://doi.org/10.1016/j.asej.2012.01.001
[25] Attallah, M.S., Mohammed, R.A., Al-Zubidi, A.B. (2019). Flexural, compressive and thermal characterization of hybrid composite Materials. AIP Publishing Conference Proceedings, 2123: 020084. https://doi.org/10.1063/1.5117011
[26] Oleiwi, J.K., Mohammed, R.A. (2021). Comparison of the wear behavior and hardness of vinylester resin reinforced by glass fiber and nano ZrO2 and Fe3O4. Revue des Composites et des Matériaux Avancés-Journal of Composite and Advanced Materials, 31(6): 325-333. https://doi.org/10.18280/rcma.310603
[27] Mohammed, R.A., Atallah, M.S. (2020). Comparative study of mechanical properties and water absorption of hybrid unsaturated polyester composite reinforced by cinnamon sticks and banana peel powder with jute fiber. Journal of Mechanical Engineering Research and Developments, Coden: Jerdfo, 43(2): 267-283.