Ndudim H. Ononiwu* | Chigbogu G. Ozoegwu | Nkosinathi Madushele | Esther T. Akinlabi
© 2021 IIETA. This article is published by IIETA and is licensed under the CC BY 4.0 license (http://creativecommons.org/licenses/by/4.0/).
OPEN ACCESS
Machinability studies of aluminium matrix composites (AMCs) is a necessary investigation required to understand their behaviour during machining to produce components effectively and efficiently. This established need has led to the investigation into the machinability of AA 6082 reinforced with 2.5 wt.% fly ash and 2.5 wt.% carbonized eggshell fabricated via stir casting. The studied machinability indices were material removal rate (MRR), cutting temperature, built-up edges (BUE) formation and chip morphology while the selected inputs were cutting speed (100 mm/min, 200 mm/min, 300 mm/min), feed (0.1 mm/rev, 0.2 mm/rev, 0.3 mm/rev) and depth of cut (0.5 mm, 1 mm, 1.5 mm). For the experimental design, the L9 orthogonal array was preferred to create 9 experimental runs. The analysis of the built-up edges showed that it increased at lower cutting speeds and increased feed and depth of cut. The examination of the produced chips after each experimental run showed the presence of c-shaped, helically shaped and ribbon-shaped chips. The analysis of variance (ANOVA) for both MRR and cutting temperature indicated that the depth of cut was the most influential factor on both responses. Multi-objective optimization using desirability function analysis showed that the optimum combination of parameters was 300 mm/min, 0.2 mm/rev and 1.0 mm for the cutting speed, feed and depth of cut respectively. The ANOVA of the composite desirability indicated that the cutting speed was the most contributing factor.
aluminium matrix composites, machinability, MRR; cutting temperature, BUE, chip morphology, desirability function analysis
Aluminium matrix composites (AMCs) are currently receiving numerous attention due to the combination of improved properties not limited to good strength-to-weight ratio, corrosion and wear resistance [1, 2]. These results have led to their incorporation into several industrial applications including aerospace, marine and structures. These applications have further led to research into fabrication methods that retain the improved properties at a relatively lower cost. Research has shown that stir casting is an adequate method of fabricating AMCs at a relatively lower cost. Stir casting is a liquid processing route for AMCs that has the advantages of cost-effectiveness, simplicity, increased productivity and the ability to produce complex geometries [3-5]. For cost savings and sustainability, waste materials have been incorporated into the fabrication of AMCs as particulate reinforcements [6]. These waste materials are grouped into industrial and agricultural waste. These materials including fly ash, eggshells, rice husk, and red mud have been used in producing either binary or ternary AMCs with recorded improvements in the properties being considered. Such research includes that conducted by Sharma et al. [7] which successfully reinforced aluminium with fly ash. The wear resistance studies revealed a 13.6% improvement compared to the unreinforced matrix. Dwiedi et al. [8] reinforced AA 2014 with fly ash and reported an improvement of 55.24% and 39.58% in the tensile strength and hardness respectively. An investigation reported in [9] fabricated a ternary AMC by reinforcing aluminium with fly ash and SiC. Results of the study showed an improvement in the densities and hardness with the addition of fly ash.
Although the stir casting processing route has the outlined merits, machining of AMCs is of utmost importance for proper confinement to the designed dimension, tolerance specifications and surface quality requirements. Machinability studies of AMCs are very important as in most cases the indices are interdependent [10]. This reason has resulted in various research into the machinability studies of AMCs. Research has shown that the presence of the hard-reinforcing particles incorporated into the aluminium alloy matrix while improving the properties of the composite, increases the difficulty in machining the said composites [11, 12]. Such difficulties include increased surface roughness, increased tool wear, and increased cutting temperature. Among the machinability indices considered in the studies of AMCs, MRR and the cutting temperature are receiving attention due to the need for increased productivity, improved tool life and surface integrity. To this effect, surveyed literature has studied the MRR and cutting temperature of selected AMCs. Emine et al. [13] investigated the effect of SiC and Molybdenum on the tool wear, surface roughness, chip formation and cutting temperature of copper. It was reported that the addition of the reinforcing particles increased the surface roughness and tool wear. It was also reported that the increase in temperature resulted in the formation of built-up edges. Using polycrystalline diamond (PCD) inserts, Jinag et al. [14] investigated the machinability of Al/TiB2 composite. The investigation revealed that the cutting forces developed during the cutting of the workpiece increased for the AMC in comparison to the base metal. Pugazhenthi et al. [15] evaluated the machinability characteristics of AA 7075 reinforced with TiB2. In terms of the effect of the reinforcement, it was reported that the presence of the TiB2 particles decreased the cutting forces and increased the tool flank wear. The reinforcements also resulted in the formation of discontinuous chips. Kumarasamy et al. [16] investigated the machinability of AA 7075 reinforced with fly ash and graphite. The results showed that the weight fraction of the graphite particles and the cutting speed were the most influential factors on the surface roughness of the machined composite. Teng et al. [17] in the machinability analysis of Al/SiC composite revealed that the movement of the workpiece against the tool during cutting resulted in the formation of large cavities due to reinforcement pull-out, pressed particles and fragmented particles which invariably decreased the quality of the surface finish after machining.
From the reviewed literature, it is evident that the machinability studies of AMCs are important to gain valuable information on selected indices needed for effective machining processing. To this effect, this work was done to investigate the MRR, cutting temperature, BUE and chip formation of AA 6082 reinforced with fly ash and eggshell. The novelty is based on the expanded scope of performance indices considered and the use of 2 sustainable reinforcements in the studied ternary composite. In this work, analysis of variance, single-objective optimization, multi-objective optimization and the development of predictive models for the MRR and cutting temperature were undertaken.
2.1 Composite preparation
For this investigation, the base metal was AA 6082. The elemental composition of the base metal is depicted in Table 1. The machinability study for this investigation was conducted on the AA 6082 reinforced with 2.5 wt.% fly ash and 2.5 wt.% carbonized eggshell. The choice of the reinforcement weight fraction was subject to an earlier conducted research that showed that this variation has excellent mechanical and tribological properties in comparison to the base metal. The fabrication method selected for the production of the composite was stir casting owing to its simplicity and cost-effectiveness. The fly ash and eggshell samples were mechanically milled to obtain particles between the micro and nanoscales. The samples were subsequently screened to obtain particles with an average size of ˂75 µm. Before casting, the reinforcements were preheated for 1 hour to improve the interfacial bonding and adequate wettability between the reinforcing particles and the aluminium alloy [18-20]. The base metal was subsequently melted at a temperature of 760℃ and subsequently charged with the preheated reinforcements. The stirring was to ensure an even distribution of the particles in the aluminium melt. The molten mix was subsequently cast in a 75 mm X 250 mm sand mould.
2.2 Machining conditions
The machinability studies considered the effect of the fly ash and carbonized eggshell on the material removal rate, cutting temperature and chip morphology. The built-up edge (BUE) formation on the cutting tool was also studied. The study considered turning which was done using the Ecoline ctx 3 axes CNC lathe depicted in Figure 1, while the cutting tool was the Korloy carbide single-point tool insert with a nose radius of 0.4 mm. The uncoated carbide tool insert was incorporated with a chip breaker geometry to reduce cutting resistance while improving the chip control. The MRR after each experimental run was obtained mathematically via Eq. (1).
$M R R=\left(\frac{\pi / 4_{o}^{2}-\pi / 4 D_{1}^{2}}{T}\right) X L$ (1)
where, Do is the initial diameter, D1 is the final diameter after cutting, and T is the machining time in minutes, and L is the length of cut in mm
The cutting temperature was obtained using the TC:08 thermocouple data logger with a measuring temperature range of -270℃ to 1820℃. With the aid of the said thermocouple data logger, the cutting temperature data were taken at the rake face of the cutting tool. The chip morphology was analyzed using the Olympus SZX16 microscope, while the built-up edge was analysed using the TESCAN model type VEGA LMH scanning electron microscope.
Figure 1. Ecoline ctx 3 axis CNC lathe
2.3 Design of experiments
To identify the right mix of the input parameters highlighted in Table 2, the Taguchi method of design of experiments was employed. This was achieved using the MINITAB 17 statistical software. For the experimental methodology, the L9 orthogonal array design of experiments was utilized to obtain 9 distinct experimental runs which were eventually used for the study.
Single objective optimization was carried out to individually optimize the MRR and cutting temperature. This was achieved using the Taguchi optimization technique. Here, the individual responses were converted to signal-to-noise (S/N) ratios. Signal-to-noise ratio is a tool used in the optimization process to ascertain the robustness of the desired process while evaluating any deviations from the desired values [20]. In the Taguchi optimization process, higher values of the S/N ratio are always preferred because the effects of noise are sufficiently reduced. For this study, the larger the better, and the smaller better criteria were utilized for the MRR and cutting temperature respectively. This was the case because the aim of optimizing the MRR is to maximize while that of the cutting temperature is to minimize. The formulas used to obtain the S/N ratio based on the selected criteria are shown in Eqns. (2) and (3).
$\mathrm{S} / \mathrm{N}$ ratio $=-10 \log \left(\frac{1}{\mathrm{n}} \sum_{\mathrm{i}=1}^{\mathrm{n}} \frac{1}{\mathrm{y}_{\mathrm{i}}^{2}}\right)$ (2)
$\mathrm{S} / \mathrm{N}$ ratio $=-10 \log \left(\frac{1}{\mathrm{n}} \sum_{\mathrm{i}=1}^{\mathrm{n}} \mathrm{y}_{\mathrm{i}}^{2}\right)$ (3)
Table 1. Elemental composition of the base metal
|
Composition |
Si |
Fe |
Cu |
Mn |
Mg |
Cr |
Ni |
Ti |
Al |
|
% |
0.898 |
0.535 |
0.079 |
0.593 |
0.142 |
0.055 |
0.108` |
0.013 |
97.58 |
Table 2. Input parameters selected for the machinability study
|
|
Levels |
|||||
|
S/No |
Factors |
Designation |
Units |
1 |
2 |
3 |
|
1 |
Cutting speed |
v |
mm/min |
100 |
200 |
300 |
|
2 |
Feed |
f |
mm/rev |
0.1 |
0.2 |
0.3 |
|
3 |
Depth of cut |
d |
mm |
0.5 |
1 |
1.5 |
3.1 Built-up-edges (BUE)
Figure 2. BUE for (a) Experimental run 1 (b) Experimental run 2 (c) Experimental run 3 (d) Experimental run 4
(e) Experimental run 5 (f) Experimental run 6 (g) Experimental run 7 (h) Experimental run 8 (i) Experimental run 9
The built-up edges formation on the carbide cutting tool while machining the cast hybrid AMC was considered for this work. For each experimental run, the BUE formed on the cutting edge of the uncoated carbide tool was analyzed. The formed BUE after each experimental run is shown in Figure 2. The results show that for the 1st experiment there was no visible presence of BUE on the cutting tool. The BUE is formed as a result of the temperature rise caused during the movement workpiece against the cutting tool [12]. The BUE formation on the cutting tool shown in Figure 2 suggests that the highest BUE formation while cutting the cast hybrid AMC occurs after the 3rd experimental run. Here, the cutting speed was lowest at 100mm/min while the feed and depth of cut were maximum at 0.3 mm/rev and 1.5 mm respectively which indicates that BUE formation is favoured at lower cutting speeds and higher feed and depth of cut. There is very high contact pressure between the chip and the rake face at the earlier sub-zone of contact and consequent work-hardening and slow rate of recovery due to lower heat generation at slower cutting speeds. Moreover, under the orthogonal metal cutting theory of Merchant, higher tool-chip contact lengths on the rake face result from higher chip thickness. These jointly explain why the experimental run recorded the most pronounced BUE. Certain research has shown that the formation of BUE is beneficial to the cutting tool as it creates a coating that ultimately improves the tool life by creating a protective layer at the tool-work interface that reduces direct contact at the cutting point [21]. This phenomenon leads to decreased cutting forces (because of a decrease in effective rake angle) but results in the deterioration of the surface integrity of the hybrid composite workpiece by breakage and displacement of the hybrid reinforcing particles on the machined surface.
3.2 Chip morphology
The type and morphology of the chips produced are dependent on the coefficient of friction at the cutting inserts-chip interface and the selected input parameters [22]. After each experimental run, the chip formed was collect and stored for analysis. The collected chip after each experimental run is shown in Figure 3 (a-i). The optical microscope used to analyze the morphology of the chips produced after each experimental run showed the presence of mostly discontinuous chips. The discontinuous chips formed is predominantly due to the presence of the hard-reinforcing particles. The hard reinforcing particles were responsible for the reported decrease in ductility of the AA 6082 base metal [23, 24]. The reduction in the ductility ultimately led to the brittleness of the workpiece thereby resulting in the production of the discontinuous chips as well as the serrated chip observed for all the experimental runs [25]. The tool-chip friction and increased feed and depth of cut are also responsible for the formation of the discontinuous chips [26]. Sharma et al. [22] suggest that the formation of the serrations on the chips could also be due to the side-flow of work materials at the corner of the produced chip caused by plastic deformation. Three types of chips characterized the chip morphology of the machined AMC. C-shaped chips, helically shaped chips and thin ribbon-shaped chips. The analysis of the chip thickness also increased with the increase in the feed while the level of the cutting speed had minimal effect on the thickness of the chips produced. Looking at the corresponding subfigures in Figure 2 and Figure 3, it can be seen that, as expected, BUE is more likely when chip formation is continuous.
3.3 Analysis of Variance (ANOVA)
The ANOVA of the MRR populated in Table 3 indicates that the three cutting parameters selected as the independent variables of the process are all influential. This is supported by the P-values which are all less than 0.05. The ANOVA further shows that in terms of contribution, the depth of cut had the highest contribution of 36.96%. The cutting speed and feed had contributions of 28.28% and 33.95% respectively. The increase in MRR with increasing cutting speed, feed and depth of cut is due to the removal of more material with every cutting pass. This phenomenon holds regardless of the type of material being cut.
The ANOVA for the cutting temperature showed that the depth of cut was also the most influential factor for this response having a percentage contribution of 62.83%. The analysis summarized in Table 4 shows that the depth of cut, having a P-value of less than 0.05 indicates that it is the only influential parameter on the cutting temperature. The cutting speed and feed had percentage contributions of 1.14% and 33.27% respectively. As evident by both the percentage contribution and the P-values of the selected factors, it is evident that the influence of the cutting speed is negligible.
The ANOVA for the cutting temperature showed that the depth of cut was also the most influential factor for this response having a percentage contribution of 62.83%. The analysis summarized in Table 4 shows that the depth of cut, having a P-value of less than 0.05 indicates that it is the only influential parameter on the cutting temperature. The cutting speed and feed had percentage contributions of 1.14% and 33.27% respectively. As evident by both the percentage contribution and the P-values of the selected factors, it is evident that the influence of the cutting speed is negligible.
Figure 3. Chip morphology for (a) Experimental run 1 (b) Experimental run 2 (c) Experimental run 3 (d) Experimental run 4 (e) Experimental run 5 (f) Experimental run 6 (g) Experimental run 7 (h) Experimental run 8 (i) Experimental run 9
Table 3. ANOVA for the MRR
|
Source |
DF |
Seq SS |
Contribution % |
Adj SS |
Adj MS |
F-Value |
P-Value |
|
Cutting speed |
2 |
47470 |
28.24 |
47470 |
23735.20 |
33.63 |
0.029 |
|
Feed |
2 |
57059 |
33.95 |
57059 |
28529.70 |
40.42 |
0.024 |
|
Depth of cut |
2 |
62126 |
36.96 |
62126 |
331062.90 |
44.01 |
0.022 |
|
Error |
2 |
1412 |
0.84 |
1412 |
705.80 |
|
|
|
Total |
8 |
168067 |
100 |
|
|
|
|
Table 4. ANOVA for the cutting temperature
|
Source |
DF |
Seq SS |
Contribution % |
Adj SS |
Adj MS |
F-Value |
P-Value |
|
Cutting speed |
2 |
45.89 |
1.14 |
45.89 |
22.95 |
0.42 |
0.706 |
|
Feed |
2 |
1333.98 |
33.27 |
1333.98 |
666.99 |
12.10 |
0.076 |
|
Depth of cut |
2 |
2519.21 |
62.83 |
2519.21 |
1259.61 |
22.86 |
0.042 |
|
Error |
2 |
110.21 |
2.75 |
110.21 |
55.11 |
|
|
|
Total |
8 |
4009.30 |
100 |
|
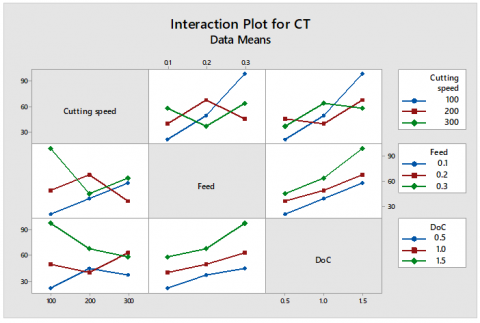
The interaction plot produced by the ANOVA tool was used to show the relationship between a factor and the selected response and how it depends on the value of a second factor. The interaction plots for the MRR and cutting temperature is displayed in Figure 4 and Figure 5 respectively. For the MRR, the presence of non-parallel interconnecting lines indicates adequate interactions between the cutting speed, feed and depth of cut, thereby suggesting the relationship between the MRR and the cutting speed depends on the feed and depth of cut. The cutting speed-feed relationship suggests that 300 mm/min and 0.3 mm/rev as the best values for the highest MRR. The cutting speed-depth of cut interaction suggests a cutting speed of 300 mm/min and depth of cut of 1.0 mm. The feed-depth of cut relationship showed that the highest value of the MRR was obtained at a feed of 300 mm/rev and a depth of cut of 1.0 mm.
The interaction plots for the cutting temperature shown in Figure 5 shows that the relationship between the cutting temperature and cutting speed depends on the feed and depth of cut as suggested by the non-parallel lines. The plots also show that the lowest value of the cutting temperature is obtainable at low cutting speed, feeds and depth of cut. Figure 5 also suggest that there isn’t a strong interaction between the MRR, feed and depth of cut.
3.4 Optimization
The application of the Taguchi L9 orthogonal array designed 9 individual experiments. These experiments were conducted and produced experimental results for the MRR and cutting temperature. For the optimization studies, the MRR and the cutting temperature of the cast AMC were conducted using the Taguchi optimization process. The responses were converted to S/N ratio using the equation depicted in Eqns. (2) and (3). The larger the better criterion was used to calculate the S/N ratio for the MRR while the smaller the better criterion was used to calculate the cutting temperature. The obtained S/N ratio for both responses is summarized in Table 5.
For the optimization of both responses i.e., the MRR and cutting temperature, the response table for the S/N ratio was utilized. These tables for both responses are summarised in Table 6. The delta value which signifies the difference between the highest average response characteristic value and the lowest average response characteristic value for levels of each categorical factor was used to compute their ranks to show their influence on the response being investigated. The largest S/N ratio of each level for the factors was selected as the optimum combination of the cutting speed, feed and depth of cut to optimize both responses individually.
Figure 4. Interaction plots for the MRR
Figure 5. Interaction plots for the cutting temperature
Table 5. Experimental results and S/N ratios for the MRR and cutting temperature
|
Cutting speed |
Feed |
Depth of cut |
MRR (mm3/min) |
Cutting temperature (℃) |
S/N ratio for MRR (db) |
S/N ratio for cutting temperature (db) |
|
100 |
0.1 |
0.5 |
39.85 |
21.38 |
32.01 |
-26.60 |
|
100 |
0.2 |
1 |
185.40 |
49.63 |
45.36 |
-33.91 |
|
100 |
0.3 |
1.5 |
410.65 |
99.15 |
52.27 |
-39.93 |
|
200 |
0.1 |
1 |
176.80 |
40.01 |
44.95 |
-32.04 |
|
200 |
0.2 |
1.5 |
402.05 |
68.26 |
52.09 |
-36.68 |
|
200 |
0.3 |
0.5 |
283.05 |
45.51 |
49.04 |
-33.16 |
|
300 |
0.1 |
1.5 |
393.45 |
58.64 |
51.90 |
-35.36 |
|
300 |
0.2 |
0.5 |
274.45 |
36.89 |
48.77 |
-31.34 |
|
300 |
0.3 |
1 |
499.70 |
64.14 |
53.97 |
-36.14 |
Table 6. Response table for S/N ratios of the MRR and cutting temperature
|
MRR |
Cutting temperature |
|||||
|
Level |
Cutting speed (db) |
Feed (db) |
Depth of cut (db) |
Cutting speed (db) |
Feed (db) |
Depth of cut (db) |
|
1 |
43.21 |
42.95 |
43.27 |
-33.48 |
-31.34 |
-30.37 |
|
2 |
48.69 |
48.74 |
48.10 |
-33.96 |
-33.98 |
-34.03 |
|
3 |
51.55 |
51.76 |
51.76 |
-34.28 |
-36.41 |
-37.32 |
|
Delta |
8.33 |
8.81 |
8.81 |
0.80 |
5.07 |
6.96 |
|
Rank |
3 |
2 |
1 |
3 |
2 |
1 |
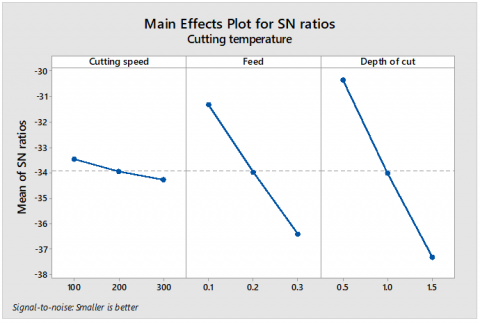
The analysis of the response table for the S/N ratio generated for the optimization of the MRR showed that the depth of cut was the most influential factor as evident by the highest delta value of 8.81 db. The cutting speed was assigned a rank of 3 while the feed was assigned the 2nd rank. The closeness of all delta values suggests that the 3 factors are all influential to the output of the MRR. The experimental investigation as supported by the response table for the S/N shows that increasing the values of all the categorical factors will ultimately lead to an increase in the MRR while machining the cast composite. The Taguchi prediction tool was used to predict the S/N ratio based on the combination of factors levels obtained during the optimization process. The predicted S/N ratio for the MRR based on the recommended input parameters was 59.76 db, while the MRR was predicted as 596.74 mm3/min. Compared to the S/N ratios for the MRR populated in Table 5, the predicted S/N ratio proves that the optimized combination of input parameters is capable of improving the MRR rate considerably. In the same vein, the optimization of the cutting temperature was conducted to ascertain the combination of the designed input parameters that gives the optimal value for the cutting temperature. The delta value for the factors shows that the depth of cut is the most influential factor with a delta value of 6.96 db. The feed and cutting speed were assigned ranks of 2 (5.07 db) and 3 (0.80 db) respectively. Figure 6 and Figure 7 show the main effect plots of the S/N ratios for the MRR and cutting temperature. Using the Taguchi prediction tool, the S/N ratio for the cutting temperature based on the combination of the input parameters was -27.85 db while the mean cutting temperature was predicted as 18.39℃.
Figure 6. Main effect plots for MRR
Figure 7. Main effects plot for cutting temperature
3.5 Effect of the input parameters on the responses
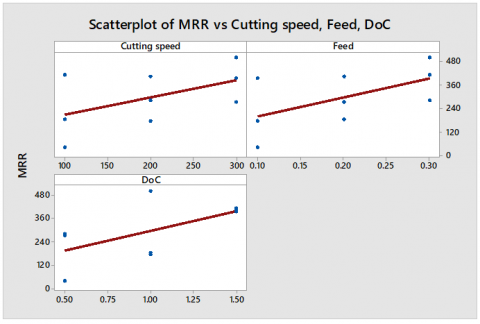
The effect of the set input paraments on the responses was analysed using the scatter plot with fitted lines. The overall trends described by the fitted lines were used to evaluate the effect of the categorical factors on the MRR and cutting temperature while turning the cast AMC. The analysis of the plot shown in Figure 8 for the MRR shows an increasing trend with an increase in the cutting speed, feed and depth of cut. The relationship between the cutting speed, feed and the MRR shows a fairly strong correlation between the described data. This trend was also reported in [27]. Although increasing all the factors increases the MRR, the fitted line that describes the relationship between the MRR and the depth of cut shows that by increasing the depth of cut, the MRR increases most in comparison to the cutting speed and feed. This is as a result of the removal of more materials per unit machining time. Although this trend will result in increased productivity, the drawback, in this case, is that increasing the depth of cut will ultimately result in increased cutting forces and tool wear which will adversely affect the surface integrity of the finished product. In the case of machining AMCs, increasing the depth of cut will results in both the fracture and dislodging the reinforcing particles embedded in the aluminium matrix resulting in the presence of void which also results in increased surface roughness. Also suggested by the response table of S/N ratio and the ANOVA analysis of the effect of the selected input parameters on the cutting temperature, the regression line that described the trends depicted in Figure 9 suggests that the depth of cut highly influences this response. The analysis of the scatter plot for the relationship between the cutting speed and cutting temperature shows that that increasing the cutting speed while machining the AMC has little effect on the cutting temperature. Increasing the feed and depth of cut leads to an increase in the cutting temperature. The increase in cutting temperature associated with increasing depth of cut is due to an increase in the contact area and the frictional force between the cutting tool and workpiece [10]. In the case of the feed, increasing the feed ultimately leads to increased temperature thereby resulting in softening of the workpiece. The softening of the workpiece resulting from the increased cutting temperature eventually causes surface erosion. The increased temperature brought about by the increase in the feed will negatively affect the surface quality due to the weakening of the interfacial between the reinforcing particles and the aluminium phase.
Figure 8. Scatter plots with regression for the MRR
Figure 9. Scatter plots with regression for the cutting temperature
3.6 Regression modelling
For this work, regression modelling was utilized to establish a correlation between the independent variables and the responses under consideration. To this effect, linear regression models were developed to predict the individual responses based on selected values of the input parameters.
$M R R=-278.40+0.8862 v+972.2 f+202.9 d$ (4)
Cutting temperature $=-13.12-0.0175 v+148 f+40.76 d$ (5)
where, v is the cutting speed, f is the feed while d is the depth of cut.
The regression models developed for the MRR and cutting temperature are shown in Eqns. (4) and (5). The regression model developed for the MRR had an R2 value of 0.9853 which indicates that the model is capable of explaining 98.53% of the variance in the MRR. A P-value of 0.000 indicates that the regression model developed for the MRR is significant in adequately predicting the response. The regression model developed for the cutting temperature showed that the R2 and P-values were 0.9536 and 0.001 respectively which indicates that the developed predictive models are capable of effectively predicting the response based on the selected input parameters. To confirm the accuracy of the results, a comparison between the experimental results and predicted values for the MRR and cutting temperature was done. The regression models were used to predict the results based on the designed experimental runs. The results are summarized in Figure 10 and Figure 11 for the MRR and cutting temperature respectively. The figures show that the regressions model is adequately suited to predict the effect of the input parameters on the MRR and cutting temperature with minimal error.
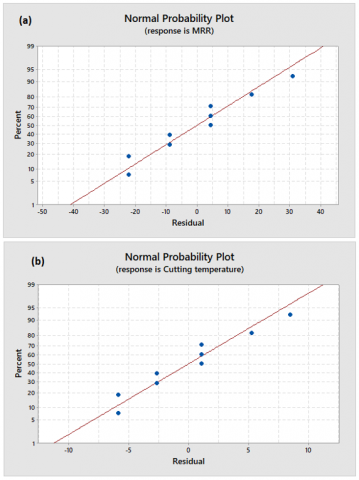
Normal probability plots were developed from the regression modelling of the MRR and cutting temperature. The plots were used to access the distribution of the data points. Both responses were characterized by an approximately linear pattern consistent with a normal distribution of the data points as evident by the closeness of the points to the regression line. There was no evidence of skewness or outliers in the distribution of the data points. The normal probability plots for the MRR and cutting temperature are displayed in Figure 12 (a) and (b).
Figure 10. Comparison between the experimental and predicted results for MRR
Figure 11. Comparison between the experimental and predicted results for cutting temperature
Figure 12. Normal probability plots for (a) MRR and (b) Cutting temperature
3.7 Multi-objective optimization
In addition to the single objective optimization of the individual responses (MRR and cutting temperature), the multi-objective optimization of these responses was taken into consideration to understand the influence of the established categorical factors on both responses simultaneously. The multi-objective optimization of the responses was done using desirability function analysis.
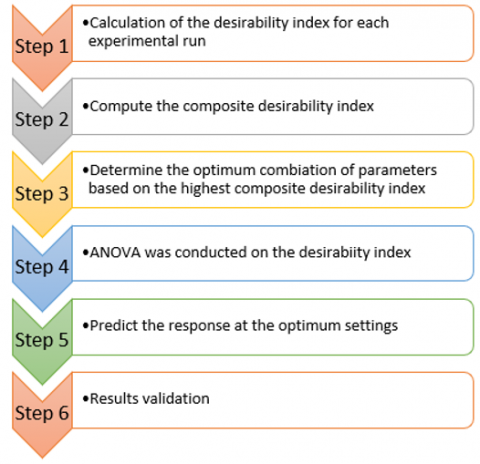
Desirability function analysis is a statistical technique used for multi-objective optimization where the objective is to ensure that all the quality characteristics are between 0 and 1 [28]. The individual desirability is, in turn, converted into composite desirability which is calculated from the combination of each response variable processed through a geometric mean of each pair of the response variables [29]. The highest value of the composite desirability is selected as the optimum parameter settings that produce the most desirable quality characteristics under consideration. Desirable function analysis has been successfully applied to several types of research that have attempted to optimize multiple objectives simultaneously including [30]. The flow chart in Figure 13 summarized the steps in the multi-objective optimization of the machinability indices using desirability function analysis.
Figure 13. Desirability function analysis framework for the multi-objective optimization of the MRR and cutting temperature
Based on the required need, an optimization process can be undertaken to either minimize, maximize or achieve a set target. The MRR was to be maximized while the cutting temperature was to be minimized. Based on this, Eqns. (6) and (7) were applied to determine the individual desirability index for the MRR and cutting temperature respectively.
$d_{i}=\left\{\begin{array}{c}0, x_{i} \leq x_{\min } \\ \left(\frac{x_{i}-x_{\min }}{x_{\max }-x_{\min }}\right), x_{\min } \leq x_{i} \leq x_{\max }, r \geq 0 \\ 1, x_{i} \geq x_{\min }\end{array}\right.$ (6)
$d_{i}=\left\{\begin{array}{c}1, x_{i} \leq x_{\min } \\ \left(\frac{x_{i}-x_{\max }}{x_{\min }-x_{\max }}\right), x_{\min } \leq x_{i} \leq x_{\max }, r \geq 0 \\ 0, x_{i} \geq x_{\min }\end{array}\right.$ (7)
where, $d_{i}$ is the individual desirability index, $x_{i}$ is the current value of the response, $x_{\min }$ is the minimum value of the response, $x_{\max }$ is the maximum value of the response, and r is the weight assigned to a response based on their relative importance.
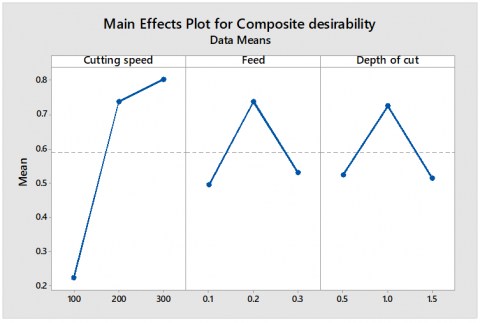
Table 7 shows that based on the obtained composite desirability, experimental run 9 (300 mm/min, 0.3 mm/rev and 1 mm) was the initial design parameters based on the composite desirability value of 0.8191. Further analysis of the obtained composite desirability was further analysed via ANOVA to obtain the contribution of the individual factors on the composite desirability. The ANOVA for the composite desirability is summarized in Table 8. Based on the results, it was shown that the cutting speed was the highest contributor to the composite desirability at 66.68%. The feed and depth of cut had a percentage of 11.39% and 9.37% respectively. The optimum combination of parameters was evident by the main effect plots of the composite desirability is shown in Figure 14.
Figure 14. Main effects plot for the composite desirability
Table 7. Processing of the responses for desirability function analysis
|
Individual desirability |
||||
|
Run |
MRR |
Cutting temperature |
Composite desirability |
Rank |
|
1 |
0.0000 |
1.0000 |
0.0000 |
8 |
|
2 |
0.5626 |
0.7980 |
0.6700 |
7 |
|
3 |
0.8980 |
0.0000 |
0.0000 |
8 |
|
4 |
0.5457 |
0.8720 |
0.6898 |
6 |
|
5 |
0.8875 |
0.6302 |
0.7479 |
5 |
|
6 |
0.7272 |
0.8305 |
0.7772 |
4 |
|
7 |
0.8769 |
0.7217 |
0.7955 |
3 |
|
8 |
0.7143 |
0.8947 |
0.7994 |
2 |
|
9 |
1.0000 |
0.6709 |
0.8191 |
1 |
Table 8. ANOVA for the composite desirability
|
Source |
DF |
Seq SS |
Contribution % |
Adj SS |
Adj MS |
F-Value |
|
Cutting speed |
2 |
0.60755 |
66.68 |
0.60755 |
0.30378 |
5.31 |
|
Feed |
2 |
0.10375 |
11.39 |
0.10375 |
0.05188 |
0.91 |
|
Depth of cut |
2 |
0.08533 |
9.37 |
0.08533 |
0.04266 |
0.75 |
|
Error |
2 |
0.11448 |
12.56 |
0.11448 |
0.05724 |
|
|
Total |
8 |
0.91111 |
100 |
|
|
|
The need for the incorporation of aluminium matrix composites into several industrial sectors has prompted this research into the machinability investigation of selected machinability indices of the AA 6082 matrix reinforced with fly ash and carbonized eggshells. The study demonstrated that the formation of the BUE is a function of the temperature rise at the tool-work interface. The chip morphology of the produced chips was c-shaped, helically shaped and ribbon-shaped. The ANOVA established that the depth of cut was the most influential factor on the MRR and the cutting temperature while the cutting speed was the most influential factor on the composite desirability. The multi-objective optimization of the composite desirability showed that the optimal parameters combination was 300 mm/min, 0.2 mm/rev, and 1.0 mm for the cutting speed, feed and depth of cut respectively. The effect of the reinforcements on the built-up edges (BUE) showed that the BUE was a function of temperature rise at the tool-work interface which occurred more at lower cutting speeds and increased feed and depth of cut.
[1] Oghenevweta, J.E., Aigbodion, V.S., Nyior, G.B., Asuke, F. (2016). Mechanical properties and microstructural analysis of Al-Si–Mg/carbonized maize stalk waste particulate composites. Journal of King Saud University - Engineering Sciences, 28(2): 222-229. https://doi.org/10.1016/j.jksues.2014.03.009
[2] Henry Ononiwu, N., Akinlabi, E.T., Ozoegwu, C.G. (2019). Sustainability in production and selection of reinforcement particles in aluminium alloy metal matrix composites: A review. Journal of Physics: Conference Series, 1378(042015): 1-10. https://doi.org/10.1088/1742-6596/1378/4/042015
[3] Ramanathan, A., Krishnan, P.K., Muraliraja, R. (2019). A review on the production of metal matrix composites through stir casting – Furnace design, properties, challenges, and research opportunities. Journal of Manufacturing Processes, 42: 213-245. https://doi.org/10.1016/j.jmapro.2019.04.017
[4] Ononiwu, N.H., Akinlabi, E.T., Ozoegwu, C.G., Aigbodion, V.S. (2019). A concise review of the effects of hybrid particulate reinforced aluminium metal matrix composites on the microstructure, density and mechanical properties. Lecture Notes in Mechanical Engineering: Advances in Manufacturing Engineering, S. E. Seyed, A. Mokhotar, and F. Yusof, Eds. Springer Singapore, 433-443.
[5] Ononiwu, N.H., Akinlabi, E.T., Ozoegwu, C.G. (2020). Optimization techniques applied to machinability studies for turning aluminium metal matrix composites: A literature review. Materials Today: Proceedings, 44(1): 1124-1129. https://doi.org/10.1016/j.matpr.2020.11.228
[6] Sharma, S., Dwivedi, S.P. (2017). Effects of waste eggshells and SiC addition on specific strength and thermal expansion of hybrid green metal matrix composite. Journal of Hazardous Materials, 333: 1-9. https://doi.org/10.1016/j.jhazmat.2017.01.002
[7] Sharma, V.K., Singh, R.C., Chaudhary, R. (2017). Effect of fly ash particles with aluminium melt on the wear of aluminium metal matrix composites. Engineering Science and Technology, an International Journal, 20(4): 1318-1323. https://doi.org/10.1016/j.jestch.2017.08.004
[8] Dwivedi, S.P., Maurya, N.K., Maurya, M. (2019). Effect of uncarbonized eggshell weight percentage on mechanical properties of composite material developed by electromagnetic stir casting technique. Revue des Composites et des Materiaux Avances, 29(2): 101-107. https://doi.org/10.18280/rcma.290205
[9] Kanth, U.R., Rao, P.S., Krishna, M.G. (2019). Mechanical behaviour of fly ash/SiC particles reinforced Al-Zn alloy-based metal matrix composites fabricated by stir casting method. Journal of Materials Research and Technology, 8(1): 737-744. https://doi.org/10.1016/j.jmrt.2018.06.003
[10] Xu, W., Zhang, L. (2021). Advances in machining of particulate-reinforced metal matrix composites. Advanced Machining and Finishing, Elsevier, 45-75. https://doi.org/10.1016/B978-0-12-817452-4.00016-6
[11] Jain, P., Soni, S., Baredar, P. (2014). Review on machining of aluminium metal matrix composites. Material Science Research India, 11(2): 114-120. https://doi.org/10.13005/msri/110204.
[12] Nicholls, C.J., Boswell, B., Davies, I.J., Islam, M.N. (2017). Review of machining metal matrix composites. International Journal of Advanced Manufacturing Technology, 90(9-12): 2429-2441. https://doi.org/10.1007/s00170-016-9558-4
[13] Emine, Ş., Usame, A.U., Munish, K.G., Mustafa, K. (2021). Tool wear and machinability investigations in dry turning of Cu / Mo-SiCp hybrid composites. The International Journal of Advanced Manufacturing Technology, 114: 379-396. https://doi.org/10.1007/s00170-021-06889-8
[14] Jiang, R., Chen, X., Ge, R., Wang, W., Song, G. (2018). Influence of TiB2 particles on machinability and machining parameter optimization of TiB2/Al MMCs. Chinese Journal of Aeronautics, 31(1): 187-196. https://doi.org/10.1016/j.cja.2017.03.012
[15] Pugazhenthi, A., Dinaharan, I., Kanagaraj, G., Selvam, J.D.R. (2018). Predicting the effect of machining parameters on turning characteristics of AA7075/TiB2 in situ aluminum matrix composites using empirical relationships. Journal of the Brazilian Society of Mechanical Sciences and Engineering, 40(555): 1-15. https://doi.org/10.1007/s40430-018-1480-2
[16] Kumarasamy, S.P., Vijayananth, K., Thankachan, T., Pudhupalayam Muthukutti, G. (2017). Investigations on mechanical and machinability behavior of aluminum/fly ash cenosphere/Gr hybrid composites processed through compocasting. Journal of Applied Research and Technology, 15(5): 430-441. https://doi.org/10.1016/j.jart.2017.05.005
[17] Teng, X., Chen, W., Huo, D., Shyha, I., Lin, C. (2018). Comparison of cutting mechanism when machining micro and nano-particles reinforced SiC/Al metal matrix composites. Composite Structures, 203: 636-647. https://doi.org/10.1016/j.compstruct.2018.07.076
[18] Quader, S.M., Murthy, B.S., Ravinder Reddy, P. (2016). Processing and mechanical properties of Al2O3 and red mud particle reinforced AA6061 hybrid composites. Journal of Minerals and Materials Characterization and Engineering, 4(2): 135-142. https://doi.org/10.4236/jmmce.2016.42013
[19] Venkatesh, L., Arjunan, T.V, Ravikumar, K. (2019). Microstructural characteristics and mechanical behaviour of aluminium hybrid composites reinforced with groundnut shell ash and B4C. Journal of the Brazilian Society of Mechanical Sciences and Engineering, 41(7): 1-13. https://doi.org/10.1007/s40430-019-1800-1
[20] Puh, F., Jurkivic, Z., Perinic, M., Brezocnik, M., Bulijan, S. (2016). Optimization of Machining parameters for turning operation with multiple quality characteristics using Grey Relational Analysis. Technicki Vjesnik, 23(2): 377-382. https://doi.org/10.17559/TV-20150526131717
[21] Kamalizadeh, S., Niknam, S.A., Asgari, A., Balazinski, M. (2019). Tool wear characterization in high-speed milling of titanium metal matrix composites. International Journal of Advanced Manufacturing Technology, 100(9-12): 2901-2913. https://doi.org/10.1007/s00170-018-2651-0
[22] Sharma, N., Gupta, K. (2019). Influence of coated and uncoated carbide tools on tool wear and surface quality during dry machining of stainless steel 304 Influence of coated and uncoated carbide tools on tool wear and surface quality during dry machining of stainless steel 304. Materials Research Express, 6(086585): 1-19. https://doi.org/https://doi.org/10.1088/2053-1591/ab1e59
[23] Alaneme, K.K., Bodunrin, M.O., Awe, A.A. (2018). Microstructure, mechanical and fracture properties of groundnut shell ash and silicon carbide dispersion strengthened aluminium matrix composites. Journal of King Saud University - Engineering Sciences, 30(1): 96-103. https://doi.org/10.1016/j.jksues.2016.01.001
[24] Zhu, J., Jiang, W., Li, G., Guan, F., Yu, Y., Fan, Z. (2020). Microstructure and mechanical properties of SiC np / Al6082 aluminum matrix composites prepared by squeeze casting combined with stir casting. Journal of Materials Processing Tech., 283(11669): 1-11. https://doi.org/10.1016/j.jmatprotec.2020.116699
[25] Bai, W., Roy, A., Sun, R., Silberschmidt, V.V. (2019). Enhanced machinability of SiC-reinforced metal-matrix composite with hybrid turning. Journal of Materials Processing Technology, 268: 149-161. https://doi.org/10.1016/j.jmatprotec.2019.01.017
[26] Groover, M.P. (2010). Fundamentals of Modern manufacturing, 4th ed. John Wiley & Sons, Inc.
[27] Das, D., Routara, B.C., Nanda, B.K., Chakraborty, S. (2019). Machining performance of aluminium 7075 composite: A grey based Taguchi concept. International Journal of Innovative Technology and Exploring Engineering, 9(2): 81-92. https://doi.org/10.35940/ijitee.A4964.129219
[28] Devarajaiah, D., Muthumari, C. (2018). Evaluation of power consumption and MRR in WEDM of Ti – 6Al – 4V alloy and its simultaneous optimization for sustainable production. Journal of the Brazilian Society of Mechanical Sciences and Engineering, 40(8): 1-18. https://doi.org/10.1007/s40430-018-1318-y
[29] Pimenta, C.D., Silva, M.B., Lima, R., Campos, D.M. (2018). Desirability and design of experiments applied to the optimization of the reduction of decarburization of the process heat treatment for steel wire Sae desirability and design of experiments applied to the optimization of the reduction of decarburization. Statistics: A Journal of Theoretical and Applied Statistics, 7(1): 35-44. https://doi.org/10.11648/j.ajtas.20180701.15
[30] Kumar, R., Chauhan, S. (2015). Study on surface roughness measurement for turning of Al 7075/10/SiCp and Al 7075 hybrid composites by using response surface methodology (RSM) and artificial neural networking (ANN). Measurement: Journal of the International Measurement Confederation, 65: 166-180. https://doi.org/10.1016/j.measurement.2015.01.003