Bo Zhou* | Congyang Zou | Erlin Meng
© 2021 IIETA. This article is published by IIETA and is licensed under the CC BY 4.0 license (http://creativecommons.org/licenses/by/4.0/).
OPEN ACCESS
By random growth method, this paper constructs isotropic porous media, anisotropic-1 porous media, and anisotropic-2 porous media, which have the same porosity but different micropore morphologies, and explores how the pore morphology affects the water vapor diffusion in the pores of porous media. The results show that: the random growth method can effectively reconstruct various porous moisture conditioning materials, and control their porosity and pore morphology; the equilibrium water vapor concentration and stabilization time of water vapor diffusion can effectively demonstrate the pore connectivity of porous media and the dynamic migration features of materials in the pores; the greater the change in the equilibrium water vapor concentration, the faster the stabilization of water vapor diffusion, and the better the pore connectivity of porous media.
porous media, moisture transfer process, pore reconstruction, humidity control
Porous moisture conditioning material, a carrier of passive moisture conditioning technology, can automatically regulate air humidity, without consuming any nonrenewable energy. It provides a preferred solution to alleviate the contradiction between building energy consumption and indoor environmental comfort.
The material absorbs and releases moisture within a certain range of relative humidity. The absorption and release are heavily dependent on pore structure, especially pore size and pore distribution. As a result, many scholars attempted to obtain design moisture conditioning materials by controlling the pore structure.
However, the structures of natural or self-prepared materials are severely limited, making it impossible to control the pore morphology, i.e., isotropy or anisotropy in the case of the same porosity. Neither is it easy to experimentally observe the fluid flow or heat/material migration in the pores of porous media.
The macro performance of moisture conditioning materials is mainly measured by effective moisture storage and moisture conditioning rate. These metrics are directly affected by the features of pore structure (e.g., porosity, pore distribution, and pore connectivity). Hence, these features are considered the key influencers of the overall effect of moisture conditioning materials.
Domestic and foreign scholars have established capillary tube models [1-3], regular or irregular network models [4, 5], and fractal models [6-8] to describe the pore structure of porous media, and study the hot-wet coupling migration in the pores of moisture conditioning materials. However, the above models are mostly about continuous media, with porosity as the sole parameter to characterize the pore structure. These models can only reflect the overall performance of porous media, failing to reveal the relationship between the pore structure and macro performance of such media. Neither could they demonstrate the moisture conditioning features in the porous media with different pore structures.
With the development of graphic information technology, computer tomography (CT) has emerged as a tool to acquire the exact pore morphology of three-dimensional (3D) porous media [9-12]. But CT does not support batch sampling, costs too much, and involves a complex correction function. To solve these problems, Wang et al. [13] proposed a random growth method called quartet structure generation set (QSGS) to describe the growth law of the matrix (or pores) of porous media in a particular region: By randomly distributing the matrix nucleuses in a particular area, the growth parameters of the pore structure (e.g., growth probability, and porosity) are adjusted, and the pore morphology (isotropy or anisotropy) is controlled, realizing the two-dimensional (2D) or 3D reconstruction of the pore structure. Compared with the statistical average-based parameter evaluation methods for the pore structure of porous media, the random growth method complies with the growth law of natural materials, and accurately reflects the geometric features of the pore structure in natural porous media. In addition, this method could construct very complex porous media by controlling the structural parameters, making it easy to analyze the influence of different structural parameters on the hot-wet migration in the porous media.
This paper aims to disclose the exact impact of pore structure on the moisture conditioning of porous media. Using random growth method, the authors effectively reconstructed isotropic and anisotropic porous media with the same porosity and different pore size distributions, in the light of the pore structure features of zeolite-based moisture conditioning material, and explored how micropore structure affects the moisture migration in the material. By controlling the pore structure of the material, the authors directly observed the gas diffusion in the micropore structure of the porous media, which were not easily observable in experiments. In addition, the relationship between pore structure and the moisture absorption and release performance of porous media was identified, laying the basis for optimizing the pore structure of moisture conditioning materials.
2.1 Reconstruction process
The basic construction parameters (cd, pi, and ε) of random growth method constrain the microstructural features of the porous media. The nucleus distribution probability cd is the possibility for a growth unit to become the initial nucleus of the skeleton phase, reflecting the nucleus density and the statistical distribution of growth phase in the space of volume elements. In the 3D space, the cd value depends on the number density of solid phase particles and the mean volume of particles [14]:
${{V}_{p}}=(1-\varepsilon )V/(N\cdot {{c}_{d}})$ (1)
where, V is the volume of the construction space; N is the number of grids in the construction space; Vp is the mean volume of particles.
The porosity ε refers to the proportion of the preset pores in the actual area or volume elements. The growth probability pi stands for the possibility of growth phase in the adjacent unit in direction 1. There are 8 directions in a 2D growth space, and 26 in a 3D growth space [15].
Before initializing construction space, the growth and non-growth phases should be selected based on the structural parameters extracted from the scanning electron microscopy (SEM) images of the cross-sections of natural zeolite-based moisture conditioning material, the construction space be meshed into grids, and the corresponding porosity ε and growth probability pi be obtained.
This paper only considers the skeleton and pores in the porous capillary core of the zeolite-based moisture conditioning material. Hence, the reconstruction only involves the structure of the two phases. The isotropic structure was constructed in the following steps: unify the growth probabilities in the six main axis directions, twelve edge directions, and eight vertex directions, i.e., p1-6: p7-18: p9-26=8: 4: 1, such that the directional growth probability is consistent with the equilibrium density distribution in the isotropic medium; the anisotropic-1 structure was constructed in the following steps: set the growth probability in the vertical direction of the main axis plane 10 times that in the horizontal direction, i.e., p5,6=10p1,3, and p1,3=4p2,4; the anisotropic-2 structure was constructed in the following steps: set the growth probability in the horizontal direction of the main axis plane 10 times that in the vertical direction, i.e., p1,3=10p5,6, and p5,6=4p2,4.
2.2 Random reconstruction of porous media with isotropic and anisotropic porous media
According to the mean porosity and pore distribution probability on the surface of zeolite-based moisture conditioning material, porous media with isotropic and anisotropic porous media were constructed with the porosity of 0.4 and growth probability of 0.001.
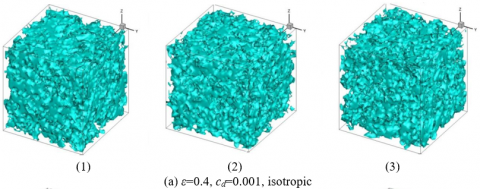
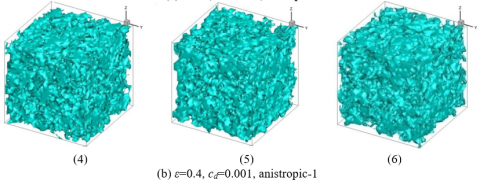
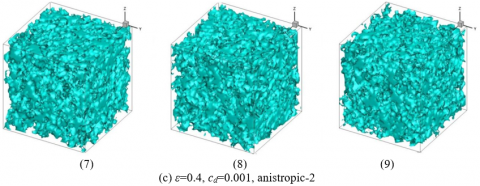
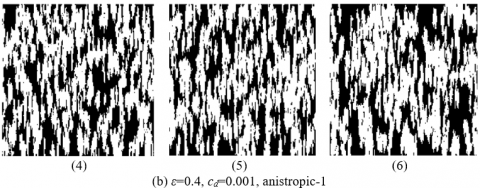
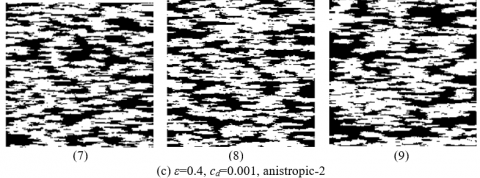
Figure 1(a) is the three randomly generated isotropic porous media. The growth probabilities in the six main axis directions, twelve edge directions, and eight vertex directions were unified as p1-6: p7-18: p9-26=8: 4: 1. Figure 1(b) is the three randomly generated anisotropic-1 porous media. The growth probability in the vertical direction of the main axis plane was set to 10 times that in the horizontal direction, i.e., p5,6=10p1,3, and p1,3=4p2,4. Figure 1(c) is the three randomly generated anisotropic-2 porous media. The growth probability in the horizontal direction of the main axis plane was set to 10 times that in the vertical direction, i.e., p1,3=10p5,6, and p5,6=4p2,4.
Figure 1. Randomly reconstructed isotropic and anisotropic porous media
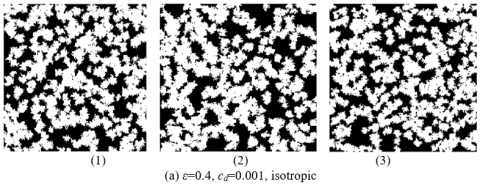
Figure 2. Microscopic cross-sections from the surface of randomly reconstructed porous media
Because of the consistency in porosity and growth probability, it is difficult to tell the difference between Figures 1(a)-(c) solely based on the shapes of the constructed 3D porous media.
However, clear differences between isotropic structure and the two anisotropic structures can be obviously observed from the microscopic cross-sections (Figures 2(a)-(c)) from the surface of the 3D porous media.
Based on the microscopic cross-sections from the surface of randomly reconstructed porous media with isotropic structure, anistropic-1 structure, and anistropic-2 structure (Figure 2), this section analyzes how different pore structures affects the moisture migration in the pores.
3.1 Mathematical model
To explore how micropore structure affects the water vapor diffusion on the surface and pores of microscopic surface cross-sections of porous media, the theoretical model was simplified in the following aspects: (1) water vapor diffuses in a constant ambient temperature in the pores of the porous media; (2) water vapor diffusion in the pores of the porous media does not involve phase change; (3) no chemical reaction takes place; (4) neither the solid skeleton of the porous media nor the water vapor is compressible.
Under the above assumptions, the control equation, initial conditions, left boundary (constant concentration boundary), upper and lower boundaries (moisture-proof boundaries), right boundary (natural convection boundary), i.e., flux boundary can be established as formulas (2), (3), (4), and (5)-(6), respectively:
Water vapor diffusion in pores:
$\frac{\partial c}{\partial t}=\frac{\partial }{\partial x}({{D}_{s}}\frac{\partial c}{\partial x})+\frac{\partial }{\partial y}({{D}_{s}}\frac{\partial c}{\partial y})$ (2)
Initial conditions:
$t=0,c={{c}_{0}}$ (3)
Boundary conditions:
$t>0$, $c={{c}_{bo}}$, $0\le y<H$, $x=0$ (4)
$-{{D}_{M}}\frac{\partial u}{\partial y}=0$ $0\le x<L$, $y=0$, $y=H$ (5)
$-{{D}_{M}}\frac{\partial c}{\partial x}={{k}_{c}}({{c}_{b}}-c)$ $0\le y<H$, $x=L$ (6)
The mean flow rate of the right boundary:
${{J}_{m}}=\frac{1}{H}\int_{0}^{H}{{{k}_{m}}}\left( c-{{c}_{b}} \right)dS$ (7)
The mean water vapor concentration of the right boundary:
${{c}_{out}}=\frac{1}{H}\int_{0}^{H}{cdS}$ (8)
The effective equilibrium diffusion coefficient of water vapor:
${{J}_{m}}=D_{s}^{{}}\frac{\left( {{c}_{0}}-{{c}_{out}} \right)}{L}$ (9)
where, c is the water vapor concentration; Ds is the diffusion rate of water vapor in the pores; c0 is the initial water vapor concentration; cb0 is the water vapor concentration of the left boundary; kc is the convection coefficient of water vapor; L, and H are the length and height of the sample, respective.
3.2 Model verification
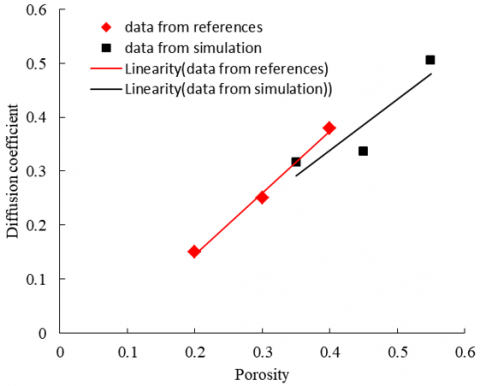
To verify the correctness of the above model, the calculated results were compared with the data of the gas diffusion experiment conducted by Orbach [16]. Figure 3 presents the relationship between the relative diffusion coefficient and porosity of carbon dioxide in the pores of the porous media. It can be seen that the data calculated by our model had basically the same trend as the experimental data, which verifies the rationality of our theoretical model. The small deviation between the calculated data and experimental data comes from two reasons: (1) our model only considers the gas diffusion along the X axis; (2) our model ignores the influence of temperature change on gas diffusion in pores.
Figure 3. Experimental and theoretical relative diffusion coefficients of carbon dioxide in the pores of porous media
3.3 Results of numerical simulation
Considering the extreme complexity and randomness of the pore structures, the pores of the porous media were meshed into free triangular elements. The grid density was properly increased in local areas. In addition, the grid independence was tested with different grid sizes, ensuring that the numerical solutions are grid independent.
At a time node, if the residual of water vapor concentration at each node is smaller than 1×10⁻⁶ between two adjacent iterative steps, then the iteration converges at that time node. In this way, the authors obtained the concentration distribution of water vapor in the solution space.
Throughout the computing area in our model, the water vapor concentration was initialized as 0.0015 mol/m3, the temperature kept constant at 20°C, the left boundary (concentration boundary) was set to 0.15 mol/m3, the right boundary was treated as a flux boundary, and the upper and lower boundaries as moisture-proof boundaries.
3.3.1 Influence of pore structure on the change of mean water vapor concentration on right boundary
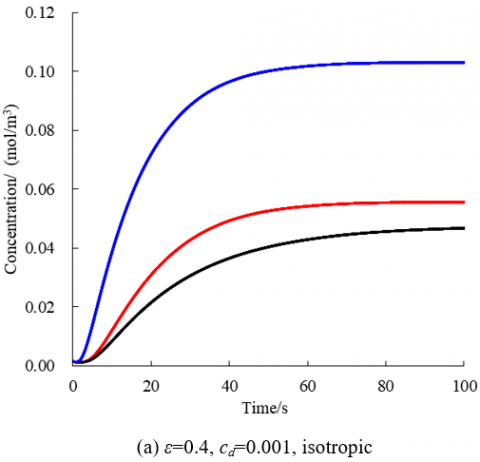
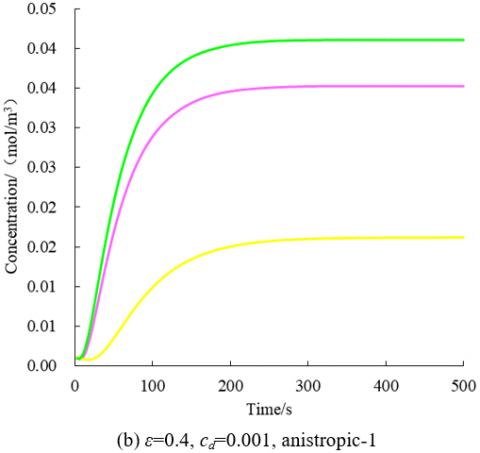
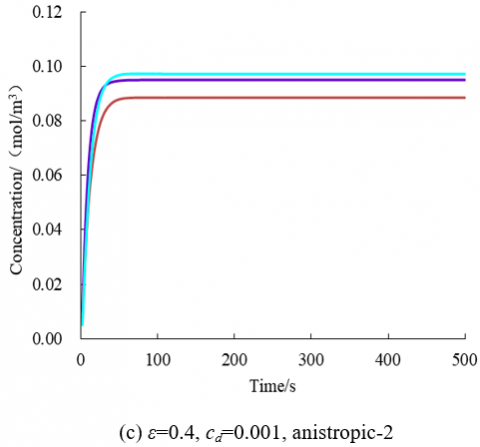
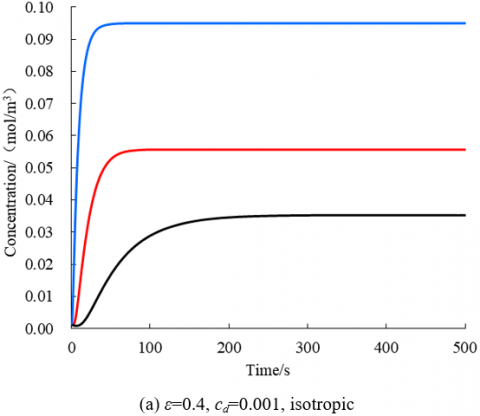
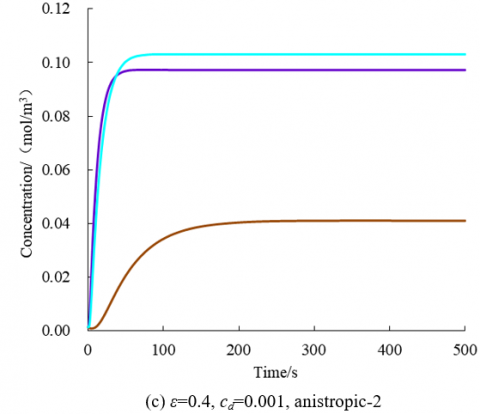
Figures 4(a)-(c) provide the temporal changes of mean water vapor concentration on right boundary for the isotropic, anisotropic-1, and anisotropic-2 porous media, whose porosities were all 0.4 and growth probabilities were all 0.001, respectively.
It can be seen that the isotropic, anisotropic-1, and anisotropic-2 porous media took 60s, 150s, and 30s to reach the equilibrium state of the mean water vapor concentration on right boundary, respectively. Comparison shows that the time difference between the three isotropic porous media in reaching the equilibrium state of the mean water vapor concentration on right boundary was 0.043 mol/m3; that between the three anisotropic-1 porous media was 0.022 mol/m3; that between the three anisotropic-2 porous media was 0.010 mol/m3.
Figure 4. Temporal changes of mean water vapor concentration on right boundary for porous media
The above results show that water vapor diffusion is very sensitive to pore connectivity. If the pore connectivity is poor in local areas, it would take a longer time for the water vapor concentration to reach the equilibrium state. Along the diffusion direction, the anisotropic-2 porous media boast the best pore connectivity, as they consumed the shortest time to reach equilibrium of water vapor concertation, and had the highest water vapor concertation.
3.3.2 Influence of pore type on the change of mean water vapor concentration on right boundary
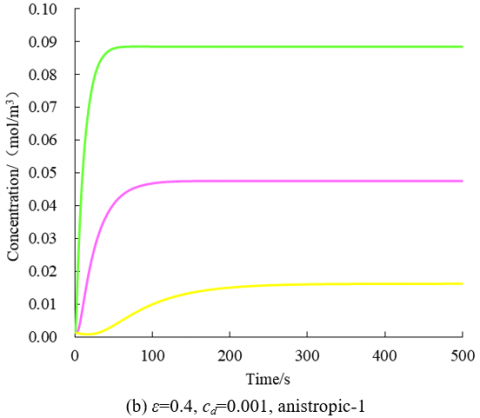
Figures 5(a)-(c) provide the change laws of mean water vapor concentration on right boundary for the isotropic, anisotropic-1, and anisotropic-2 porous media, whose porosities were all 0.4 and growth probabilities were all 0.001, respectively.
Figure 5. Change laws of mean water vapor concentration on right boundary for porous media
It can be seen that, under the same initial and boundary conditions, the isotropic, anisotropic-1, and anisotropic-2 porous media took 60s, 150s, and 30s to reach the equilibrium state of the mean water vapor concentration on right boundary, respectively. Anisotropic-2 porous media achieved the highest water vapor concentration, followed in turn by isotropic porous media, and anisotropic-1 porous media.
The above results show that the equilibrium water vapor concentration of porous media decreases with the growing pre-equilibrium time of water vapor concentration on the right boundary. That is, the shorter the time to reach the equilibrium, the higher the equilibrium water vapor concentration on average at the nodes on the right side. In addition, the equilibrium water vapor concentration reflects the pore connectivity of porous media. The higher the equilibrium water vapor concentration, the better the pore connectivity of porous media.
By random growth method, this paper constructs isotropic, anisotropic-1, and anisotropic-2 porous media with the same porosity and different micropore morphologies, and explores the water vapor diffusion in the pores of porous media with varied pore morphologies. Moreover, the authors examined the change law of water vapor concentration on microscopic surface cross-section of porous media, and the influence of pre-equilibrium time and other parameters on water vapor diffusion, as the water vapor diffuses across the porous media. The results show that:
(1) Random growth method can effectively reconstruct the various porous media in nature, and control features like porosity and pore morphology. With the growing porosity, the connectivity between pores increases, and the connected area widens; the larger the growth probability, the more refined the internal skeleton, pore shape, and interconnected structure of the pore media.
(2) The pore connectivity and dynamic transfer of materials in the pores of porous media can be effectively reflected by such parameters as the mean equilibrium water vapor concentration on the right boundary, and the time for the water vapor concentration to reach the equilibrium state.
(3) The greater the change in equilibrium water vapor concentration on the right boundary of the porous media, the shorter the time to reach the equilibrium state, and the better the pore connectivity of porous media.
The project was supported by NSFC (No.: 52008282).
[1] Bergman, T.L., Incropera, F.P., DeWitt, D.P., Lavine, A.S. (2011). Fundamentals of Heat and Mass Transfer. John Wiley & Sons.
[2] Haring, R.E., Greenkorn, R.A. (1970). A statistical model of a porous medium with nonuniform pores. AIChE Journal, 16(3): 477-483. https://doi.org/10.1002/aic.690160327
[3] Wei, Y., Durian, D.J. (2013). Effect of hydrogel particle additives on water-accessible pore structure of sandy soils: A custom pressure plate apparatus and capillary bundle model. Physical Review E, 87(5): 053013. https://doi.org/10.1103/PhysRevE.87.053013
[4] Cai, J., Perfect, E., Cheng, C.L., Hu, X. (2014). Generalized modeling of spontaneous imbibition based on Hagen–Poiseuille flow in tortuous capillaries with variably shaped apertures. Langmuir, 30(18): 5142-5151. https://doi.org/10.1021/la5007204
[5] Sahimi, M. (2011). Flow and Transport in Porous Media and Fractured Rock: From Classical Methods to Modern Approaches. John Wiley & Sons.
[6] Blunt, M.J., Jackson, M.D., Piri, M., Valvatne, P.H. (2002). Detailed physics, predictive capabilities and macroscopic consequences for pore-network models of multiphase flow. Advances in Water Resources, 25(8-12): 1069-1089. https://doi.org/10.1016/S0309-1708(02)00049-0
[7] Cai, J., Yu, B. (2010). Prediction of maximum pore size of porous media based on fractal geometry. Fractals, 18(04): 417-423. https://doi.org/10.1142/S0218348X10005123
[8] Yun, M., Yu, B., Cai, J. (2008). A fractal model for the starting pressure gradient for Bingham fluids in porous media. International Journal of Heat and Mass Transfer, 51(5-6): 1402-1408. https://doi.org/10.1016/j.ijheatmasstransfer.2007.11.016
[9] Zhang, L.Z. (2008). A fractal model for gas permeation through porous membranes. International Journal of Heat and Mass Transfer, 51(21-22): 5288-5295. https://doi.org/10.1016/j.ijheatmasstransfer.2008.03.008
[10] Narsilio, G.A., Buzzi, O., Fityus, S., Yun, T.S., Smith, D.W. (2009). Upscaling of Navier–Stokes equations in porous media: Theoretical, numerical and experimental approach. Computers and Geotechnics, 36(7): 1200-1206. https://doi.org/10.1016/j.compgeo.2009.05.006
[11] Du, D.X., Beni, A.N., Farajzadeh, R., Zitha, P.L. (2008). Effect of water solubility on carbon dioxide foam flow in porous media: An X-ray computed tomography study. Industrial & Engineering Chemistry Research, 47(16): 6298-6306. https://doi.org/10.1021/ie701688j
[12] Zhang, T., Lu, D., Li, D. (2009). Porous media reconstruction using a cross-section image and multiple-point geostatistics. In 2009 International Conference on Advanced Computer Control, pp. 24-29. https://doi.org/10.1109/ICACC.2009.33
[13] Wang, M., Wang, J., Pan, N., Chen, S. (2007). Mesoscopic predictions of the effective thermal conductivity for microscale random porous media. Physical Review E, 75(3): 036702. https://doi.org/10.1103/PhysRevE.75.036702
[14] Koch, D.L., Hill, R.J. (2001). Inertial effects in suspension and porous-media flows. Annual Review of Fluid Mechanics, 33(1): 619-647. https://doi.org/10.1146/annurev.fluid.33.1.619
[15] Wang, M.R., Fan, J.P., Hu, J. (2018). A non-probabilistic reliability-based design optimization method for structures based on interval models. Fatigue & Fracture of Engineering Materials & Structures, 41(2): 425-439. https://doi.org/10.1111/ffe.12698
[16] Orbach, R. (1986). Dynamics of fractal networks. Science, 231(4740): 814-819. https://doi.org/10.1126/science.231.4740.814