Okky Putra Barus*![]() | Celine Nathasya
| Celine Nathasya![]() | Jefri Junifer Pangaribuan
| Jefri Junifer Pangaribuan![]()
© 2023 IIETA. This article is published by IIETA and is licensed under the CC BY 4.0 license (http://creativecommons.org/licenses/by/4.0/).
OPEN ACCESS
The vast development of information technology causes an explosion in the amount of data, yet the data must be processed to obtain useful insights. The use of data is needed to study the needs, behavior, and customer’s value which are meant to build better relationships or what is often referred to Customer Relationship Management (CRM). As the company grows, data is getting abundant and more difficult to interact directly with customers and problems such as marketing campaigns that are less effective can result in losses if not immediately addressed. Therefore, customer segmentation was carried out using recency, frequency, and monetary (RFM) as variables and K-Means clustering by determining the number of clusters using the elbow method and silhouette score. Based on the analysis results, there are three types of clusters, categorized as best customers, may not lost customers, and average customers.
CRM, RFM, K-Means, elbow method, silhouette score
With the development of information technology causing an explosion in the amount of data, society has become very exposed to big data. Every daily activity can be linked to data, as small as sending money to relatives. In this era, it is often heard saying that data is the new oil of the new economy, which means that data is valuable for today's economy.
However, data is likened to oil which is a raw material that cannot be used directly. The raw data must be processed first to generate insight [1]. These insights can be used to get more opportunities, especially to develop a business. Market competition requires business owners to always be able to understand the market that continues to grow rapidly [2].
The use of data can have an impact on the financial technology (fintech) industry, one of which is customer profiling to determine the best potential customers. Many companies use Customer Relationship Management (CRM) strategies to study the needs, behaviors, and values of customers to build better relationships with them [3]. However, as the size of the company grows as well as the collection of data, large companies have difficulty understanding customer needs and behavior because the company may not be able to interact directly with customers. As for problems such as ineffective targeting of marketing campaigns, such as effectiveness in terms of costs incurred and returns that can be obtained from customers. In addition to being less effective, this can also cause losses for the company if it is not addressed immediately.
From these problems, the solution that can be used is to make customer segmentation according to RFM analysis. Segmentation using RFM analysis aims to group customers based on recency, frequency, and monetary. Meanwhile, segmentation will be carried out using an unsupervised machine learning method, the K-Means algorithm. K-Means is a method for analyzing data and conducting data observations where data is treated as an object that is observed based on the location and distance between some data. K-Means groups these objects into several cluster groups (K) where objects in the same cluster are expected to have a close distance but are far from other cluster objects [4]. According to previous research, K-Means is believed to provide more accurate grouping results compared to manual grouping [5]. In addition, the experiment conducted by previous research comparing the fuzzy C-Means method with the K-Means method also shows that the K-Means method produces similar outputs and faster computation time [4].
2.1 Customer Relationship Management (CRM)
CRM is a process used by companies to strengthen business relationships with customers. The purpose of CRM is to increase customer loyalty which is expected to increase business profits [6, 7]. According to another study, CRM is a process to streamline, reduce operational costs and improve customer interaction and experience [8].
CRM is also referred to as a corporate strategy for running a business. Businesses that focus on all aspects to improve customer satisfaction are called customer-centric. To be customer-centric, companies must collect customer data. Information about customers can be used as consideration for providing appropriate promotions, services, programs, messages, and media choices. Ideally, customer data stored is purchase history, demographics, opinions, media preferences, and so on [9].
Previous researchers have conducted empirical studies and proved that the presence of CRM can improve business performance [10]. Some examples of the benefits of implementing CRM are:
2.2 Customer profiling
Customer Profiling is a way to create groups of customers based on similar characteristics or behavior. The customer profile usually includes demographics, customer behavior in using the product, the journey or where the user interacts with the company, and the value of customer transactions [11].
Profiling aims to help digital marketers provide services and communicate more effectively with existing customers. The way to do a customer profile is to collect similar customer data and then put it together and analyze it. In addition, the shape that has been formed can also be used to find new customers [12].
2.3 Recency, Frequency and Monetary (RFM)
RFM is an effective and leading analytical technique in database marketing. RFM is widely used to assess and rank customers based on their transaction history [13]. In practice, the results of the RFM analysis will be given a number code to mark the best customer to the customer with a minor effect on the business.
Each RFM value is taken at a predetermined period to carry out the analysis. The recency value is the distance between the last transaction date and the specified period. The frequency value is taken from the number of transactions made by the customer. The monetary value is taken from the total volume of transactions made by the customer.
In the most basic application of RFM Analysis, the results of the RFM analysis will be given a number code to mark the best customer to the customer with a minor effect on the business. However, the scoring technique using numbering still needs to improve because customers can be grouped with quite different criteria. Therefore, in this era, RFM grouping usually uses machine learning.
2.4 K-Means clustering
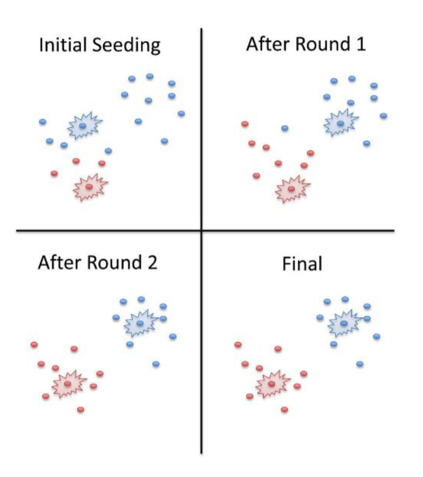
K-Means Clustering is an algorithm that requires several parameters and cluster values as input. The data then partitioned according to the pre-determined number of clusters. K-Means has several advantages over other methods. Some of the benefits K-Means is relatively simple to implement, scales large data sets, guarantees convergence, and adapts easily to new instances [14]. K-Means performs an iteration process where the computer will calculate the centroid value before each iteration process. After that, the data points will be matched to the cluster that has the closest centroid. The above process will continue to repeat until the results of the cluster obtained are similar to the results of the previous iteration. Figure 1 shows the K-Means Iteration Visualization Until the Final Results.
Figure 1. Visualization of K-means iterations to the final result
The stages in K-Means Clustering are as follows [15]:
3.1 Research stages
This study will use a cross-sectional transaction data set owned by a remittance company. The proposed method is K-Means Clustering. Then, indicators or variables used as inputs are recency, frequency, and monetary value (RFM). Next, the cluster results will be re-evaluated using a silhouette score before being analyzed and interpreted.
Creating customer profiles based on RFM Analysis using the K-Means Clustering method will begin with research preparation, such as writing the research background, formulating the problems to be discussed, and determining research objectives and problem boundaries. After that, a literature study is needed to add insight into customer profiles, RFM analysis, and K-Means. The application of RFM Analysis using the K-Means Clustering method will use the Google Collaboratory tool as a web IDE to write the Python programming language.
The next step is continued with the collection of data needed for this research. Then, the data collection will be processed with the implementation of K-Means, starting with data preprocessing, clustering, and evaluation of cluster results.
The cluster results will be analyzed and given a profile according to each cluster's recency, frequency, and money value variables. The last stage is to conclude from research results. Figure 2 shows the flow of research stages.
Figure 2. Research stages
3.2 Research model
The proposed research model procedures will be done in the order, starts by:
3.2.1 Data cleaning
The data should be cleaned and checked for completeness of the data, whether the data format in each row and column is consistent and correct, and whether the data type used is correct, and then cleaning the data, which can be in the form of discarding, filling in, or other actions according to the researcher's consideration for the row/column of the data.
3.2.2 Transform data
After the data is cleaned and consistent, it will be converted into RFM format. This action is performed so that the data fits the format and can be used for further analysis.
3.2.3 Scale data
The transformed data will then be scaled using the Robust Scaler method, and the calculations will be assisted with the Scikit-Learn library so that the values are within a specific range. The purpose of this scaler is that the presence of outliers can have a negative impact on the mean or variance. Therefore, using the median and the interquartile can give better results [16].
Robust Scaler formula:
$x_o=\frac{x_i-Q_1(x)}{Q_3(x)-Q_1(x)}$ (1)
xo = value after scaling
xi = value before scaling
Q1 (x) = first quartile of data set
Q3 (x) = third quartile of data set
3.2.4 Define K using elbow method
The elbow method is a well-known method for determining the number of clusters. To make the calculation, it takes the value within-cluster sum of squared (WSS) or inertia. WSS is the sum of the squared errors, which is the square of the distance between each point and the centroid of the cluster. This calculation will be assisted by implementing the Scikit-Learn library.
Inertia formula:
inertia $=\sum_{i=0}^n \min \left(\left\|x_i-\mu_j\right\|^2\right)$ (2)
uj = mean of cluster’s sample
xi = each sample from a cluster
n = number of clusters
3.2.5 Re-evaluate K using silhouette score
To determine the value of K, it is not enough just to use the elbow method. Silhouette score is used to reduce doubt when choosing K. silhouette score calculates how close a point is to that cluster of points compared to other clusters. The value will be between minus one to one, where the closer to one, the better. To calculate the distance between points, we will use Euclidean Distance. Calculation of this silhouette score will also be assisted by applying the silhouette library.
Formula for silhouette score [17]:
Silhouette score $=\frac{b-a}{\max (a, b)}$ (3)
a = average of the intra-cluster distance
b = distance between each sample to another cluster
The formula for Euclidean distance [18]:
$D_{1,2}\left(x_2 x_1\right)=\sqrt{\sum_{j=1}^p\left(x_{2 j}-x_{1 j}\right)^2}$ (4)
p = data dimension
x1 = first data point location
x2 = second data point location
3.2.6 Analyze the result
Customer data that has passed into clusters, each cluster will be analyzed based on recency, frequency, and monetary value. After that, each cluster will be given a marker, such as clusters that rarely make transactions but have large volumes of shipments. Finally, recommendations will be given to improve the marketing team's performance.
4.1 Research data collection
The data were provided by a remittance company and obtained in the form of cross-sectional historical transactions. This data set has 16,648 rows and 18 columns, where the earliest recorded transaction was made on January 1, 2021, and the last recorded transaction was made on December 31, 2021. The 18 attributes in the column used in this study are Member ID, type of remittance service used, type of service, name of the destination country, sender's currency, recipient's currency, marked-up source amount, transaction status, time the transaction was made, time transactions sent and received by the recipient, the device used to make the transaction, and the purpose of the remittance.
4.2 Research result
4.2.1 Data pre-processing
There are three main processes to be completed prior to clustering, which is data cleaning, transforming data, and data scaling [19].
It includes checking null values and reassigning the correct data type.
Historical transaction data cannot be used for RFM analysis, and the data will be transformed or converted into per-customer data with RFM variables which are recency, frequency, and monetary value. The data transformation process consists of making transaction date limits, creating RFM data using the aggregate function to get RFM values, and renaming according to RFM. From the results of the transformation of the data form, a total of 2,226 customers made transactions in 2021.
The data will then be scaled to have a specific range. In this study, the data set will be mounted using the Robust Scaler.
4.2.2 Data clustering
After the data is scaled, the data can be processed into clusters by determining the value of K using the elbow method using the within-cluster sum of squared (WSS) calculation. After being visualized, Figure 3 shows the best elbow is three.
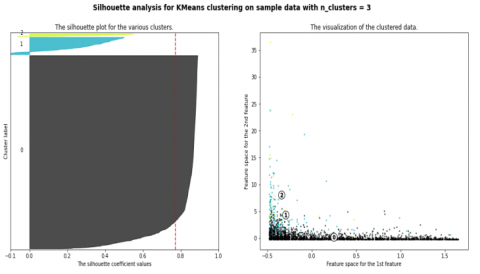
This method is used to gain more confidence in selecting the most appropriate number of clusters. This study uses the silhouette score method using the Euclidean distance. The results of the silhouette score can be seen in Figure 4. The number of silhouette scores also indicates that the number of the best cluster was 3.
From both methods, the optimum number of clusters were 3 clusters.
4.2.3 Data analysis
After going through the process of selecting the optimal number of clusters, the data will be labeled. Data labeled with a cluster number has a data distribution, as shown in Figure 4.
Figure 3. WSS visualization to determine number of K
Figure 4. Silhouette score visualization for 3 clusters
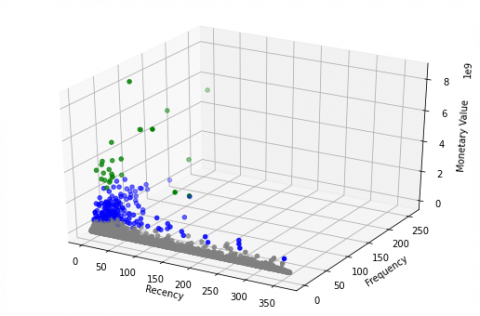
Figure 5. Data distribution graphic for each cluster
It can be seen in Figure 5 that there are three types of colors that mark each cluster. The gray color represents data cluster 0 (zero), the blue color indicates data cluster 1 (one), and the green color indicates data cluster 2 (two). The amount of data in cluster 0 is 2019, in cluster 1 is 181 and in cluster 2 is 26.
After that, a phase was carried out to carry out an RFM analysis to determine the best customer cluster based on the min, median, and max values. Table 1 shows the RFM value.
Table 1. RFM value
|
Cluster |
Recency |
||
|
Min |
Median |
Max |
|
|
0 |
1 |
96 |
363 |
|
1 |
1 |
12 |
348 |
|
2 |
1 |
5 |
163 |
|
Cluster |
Frequency |
||
|
Min |
Median |
Max |
|
|
0 |
1 |
2 |
49 |
|
1 |
4 |
25 |
169 |
|
2 |
2 |
37 |
258 |
|
Cluster |
Monetary |
||
|
Min |
Median |
Max |
|
|
0 |
22.790 |
17.433.810 |
662.289.385 |
|
1 |
240.357.673 |
841.393.900 |
2.363.211.492 |
|
2 |
2.316.189.072 |
3.642.840.000 |
8.359.754.550 |
After conducting an RFM analysis to determine the best customer clusters, it will be followed by an analysis of the customer background per cluster based on the customer's nationality, gender, and location of residence. In addition, an estimate of the average age of customers per cluster is also carried out and followed by an analysis of customer behavior based on the distance between days between transactions, the purpose of the transaction, and the country of destination of the transaction.
For additional information to decide the best cluster show the priority level of customer clusters based on the comparison of the number of members, the volume and frequency of transactions.
Table 2. Member count, transaction volume, and transaction frequency per each cluster
|
Cluster |
Member Count |
% |
Volume |
% |
Frequency |
% |
|
0 |
2019 |
91 |
130 M |
32 |
9122 |
55 |
|
1 |
181 |
8 |
103 M |
25 |
1548 |
9 |
|
2 |
26 |
1 |
173 M |
43 |
5977 |
36 |
From Table 2, cluster 2, which only has 1% of the customer population, accounts for 43% of the total volume and is followed by cluster 1, which has 8% of the customer population, contributing 25% of the total volume. Finally, cluster 0 has 91% of the customer population but only accounts for 32% of the total volume.
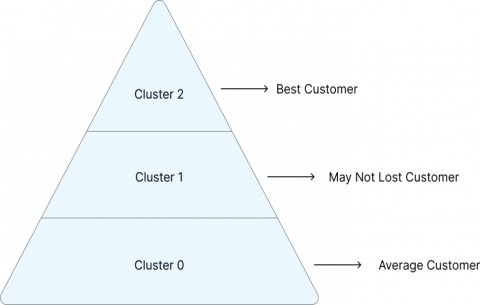
Based on these results, we can compile a graph of the order of the level of customer interest, which can be seen in Figure 6.
Figure 6. Chart of cluster order by customers’ value
RFM analysis, senders’ background information and senders’ transaction behavior were together be analyzed to fully comprehend customer profiles. And the results can be seen in Table 3.
Table 3. Customers’ characteristics for each cluster
|
Characteristic (average) |
Average Customer |
May Not Lost Customer |
Best Customer |
|
Recency |
Three months |
Two weeks |
Five days |
|
Frequency |
Two times |
25 times |
37 times |
|
Monetary |
Low |
Quite high |
Very high |
|
Gender and Residence |
WNI Male, resides at DKI Jakarta, Jawa Timur, and Jawa Barat |
WNI Male, resides at DKI Jakarta, Jawa Timur, and Sumatera Utara |
WNI Male, resides at DKI Jakarta, Jawa Barat, and Sumatera Utara |
|
Age |
35 - 37 |
34 - 35 |
35 - 37 |
|
Duration in between transaction |
21 - 41 days |
3 - 4 days |
5 - 8 days |
|
Transaction purpose and destination |
Purchase goods and service to Malaysia (frequency) and China (volume) |
Purchase goods and service to Thailand (frequency) and China (volume) |
Purchase goods and service to China (frequency and volume) |
Of the 2,226 that have been divided into these three clusters, the remittance company can make a more specific marketing strategy for each cluster. The marketing strategy considerations can refer to the following customer profiling.
Cluster 0 is a cluster called the average customer. The characteristics of customers in this cluster have an intermediate low transaction frequency, low total transaction volume, and the last transaction takes a long time. Customers in this cluster are primarily men who live in DKI Jakarta, East Java, and West Java. The average age is 35 ± 37 years. Most of the transactions were for purchases of goods and services in Malaysia. The time interval between transactions is 21 ± 41 days.
Cluster 1 is a cluster that is referred to as may not lost customers. The characteristics of customers in this cluster have a relatively high average transaction frequency, a relatively high total transaction volume, and make the last transaction shortly. Customers in this cluster are primarily men who live in DKI Jakarta, East Java, and North Sumatra. The average age is 34 ± 35 years. The most significant transactions were for purchases of goods and services in Thailand. The time interval between transactions is three ± four days.
Cluster 2 is a cluster called the best customer. The characteristics of customers in this cluster have an average high transaction frequency, high total transaction volume, and make the last transaction in a short time. Customers in this cluster are primarily men who live in DKI Jakarta, West Java, and North Sumatra. The average age is 35 ± 37 years. The most significant transactions were for purchases of goods and services in China. The time interval between transactions is five ± eight days.
From the research above, K-Means Clustering with RFM variable is performed using elbow and silhouette method which produces three clusters. A total of 2226 customers are divided into three clusters, namely: (1) Average Customers which have the lowest value, (2) May Not Lost Customer which have middle value, (3) Best Customers which have the highest value.
As for improvements that can be considered for future research, in addition to recency, frequency, and monetary, other attributes can also be added, such as customer lifetime value (CLV). Apart from that, PDAT also built a classification system to help mark customers who will churn or who will provide returns. In addition to the case of remittances, the analysis can be developed further by adding other attributes, such as the type of customer and whether this customer is a personal or corporate type. More specific locations can also be used for more accurate demographic analysis.
This work is supported by LPPM (Lembaga Penelitian dan Pengabdian kepada Masyarakat) of Universitas Pelita Harapan.
[1] Loi, M., Dehaye, P.O. (2022). If data is the new oil, when is the extraction of value from data unjust? Philosophy and Public Issues, 7(2): 137-178. https://doi.org/10.5167/uzh-159945
[2] Sun K., Li Y.P., Roy U. (2017). A PLM-based data analytics approach for improving product development lead time in an engineer-to-order manufacturing firm. Mathematical Modelling of Engineering Problems, 4(2): 69-74. https://doi.org/10.18280/mmep.040201
[3] Kim, M., Park, J.E., Dubinsky, A.J., Chaiy, S. (2012). Frequency of CRM implementation activities: A customer‐centric view. Journal of Services Marketing, 26(2): 83-93. http://dx.doi.org/10.1108/08876041211215248
[4] Jipkate, B.R., Gohokar, V.V. (2012) A comparative analysis of fuzzy c-means clustering and K-Means clustering algorithms. International Journal of Computational Engineering Research, 2(3): 737-739. http://www.ijceronline.com/papers/Vol2_issue3/T023737739.pdf .
[5] Gustriansyah, R., Suhandi, N., Antony, F. (2020). Clustering optimization in RFM analysis based on K-Means. Indonesian Journal of Electrical Engineering and Computer Science, 18(1): 470-477. http://dx.doi.org/10.11591/ijeecs.v18.i1.pp470-477
[6] Paliouras, K., Siakas, K.V. (2017). Social customer relationship management: A case study. International Journal of Entrepreneurial Knowledge, 5(1): 20-34. http://dx.doi.org/10.1515/ijek-2017-0002
[7] Pangaribuan, J. J., Margono, H., Barus, O. P., Pratama, Y. A., Maulana, A. (2022). Sales, purchase, and inventory information system design at SMEs. In 2022 1st International Conference on Technology Innovation and Its Applications (ICTIIA), IEEE, pp. 1-6. https://doi.org/10.1109/ICTIIA54654.2022.9935929
[8] Fleerackers, T., Bilgeri, N. (2022). Artificial intelligence improving CRM, sales and customer experience. An Analysis of an International B2B Company. https://opus.fhv.at/frontdoor/deliver/index/docId/3646/file/BilgeriNadine_MasterThesis.pdf.
[9] Dhillon, R., Kaur, S. (2012). Review paper on e-business & CRM. International Journal of Computing & Business Research. [Online]. Available: http://www.researchmanuscripts.com/isociety2012/64.pdf.
[10] Gil-Gomez, H., Guerola-Navarro, V., Oltra-Badenes, R., Lozano-Quilis, J.A. (2020). Customer relationship management: Digital transformation and sustainable business model innovation. Economic Research-Ekonomska Istraživanja, 33: 2733-2750. https://doi.org/10.1080/1331677X.2019.1676283
[11] How to Build a Customer Profile for Effective Marketing. https://www.experian.co.uk/assets/marketing-services/white-papers/wp-the-art-of-customer-profiling.pdf, accessed on Nov. 19, 2022.
[12] Sabuncu, I, Turkan, E., Polat, H. (2020). Customer segmentation and profiling with RFM analysis. Turkish Journal of Marketing, 5(1): 22-36. http://dx.doi.org/10.30685/tujom.v5i1.84
[13] Christy, A. J., Umamakeswari, A., Priyatharsini, L., Neyaa, A. (2021). RFM ranking – An effective approach to customer segmentation. Journal of King Saud University-Computer and Information Sciences, 33(10): 1251-1257. https://doi.org/10.1016/j.jksuci.2018.09.004
[14] Chen, J., Zhang, J.Y., Wu, J.H., Wu, Y.S., Si, H.P., Lin, K.Y. (2020). Review on the research of K-Means clustering algorithm in big data. In 2020 IEEE 3rd International Conference on Electronics and Communication Engineering (ICECE), pp. 107-111. https://doi.org/10.1109/ICECE51594.2020.9353036
[15] Novy, A., Fajrian, N.A.M.C. (2016). Costumer profiling dari produk asuransi dengan menggunakan metode K-Means manhattan distance. Di Bpjs Ketenagakerjaan Semarang. http://eprints.dinus.ac.id/21886/3/jurnal_19074.pdf.
[16] Pedregosa, F., Varoquaux, G., Gramfort, A., Michel, V., Thirion, B., Grisel, O., Blondel, M., Prettenhofer, P., Weiss, R., Dubourg, V., Vanderplas, J.T., Passos, A., Cournapeau, D., Brucher, M., Perrot, M., Duchesnay, E. (2011). Scikit-learn: Machine learning in Python Pedregosa. Journal of Machine Learning Research, 12: 2825-2830, 2011.
[17] Scikit-learn: Machine Learning in Python Gaël Varoquaux Bertrand Thirion Vincent Dubourg Alexandre Passos Pedregosa. http://scikit-learn.sourceforge.net.
[18] Banerjee S., Ghosh A., Mitra S.K. (2017). A modified mathematical model for lifetime enhancement in wireless sensor network. Mathematical Modelling of Engineering Problems, 4(2): 84-90. http://dx.doi.org/10.18280/mmep.040204
[19] Barus, O., Surantha, N. (2020). The classification of arrhythmia using the method of extreme learning machine. ICIC Express Letters. http://www.icicel.org/ell/contents/2020/12/el-14-12-02.pdf.