Kusmiyati Kusmiyati* | Ahmad Fudholi
© 2022 IIETA. This article is published by IIETA and is licensed under the CC BY 4.0 license (http://creativecommons.org/licenses/by/4.0/).
OPEN ACCESS
The microwave convective dryer integrated photovoltaic has the potential equipment to be used for coffee drying. Therefore, this study aims to examine the performance of microwave convective dryer integrated photovoltaic for coffee bean drying. The kinetics and effectiveness diffusivity were determined to describe the drying process”. Drying model for the coffee bean drying process using variations in sample mass, coffee bean condition, and drying power. The results showed that reducing the water content of coffee beans from 47% (wb) to 11% (wb) required drying times of 10, 8, and 6 minutes at 600 W (medium), 650 W (medium-high), and 700 W (high), respectively. Drying coffee beans with a microwave convective dryer system shows that the Wang and Singh model is the best model for drying coffee beans; resulting in the highest R2 (0.99) and the lowest MBE and RMSE. Therefore, Wang and Singh model can be used to accurately predict the moisture content of dry coffee beans in a microwave convective dryer system. The effective diffusivity of coffee beans increased from 3.19×10⁻⁷ m/s to 1.19×10⁻⁶ m2/s when the power drying increased from 600 W to 700 W.
solar energy, microwave, drying kinetic, drying model, effective diffusivity
In the food industry, drying is a food preservation precaution that can provide advantages in terms of space, storage period, transportation, product weight, and quality maintenance. Traditionally, crowded users, especially farmers, use direct drying methods or drying under the sun to prevent damage and rotting of harvest. Plants for drying are placed in an open area and left under the sun for direct exposure. Agricultural products that are often dried include rice and tea leaves. However, open drying presents several disadvantages, such as insect and rodent attacks and hygienic factors [1]. The success of drying also depends on several factors, such as weather, hotness, humidity, and wind. These factors can affect the quality and quantity of the dried product. The drying process involves the dehydration of dried material. In this process, water is removed from a substance where physical and mass transfer changes occur. Mass transfer is the change in water particles in a material. Drying is accomplished when the dried material loses part or all of its water content. During drying, the main process is evaporation, which occurs when water becomes a volatile material, i.e. when heat conditions are applied to the substance. Drying can also occur through other means by breaking the bonds of water molecules in the material. When the water molecule bonds consisting of elemental oxygen and hydrogen are solved, the molecule is released from the material. Consequently, the material loses its water [2-6].
Many methods have been studied to improve the quality of coffee beans and reduce drying time, such as the use of mechanical drying for the drying kinetics of Arabic coffee at low relative humidity and different temperatures [7]. The mechanical drying method is carried out by placing cherries or coffee beans in a sieve, after passing hot air over the cherries or coffee beans at a temperature of 45℃ for coffee cherries and a temperature of 40℃ for coffee beans [8]. Some studies have studied used the mathematical models of drying kinetics for agricultural products. Ten drying models are commonly used in analyzing material drying kinetics. These models include Page, Newton, Logarithmic, Modified Page, Two Terms, Henderson and Pabis, diffusion approach, modified Herderson and Pabis, Midilli et al. and the offset modified Page models. Newton, Page and Henderson, and Pabis models were used [9-13]. The effectiveness of drying the material and the required drying time can be obtained from these models [9]. Drying is carried out on the material contained in the layer which is subjected to airflow with near-constant relative humidity and temperature, and constant moisture content and material temperature in the thin layer drying model [10]. For various products, several mathematical models describing film drying have been developed. The models commonly used are Newton, Henderson and Pabis, Page, Adapted Thompson, Two Terms, and Wang and Sing [11]. Proposed one of the best models describing the process of drying coffee in a microwave convective dryer [12].
Many different sources can be used to power the drying process, one of which is the microwave dryer, which uses electricity as a power source. The use of microwave dryers, particularly in coffee plantations, necessitates the use of a power source. Because a power source is not available in some existing coffee plantations, coffee beans must be obtained from plantation areas for the post-harvest coffee process. However, no studies have been conducted to investigate the microwave convective dryer integrated PV system for drying kinetics of coffee beans. Therefore, this study aimed to evaluate the drying performance of coffee beans using a microwave convective dryer with integrated PV. Drying kinetic models such as Newton, Henderson and Pabis, Page, Midilli, Wang and Singh, Logarithmic were used to evaluate the effective diffusivity and energy of activation for the coffee bean. An experiment in the drying process were carried out to study the effects of various air coffee beans mass (25-100 grams) and the microwave power (600-700 W on the drying time). The drying models were also utilized with the experimental data to effective diffusivity of the drying kinetics of coffee beans.
Coffee beans are dried using the microwave convective dryer, as shown in Figure 1. This dryer is composed of a microwave chamber, PV panels, inverter, solar charge controllers, and batteries. Coffee beans are spread on a tray in the chamber. The location of the microwave generator in the chamber is on the top side of the chamber. The air temperature in the chamber, sample mass, and moisture content were all measured during the drying process.
Coffee beans were obtained from Jember, East Java. The moisture contents of the coffee beans that had undergone a process of depulping and washing were (47%±1% (wb). The drying time was terminated until the coffee beans reached a moisture content of 12% (wb) or for 20 minutes for each sample. Furthermore, the characteristics of the coffee beans were evaluated according to the Indonesian National Standard [14]. The water content of coffee beans was determined by the AOAC method which was proposed by Fudholi [13, 15]. Four variations were used, namely, variations in conditions, mass, and power from a microwave convective dryer.
Figure 1. Microwave convective drying system integrated PV system
The mass variation used was 25-100 grams of coffee beans and observed every two minutes until the water content reached 12% (wb). As for the power variation, three independent variables are used, namely high power (700 W), medium-high power (650 W), and medium (600 W). Variations in coffee beans were only observed at a mass of 25 grams and a high drying power of 700 W. Using a drying model, the drying kinetics of coffee beans were determined. The empirical method incorporates the thin-film drying model [16]. Since the drying rate model uses an empirical approach, it does not address physical mass transfer events and instead relies on experimental compatibility with existing drying models [11]. Mathematically the drying model used in this study is shown in Eq. (1):
$M R=\frac{M-M_e}{M_i-M_e}$ (1)
where, MR is moisture ratio, M is moisture content, Me is equilibrium moisture content, and Mi is initial moisture content. The moisture content of the coffee beans (X) can be obtained through dry or wb. The dry basis of the moisture content (db) [17, 18]:
$X=\frac{w(t)-d}{d}$ (2)
The wet basis of moisture content (wb) is as:
$X=\frac{w(t)-d}{w} \times 100 \%$ (3)
where, d is the mass of dry coffee beans, and w(t) is the mass of wet coffee beans at instant t. The Fick diffusion equation for an infinite slab is used to calculate the effective moisture diffusivity as:
$\frac{X_t-X_e}{X_i-X_e}=\sum_{n=0}^1 \frac{8}{(2 n+1)^2 \pi^2} \exp \left(-D_{e f f} \frac{(2 n+1)^2 \pi^2 t}{4 L^2}\right)$ (4)
where, Deff is the effective diffusivity (m2/s), and L is the half-thickness (m). Xe, Xt, and Xi, represent the equilibrium moisture content, the initial moisture content, and the moisture content at time t, respectively, which are all expressed as a dry basis (db). For particles with slab geometry and long drying times [19], the following equation is used:
$\frac{X_t-X_e}{X_i-X_e}=M R=\frac{8}{\pi^2} \exp \left(-D_{e f f} \frac{\pi^2 t}{4 L^2}\right)$ (5)
where, MR is the moisture ratio. Eq. (5) can be rewritten as follows:
$M R=A \exp (-k t)$ (6)
where,
$k=\frac{\pi^2 D_{e f f}}{4 L^2}$ (7)
Effective diffusivity (Deff) can be related to the temperature by the Arrhenius equation as follows:
$D_{e f f}=D_0 \exp \left(-\frac{E_a}{R T}\right)$ (8)
Table 1 shows drying models for fitting with experiment data. Statistical tests were performed to determine the best model for drying coffee beans with the microwave convective dryer system. The coefficient of determination (R2), sum squared error (SSE), and root mean squared error (RMSE) are formulated in Eqns (9), (10), and (11) as follows:
$R^2=1-\frac{\sum_{i=1}^{i=N}\left(M R_{\text {predict }, i} \quad \quad - \quad M R_{\text {experiment }, i} \quad \quad \right)^2}{\sum_{i=1}^{i=N}\left(M R_{\text {experiment}, i } \quad \quad - \overline{M R}_{\text {experiment }, i} \quad \quad \right)^2}$ (9)
SSE $=\sum_{i=1}^n\left(M R_{\text {predict }, i}-\overline{M R}_{\text {experiment }, i} \quad \right)^2$ (10)
$R M S E=\sqrt{\left[\frac{1}{N} \sum_{i=1}^N\left(M R_{\text {predict }, i}-M R_{\text {experiment }, i} \quad \quad \right)^2\right]}$ (11)
Table 1. Drying models [1, 2]
|
Drying model |
Equation |
|
Newton |
MR=exp(-kt) |
|
Page |
MR=exp(-ktn) |
|
Henderson and Pabis |
MR=a exp(-kt) |
|
Midilli et al. |
MR=a exp(-ktn)+bt |
|
Wang and Singh |
MR=1+bt+at2 |
|
Logarithmic |
MR=a exp(-kt)+c |
PV system was integrated in microwave convective dryer systems as power sources. The equipment is installed and there are several parameters, such as current, potential difference, and temperature rise used to assess the electrical parameters of PV system. Power (P) is a parameter that can be calculated using Eq. (12) based on the potential difference (V) and measured current (i):
P=Vi (12)
3.1 Drying kinetics of coffee beans with varying drying power
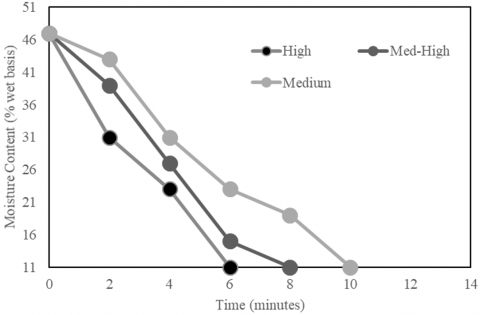
A drying curve is created using samples that are dried under various sample conditions and drying power. As shown in Figure 2, the desired moisture content for the coffee beans can be quickly achieved for 10 minutes because the fruit condition has a significant effect on the drying rate. The moisture content in the coffee beans decreased from 47% (wb) to 11% (wb) in 6, 8, and 10 minutes for high, medium-high, and medium microwave power, respectively. The condition of coffee beans, which leaves little mucilage, facilitates water movement. A high temperature and increasing power variation shorten drying time [20].
Figure 2. Drying kinetics of coffee beans under varying drying power
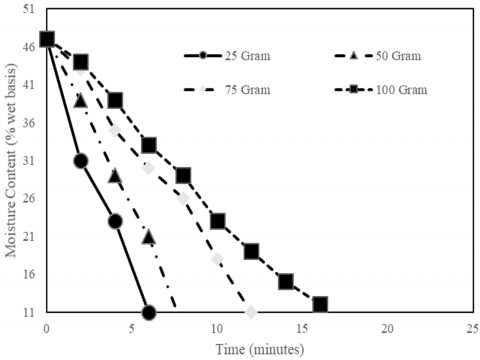
3.2 Drying kinetics of coffee beans with varying mass
The drying of coffee beans (Figure 3) shows a drying model that gradually increases with sample mass, and surface area decreases for the evaporation of water in the sample [21]. Notably, for every twofold increase in the mass of the sample, the drying time is as Eq. (13):
$t_{d r y i n g}=\frac{2 n}{3} . t_{\text {initial }}$ (13)
where, n is the multiplier of mass. For example, in a sample with a mass of 25 grams, 6 minutes is needed to reach the required moisture content. With Eq. (13), for a sample of 75 grams which is three times the initial amount, 12 minutes is needed to achieve a moisture content of 12% (wb).
Figure 3. Drying kinetics of coffee beans with varying mass
3.3 Drying models
In this drying model, the drying rate is assumed to be proportional to the equilibrium moisture content of the material and the change in moisture content. The statistical parameters R2, SSE, and RMSE were used to assess the fit between drying models with the experimental data, as shown in Tables 2 and 3. The higher the R2 value (closer to 1), the better the model, and the lower the SSE and RMSE values.
In this study, the effective diffusivity values for all samples were relatively uniform at 10-7 m2/s, and only one sample had a value of 10-6 m2/s. Table 4 indicates that the effective diffusivity value decreases with increasing mass. Hence, when sample mass increases, the displacement of water is hindered because the energy required for water movement increases [22]. The effective diffusivity value obtained in this study was relatively uniform at 10−7 m2/s for all samples. Table 5 shows that the effective diffusivity value increases with temperature, supporting the results in previous studies [20, 23]. The effective diffusivity value in this study is relatively greater than the value obtained by Suherman [24], who stated that the effective diffusivity value of coffee beans ranges from 2.87×10⁻¹⁰ m2/s to 1.80×10⁻¹⁰ m2/s when a hybrid solar drying system and LPG gas are used, and the value obtained by Phitakwinai [20], who reported that the effective diffusivity range of coffee beans ranges from 7.75×10⁻¹⁰ m2/s to 1.45×10⁻¹⁰ m2/s when an air-flow dryer is used. The high effective diffusivity value of a microwave convective dryer system despite the presence of barriers, such as the flesh of coffee beans, makes this system suitable for obtaining samples with relatively uniform drying quality and has a shorter drying time than hybrid solar or air-flow drying systems.
Table 2. Results of drying model analyses for drying power variation
|
Drying model |
Power (W) |
a |
b |
c |
k |
n |
R2 |
SSE |
RMSE |
|
Newton |
600 |
0.1068 |
0.9502 |
0.01341 |
0.0579 |
||||
|
650 |
0.1597 |
0.9555 |
0.01896 |
0.06885 |
|||||
|
700 |
0.2076 |
0.9814 |
0.005748 |
0.04377 |
|||||
|
Henderson Pabis |
600 |
1.046 |
0.1156 |
0.9609 |
0.01054 |
0.05926 |
|||
|
650 |
1.049 |
0.1698 |
0.9627 |
0.0159 |
0.07279 |
||||
|
700 |
1.007 |
0.2094 |
0.9816 |
0.005698 |
0.05338 |
||||
|
Page |
600 |
0.05353 |
1.401 |
0.9823 |
0.004775 |
0.0399 |
|||
|
650 |
MEET INF CONDITION |
||||||||
|
700 |
0.1703 |
1.141 |
0.9849 |
0.004685 |
0.0484 |
||||
|
Midilli |
600 |
1.015 |
0.0593 |
1.356 |
0.9833 |
0.004509 |
0.04748 |
||
|
650 |
1.005 |
0.07332 |
1.48 |
0.9945 |
0.002354 |
0.03431 |
|||
|
700 |
0.995 |
0.1669 |
1.151 |
0.9849 |
0.004661 |
0.06827 |
|||
|
Wang and Singh |
600 |
0.000343 |
-0.0803 |
0.9688 |
0.008411 |
0.05295 |
|||
|
650 |
0.002059 |
-0.1159 |
0.9829 |
0.00729 |
0.04929 |
||||
|
700 |
0.006159 |
-0.1624 |
0.9889 |
0.003431 |
0.04142 |
||||
|
Logarithmic |
600 |
-70.2 |
71.2 |
-0.00111 |
0.9687 |
0.008438 |
0.06495 |
||
|
650 |
2.401 |
-1.379 |
0.05207 |
0.9838 |
0.006883 |
0.05866 |
|||
|
700 |
1.688 |
-0.6984 |
0.09632 |
0.9901 |
0.003054 |
0.05526 |
|||
Table 3. Results of drying model analyses for mass variation
|
Model Name |
Mass (gram) |
a |
b |
c |
k |
n |
R2 |
SSE |
RMSE |
|
Newton |
25 |
0.2076 |
0.9814 |
0.005748 |
0.04377 |
||||
|
50 |
0.1443 |
0.9364 |
0.02556 |
0.07994 |
|||||
|
75 |
0.0885 |
0.9427 |
0.02634 |
0.06626 |
|||||
|
100 |
0.0707 |
0.9605 |
0.02298 |
0.0536 |
|||||
|
Henderson Pabis |
25 |
1.007 |
0.2094 |
0.9816 |
0.005698 |
0.05338 |
|||
|
50 |
1.049 |
0.154 |
0.9442 |
0.02245 |
0.08651 |
||||
|
75 |
1.058 |
0.0964 |
0.9544 |
0.02096 |
0.06475 |
||||
|
100 |
1.066 |
0.07777 |
0.9744 |
0.01492 |
0.04617 |
||||
|
Page |
25 |
0.1703 |
1.141 |
0.9849 |
0.004685 |
0.0484 |
|||
|
50 |
0.0515 |
1.609 |
0.9886 |
0.004586 |
0.0391 |
||||
|
75 |
0.03073 |
1.509 |
0.9881 |
0.005486 |
0.03313 |
||||
|
100 |
0.02577 |
1.434 |
0.9992 |
0.0004666 |
0.008164 |
||||
|
Midilli |
25 |
0.995 |
0.1669 |
1.151 |
0.9849 |
0.004661 |
0.06827 |
||
|
50 |
0.9874 |
0.04656 |
1.656 |
0.989 |
0.004425 |
0.04704 |
|||
|
75 |
MEET INF CONDITION |
||||||||
|
100 |
MEET INF CONDITION |
||||||||
|
Wang and Singh |
25 |
0.006159 |
-0.1624 |
0.9889 |
0.003431 |
0.04142 |
|||
|
50 |
-0.00223 |
-0.08229 |
0.9979 |
0.0008295 |
0.01663 |
||||
|
75 |
-0.00077 |
-0.05428 |
0.9945 |
0.00252 |
0.02245 |
||||
|
100 |
0.000113 |
-0.04968 |
0.9942 |
0.003402 |
0.02205 |
||||
|
Logarithmic |
25 |
1.688 |
-0.6984 |
0.0963 |
0.9901 |
0.003054 |
0.05526 |
||
|
50 |
DID NOT CONVERGE |
||||||||
|
75 |
54.48 |
-53.47 |
0.0012 |
0.9929 |
0.003251 |
0.02851 |
|||
|
100 |
3.666 |
-2.642 |
0.01509 |
0.9957 |
0.002526 |
0.02052 |
|||
Table 4. Effective diffusivity values for varying mass
|
Mass (gram) |
Effective diffusivity (m2/s) |
|
25 |
1.19×10⁻⁶ |
|
50 |
7.17×10⁻⁷ |
|
75 |
4.20×10⁻⁷ |
|
100 |
3.19×10⁻⁷ |
Table 5. Effective diffusivity values for varying drying power
|
Power (W) |
Effective diffusivity (m2/s) |
|
600 |
5.22×10⁻⁷ |
|
650 |
7.05×10⁻⁷ |
|
700 |
1.19×10⁻⁶ |
3.4 Current and voltage correlation of microwave convective dryer system
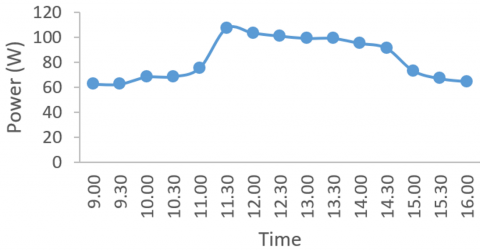
The potential difference and the magnitude of the current as of the dependent variable by solar radiation have been shown in Figure 4. The amount of power generated reaches its peak (100 W) from twelve to one o’clock noon, showing that solar radiation peaks at these hours. In the afternoon, the power produced by the PV panels decreases until four o’clock in the afternoon, only producing 64 W. Changes in solar radiation cause these power fluctuations [25, 26]. Figure 5 shows the power resulting from measuring current and the potential difference can be calculated using Eq. (12).
A microwave convective dryer system with a peak power of 700 W was used in this study. Even though the power generated by the PV panels was less than that required by the microwave, the battery power enabled the PV panels to power the microwave dryer. The PV panels charged the batteries while they supplied power to the microwave dryer. The batteries store electrical energy generated by PV panels without relying on power supply from electric service providers [27].
Figure 6 illustrates the potential difference and power drop in the battery, this shows that the energy is being converted into heat energy. In Figure 5, the microwave convective drying system used reaches a temperature of 78℃ in high mode and 49℃ in medium mode within 10 minutes, and the difference is influenced by the decrease in power and the difference in battery potential.
Figure 4. Correlation between current and voltage in PV panels system
Figure 5. The rated output power of PV panels
Figure 6. Dynamic process of temperature in the dryer
Drying is one of the most important steps in the processing of good-quality coffee. The impact of drying may change on coffee degradation which is resulted from not sufficient dried or over-dried coffee. Industrial drying required minimum energy at maximum drying efficiency. The microwave convective dryer integrated photovoltaic has potential due to it can reduce the use of electricity from fossil where electricity is generated by a renewable energy source. It can improve the quality of dried products and overcome the drawbacks of conventional drying methods which required high energy consumption and a long-time process. This research has examined coffee bean drying kinetics and determined effective diffusivity for the microwave convective dryer integrated photovoltaic. Coffee bean drying was performed using a microwave convective dryer system. The drying experiments were performed at the different power drying of 600, 650, and 700 W with a different mass of 25, 50, 75, and 100 grams. The microwave convective dryer system used reaches a temperature of 49℃ in medium mode and 78℃ in high mode within 10 minutes. The drying kinetics of coffee bean was also presented. Experimental results showed that approximately 12 minutes is required to reduce the moisture content from 47% to 12%. Nonlinear regression methods were used to adjust different drying models, including the Wang and Sing models showing a better fit than other drying models. The findings indicate that Wang and Sing's model is the best drying model to be used in accurately predicting the drying behavior of coffee beans; resulting in the highest R2 value (0.99) and the lowest MBE and RMSE.
This work is supported by the Ministry of Research and Technology of Indonesia/National Research and Innovation Agency (KemendikbudRistek) (Contract number: 13/061031/PB/SP2H/AK.04/2022).
|
MR |
moisture ratio |
|
M |
moisture content |
|
Me |
equilibrium moisture content |
|
Mi |
initial moisture content |
|
X |
moisture content of the coffee beans can be obtained through dry or wet basis |
|
db |
the dry basis of the moisture content |
|
wb |
the wet basis of moisture content |
|
d |
the mass of dry coffee beans |
|
w(t) |
the mass of wet coffee beans at instant t |
|
Deff |
effective diffusivity, m2.s-1 |
|
L |
the half-thickness, m |
|
Xe |
equilibrium moisture content as a dry basis |
|
Xt |
moisture content at time t as a dry basis |
|
Xi |
initial moisture content as a dry basis |
|
R2 |
coefficient of determination |
|
SSE |
sum squared error |
|
RMSE |
root mean squared error |
|
P |
power, W |
|
V |
the potential difference |
|
i |
measured current |
|
n |
the multiplier of mass, grams |
|
t |
time, minutes |
[1] Kusmiyati, K., Fudholi, A. (2021). Solar-assisted microwave convective dryer for coffee cherries. International Journal of Renewable Energy Research (IJRER), 11(1): 407-415. https://doi.org/10.20508/ijrer.v11i1.11686.g8152
[2] Fudholi, A., Bakhtyar, B., Saleh, H., Ruslan, M.H., Othman, M.Y., Sopian, K. (2016). Drying of salted silver jewfish in a hybrid solar drying system and under open sun: modeling and performance analyses. International Journal of Green Energy, 13(11): 1135-1144. https://doi.org/10.1080/15435075.2016.1175347
[3] Fudholi, A., Sopian, K., Bakhtyar, B., Gabbasa, M., Othman, M.Y., Ruslan, M.H. (2015). Review of solar drying systems with air based solar collectors in Malaysia. Renewable and Sustainable Energy Reviews, 51: 1191-1204. https://doi.org/10.1016/j.rser.2015.07.026
[4] Fudholi, A., Sopian, K., Gabbasa, M., Bakhtyar, B., Yahya, M., Ruslan, M.H., Mat, S. (2015). Techno-economic of solar drying systems with water based solar collectors in Malaysia: A review. Renewable and Sustainable Energy Reviews, 51: 809-820. https://doi.org/10.1016/j.rser.2015.06.059
[5] Fudholi, A., Sopian, K., Alghoul, M.A., Ruslan, M.H., Othman, M.Y. (2015). Performances and improvement potential of solar drying system for palm oil fronds. Renewable Energy, 78: 561-565. https://doi.org/10.1016/j.renene.2015.01.050
[6] Fudholi, A., Sopian, K., Yazdi, M.H., Ruslan, M.H., Gabbasa, M., Kazem, H.A. (2014). Performance analysis of solar drying system for red chili. Solar Energy, 99: 47-54. https://doi.org/10.1016/j.solener.2013.10.019
[7] Alves, G.E., Isquierdo, E.P., Borém, F.M., Siqueira, V. C., Oliveira, P.D., Andrade, E.T. (2013). Drying kinetics of natural coffee for different temperatures and low relative humidity. Coffee Sci, 8(2): 238-247.
[8] Olmos, L.C., Duque, E.A., Rodriguez, E. (2017). State of the art of coffee drying technologies in Colombia and their global development. Revista Espacios, 38(29): 27.
[9] Hakim, M.N. (2018). An innovation towards fuel and cost optimization for corn drying process in feed industry. Int. J. Technol. Res. Eng, pp. 6-8.
[10] Kulapichitr, F., Borompichaichartkul, C., Suppavorasatit, I., Cadwallader, K.R. (2019). Impact of drying process on chemical composition and key aroma components of Arabica coffee. Food Chemistry, 291: 49-58. https://doi.org/10.1016/j.foodchem.2019.03.152
[11] Charmongkolpradit, S., Luampon, R. (2017). Study of thin layer drying model for cassava pulp. Energy Procedia, 138: 354-359. https://doi.org/10.1016/j.egypro.2017.10.138
[12] Dong, W., Cheng, K., Hu, R., Chu, Z., Zhao, J., Long, Y. (2018). Effect of microwave vacuum drying on the drying characteristics, color, microstructure, and antioxidant activity of green coffee beans. Molecules, 23(5): 1146. https://doi.org/10.3390/molecules23051146
[13] Fudholi, A., Sopian, K., Othman, M.Y., Ruslan, M.H. (2014). Energy and exergy analyses of solar drying system of red seaweed. Energy and Buildings, 68: 121-129. https://doi.org/10.1016/j.enbuild.2013.07.072
[14] Badan Standarisasi Nasional. (2018). SNI 01-2907-2008 Biji Kopi.
[15] Fudholi, A., Yendra, R., Basri, D.F., Ruslan, M.H., Sopian, K. (2016). Energy and exergy analysis of hybrid solar drying system. Contemp Eng Sci, 9(5): 215-223.
[16] Vijayan, S., Arjunan, T.V., Kumar, A. (2016). Mathematical modeling and performance analysis of thin layer drying of bitter gourd in sensible storage based indirect solar dryer. Innovative Food Science & Emerging Technologies, 36: 59-67. https://doi.org/10.1016/j.ifset.2016.05.014
[17] Yahya, M., Fudholi, A., Sopian, K. (2017). Energy and exergy analyses of solar-assisted fluidized bed drying integrated with biomass furnace. Renewable Energy, 105: 22-29. https://doi.org/10.1016/j.renene.2016.12.049
[18] Yahya, M., Fudholi, A., Hafizh, H., Sopian, K. (2016). Comparison of solar dryer and solar-assisted heat pump dryer for cassava. Solar Energy, 136: 606-613. https://doi.org/10.1016/j.solener.2016.07.049
[19] Maiti, S., Patel, P., Vyas, K., Eswaran, K., Ghosh, P.K. (2011). Performance evaluation of a small scale indirect solar dryer with static reflectors during non-summer months in the Saurashtra region of western India. Solar Energy, 85(11): 2686-2696. https://doi.org/10.1016/j.solener.2011.08.007
[20] Phitakwinai, S., Thepa, S., Nilnont, W. (2019). Thin-layer drying of parchment Arabica coffee by controlling temperature and relative humidity. Food Science & Nutrition, 7(9): 2921-2931. https://doi.org/10.1002/fsn3.1144
[21] Karam, M.C., Petit, J., Zimmer, D., Djantou, E.B., Scher, J. (2016). Effects of drying and grinding in production of fruit and vegetable powders: A review. Journal of Food Engineering, 188: 32-49. https://doi.org/10.1016/j.jfoodeng.2016.05.001
[22] Onwude, D.I., Hashim, N., Janius, R.B., Nawi, N.M., Abdan, K. (2016). Modeling the thin-layer drying of fruits and vegetables: A review. Comprehensive Reviews in Food Science and Food Safety, 15(3): 599-618. https://doi.org/10.1111/1541-4337.12196
[23] Alara, O.R., Abdurahman, N.H., Olalere, O.A. (2019). Mathematical modelling and morphological properties of thin layer oven drying of Vernonia amygdalina leaves. Journal of the Saudi Society of Agricultural Sciences, 18(3): 309-315. https://doi.org/10.1016/j.jssas.2017.09.003
[24] Suherman, S., Susanto, E.E., Widuri, H., Patricia, S., Sutrisna, R.J. (2020). Energy analysis of a hybrid solar dryer for drying coffee beans. Int. J. Renew. Energy Dev., 9(1).
[25] Asioli, D., Rocha, C., Wongprawmas, R., Popa, M., Gogus, F., Almli, V.L. (2019). Microwave-dried or air-dried? Consumers' stated preferences and attitudes for organic dried strawberries. A multi-country investigation in Europe. Food Research International, 120: 763-775. https://doi.org/10.1016/j.foodres.2018.11.037
[26] Gulati, T., Datta, A.K. (2015). Mechanistic understanding of case-hardening and texture development during drying of food materials. Journal of Food Engineering, 166: 119-138. https://doi.org/10.1016/j.jfoodeng.2015.05.031
[27] Jiang, J., Dang, L., Yuensin, C., Tan, H., Pan, B., Wei, H. (2017). Simulation of microwave thin layer drying process by a new theoretical model. Chemical Engineering Science, 162: 69-76. https://doi.org/10.1016/j.ces.2016.12.040