Abdullah Eial Awwad | Mahmoud Al-Soud* | Alaa Al-Quteimat | Oleksandr Ushkarenko
© 2022 IIETA. This article is published by IIETA and is licensed under the CC BY 4.0 license (http://creativecommons.org/licenses/by/4.0/).
OPEN ACCESS
This paper is devoted to the development of a model of an autonomous electric power system to study random processes of voltage, current and power changes in emergency and dynamic operation modes. A diagram for calculating short-circuit currents has been presented, which was focused on a typical wide range of autonomous power plants with three diesel generator units. A model of an autonomous power plant has been developed, allowing to solve the assignments of determining short-circuit currents and starting currents of electric power machines. The equivalent network of the studied power system for transient calculations has been presented. Thus, the voltage waveforms have been obtained. A comparative assessment of theoretical calculation methods and simulation analysis demonstrated a high degree of accuracy of the simulation results. The use of approach suggested in the article and the developed model allows to increase the accuracy of conclusions when testing the abruptly variable processes and to make the most reasonable choice of measures to improve the quality of electricity and the reliability of electrical equipment. In particular, simulation analysis and obtaining transient curves for starting powerful consumers allow more accurately choose the type of circuit breakers used and the related configuration parameters.
fault currents, induction motors, power system simulation, power system transients, short‐circuit currents
The main electricity consumption in industrial enterprises is asynchronous electric motors. Since the starting current of an asynchronous motor (AM) is several times higher than its rated current [1-6], significant network voltage sags occur during start-up. Such voltage sags (VSs) affect electricity consumers connected to the network, which may have different levels of impedance to VSs and different qualities of electricity, and may also lead to an emergency situation and de-energizing of the system [7-14]. Exceeding the level of stability of the electric receiver against VSs generally leads to a violation of the conditions for its normal functioning or to failure.
In order to increase the reliability of the estimated values of the short-circuit currents and the starting currents under powerful loads, given that the manufacturer of electric distribution devices (EDDs) is responsible for the quality of the power plant operation, it is necessary to perform additional checks on the model of an autonomous electric power system (AEPS). The switchgear must also be checked against the overload current (current-time dependencies) and the value of the short-circuit (SC) current using special stations. This is primarily because electromagnetic contactors have a low response accuracy. Electronic contactors ensure high accuracy, but their cost is much higher. Authors [15] are devoted to the study of processes in industrial versions of asynchronous short-circuited electric motors. The analysis of processes in shipboard electric motor design was performed [16, 17]. These articles contain theoretical and experimental studies of both direct start-up using resistance moments on the motor shaft that are different in size and nature, and adjustable start-ups. However, these papers assumed that the power source, a 3-phase generator, had infinite power, which is, the impact of currents on the network during the direct start of the engine was not considered.
Since the starting current of an asynchronous short-circuited electric motor is inductive by its nature [18], it has such a demagnetizing effect on the synchronous generator that it sometimes cannot be compensated by the magnetizing force created by the excitation winding of the synchronous generator (the start of a powerful asynchronous short-circuited electric motor is meant). Because an AEPS has limited power, the direct start-up of the engine using a separate synchronous generator may cause unacceptable voltage and frequency sags within the network, the recovery time of which may be longer than is acceptable [19]. This further confirms the need to perform a simulation analysis of the AEPS at the design stage and during its operation in emergency and dynamic modes to assess the impact of these processes on the voltage value within various network nodes.
Switching loads within the AEPS network has the nature of a pulse and features a random distribution of values and durations. The values of switched loads may range from several kilowatts to several tens of kilowatts. When such load diagrams for all sections of the main distribution board (MDB) are randomly superimposed, the inter-switching intervals may range from several seconds to several minutes. The commutation frequency of the MDB loads is close to the time constants of diesel generator units. In the presence of the oscillatory properties of the generating units, the loads’ commutation contributes to the "loosening" of the latter and to fluctuations in voltage amplitudes and active power between generator units, which then lead to frequency fluctuations. Papers [20, 21] are devoted to the study of these processes from the point of view of the statistical processing of experimental data, but they do not consider the issue of AEPS simulation in dynamic and emergency operating modes.
A software package for calculating steady-state and transient electromagnetic and electromechanical processes in power supply systems should be used to create an AEPS model. The mathematical model of an AEPS should contain all power sources set by their own parameters, as well as power transmission lines, transformers, reactors, loads, and protective equipment in the form of circuit breakers with their own operation parameters. AEPS models may also be used to solve issues related to the optimization of the EDD location within control panels and to assess ways to reduce the value of short-circuit currents beyond pre-set limits.
The purpose of this article is to solve the actual research-and-technology issues of developing a model of an AEPS to study dynamic and emergency operation modes, of estimating the magnitude of voltage changes at various network points and of making the most reasonable choice of measures to optimize the quality of electricity, which may be used in the design of promising AEPSs equipped with protection against voltage sags.
The developed model for calculating emergency and dynamic modes of AEES allows to automate the processes of determining emergency parameters in AEPS with a wide range of powers and operating currents and a wide range of configurations. The created model of AEPS using Matlab Simulink allows not only to refine the results of calculations of emergency parameters, but also to configure the system in such a way as to achieve acceptable values of short-circuit currents that provide the minimum cost indicators of switching equipment. Thus, the developed model allows solving problems of determining short-circuit currents and inrush currents of powerful consumers. Comparative evaluation of model and exact calculation methods showed a high degree of accuracy. The maximum scatter of calculated values did not exceed 10%, which is quite acceptable for such problems. When calculating the peak values of the AM starting currents, the errors were also within 10% -15%. However, for the practice of calculating inrush currents, the current-time characteristics of the releases of circuit breakers are of great importance. In this regard, model tests and obtaining curves of transients for starting powerful consumers make it possible to more accurately select the type of release and its installation.
Voltage sag parameters and formulas for their determination are shown in Figure 1, where the duration of the voltage sag is attributed to the basic indicators of the quality of electricity, but the depth and frequency of the sag occurrence are supplementary [22-25].
The voltage sag is characterized by the following three parameters: depth δUS, duration ΔtS, and frequency FS. Other abbreviations shown in Figure 1 are: Ur, the nominal voltage value; Umin, the minimum voltage value at the start of the asynchronous motor; tst, the initial time of the load commutation; tfin the time in second after the voltage is restored to the nominal voltage; and M, the number of load commutations causing voltage sags. The solution of this scientific issue involves two interrelated tasks:
1. Obtaining probabilistic and statistical assessments of voltage sags (mainly, the voltage sags’ duration) that occur randomly in an AEPS, taken as initial data for the development of measures to reduce voltage sags in a promising AEPS; and
2. Designing the AEPS based on the development of methods and means to prevent the occurrence of voltage sags, ensuring an increase in the uninterrupted power supply to responsible electrical receivers, and considering technical proposals for the creation of an AEPS at the stage of justification.
Figure 1. Voltage sag parameters
According to the ISO 50001 "Energy Management Model," a voltage sag means a sudden decrease in voltage below 0.9 Ur at a point of the electrical network, followed by a restoration of the voltage up to the initial level or close to it after a duration from ten milliseconds to several tens of seconds" [22].
Irregular surges mean the voltage sags within the power network; this is best described on the basis of the random processes run theory. This is because the "sensitivity" of electronic equipment to external effects is manifested mainly when they exceed a given threshold of UT.
For the practical solution of the issue, the initial data are the mean frequency of runs of fAB per level of UT for a certain time interval, the mean number of runs of NAB during TB, the mean duration of runs of τAB, the probability of a random process exceeding the level of UT (R(uA > UT)), and the probability of a run within the interval of Δt.
However, the determination of the run parameters is possible only for processes where the related correlation functions are differentiable, for example, by a type function:
$R(\tau )=\sigma _{U}^{2}\exp (-{{\alpha }_{U}}\left| \tau \right|)(1+{{\alpha }_{U}}\left| \tau \right|)$ (1)
where, αU is the correlation factor. Thus, the desired parameters are those of the correlation function (1) that describe a random process, as well as the threshold value of UT. The mean runs frequency of a random process can be determined by [26]:
${{f}_{AB}}=\frac{{{\alpha }_{U}}}{\sqrt{2\pi }}\phi ({{U}_{T}})$ (2)
where,
$\phi ({{U}_{T}})=\exp (-\frac{U_{T}^{2}}{2})$ (3)
Thus, given the acceptable structural stability of an AEPS and given the experimentally obtained parameters of the correlation factor αU, we can determine the mean frequency of runs for a given threshold level of UT.
The mean duration of runs is related to the mean frequency of runs by the following ratio:
$\tau_A=\frac{P\left(u>U_T\right)}{f_{A B}}$ (4)
where, P is a probability function, and the expression P(u>UT) is the probability that the value of the random variable u will take on a value greater than UT. The probability of a random process exceeding the level of UT is determined by the known formula:
$P\left(u>U_T\right)=1-\int_{-\infty}^{U_T} p(u) d u=1-\Phi\left(U_T\right)$ (5)
where, p(u) means the probability density for voltage distribution in an AEPS.
The mean number of runs for the interval of TB is calculated by the following formula:
$N_B=\frac{T_B}{f_{A B}}$ (6)
Thus, the obtained results allow us to predict all the required parameters of interferences that may affect electronic equipment at the design stage of AEPS. They also justify the appropriateness of taking more stringent measures to increase the stability of the parameters of the autonomous network and contribute to solving the crucial optimization problems that affect the regulators of the equipment responsible for the quality of the supply network voltages.
A diagram for calculating short-circuit (SC) currents is shown in Figure 2. The diagram focuses on a wide, typical range of power plants with three diesel generator units, but the power range of the generating units is within the range of hundreds to several thousands of kW [27, 28]. Such autonomous power plants are widely used as backup power plants at enterprises that apply a continuous operation cycle, and are also applied in seafaring vessels. When calculating the system, it is necessary to determine the values of SC currents for the following elements: generator bars and the distribution or switching boards connected to the generator bars of the main distribution board that are powered by a transformer.
For the emergency operation modes of the power plant, the calculations of short-circuit currents for the system should cover the SC currents produced by all motors and generators connected to the system, including currents for the generator bars and the secondary switching and distribution boards.
All asynchronous motors that are connected to the network are replaced by one equivalent asynchronous motor, the power of which is determined by summing the powers of the individual running motors. Thus, the preservation of the equality of active and reactive powers consumed by all AMs when they are replaced by one equivalent one, and the value of the EMF is ensured. Also, when drawing up the equivalent circuit of the AEPS, it is also necessary to take into account the resistance of the power cables and busbars of the main switchboard. The resistance of a cable depends on its length, section and resistivity. Therefore, in Figure 2, for each cable that connects generators and consumers of electricity with the MSB buses, its length, number and cross section of individual cores are indicated. Then, after performing calculations and determining the resistance of all elements of the network, this circuit is converted into another equivalent circuit, an example of which is shown in Figure 6. After that, one of the well-known methods (for example, the method of loop currents or the method of nodal potentials) calculates the magnitude of the voltage dip at the occurrence of a short circuit at a given point of the AEPS.
Figure 2. A diagram for calculating short-circuit currents
Figure 2 contains the following designations: SBx, switchboard; Gx, generator; SCx, short circuit; MSB, main switchboard; M, motor; and EGS, emergency generator switchboard.
The minimum voltage value in relative units when operating a power plant in dynamic modes (e.g. starting a powerful asynchronous motor), is determined by [29]:
$\begin{align}& {{U}_{\min }}={{U}_{st}}+\left( {{U}_{st}}-{{U}_{est}} \right){{e}^{{-{{t}_{\min }}}/{{{{{\tau }'}}_{d}}}\;}} \\ & +{{k}_{2}}k\left[ {{t}_{\min }}-{{{{\tau }'}}_{d}}\left( 1-{{e}^{{-{{t}_{\min }}}/{{{{{\tau }'}}_{d}}}\;}} \right) \right] \\\end{align}$ (7)
where, Ust is the initial voltage at the moment of the motor start, Uest is the established voltage after the completion of the transient, k is the factor that is calculated coefficient which is calculated for the motor by analogy with k2 for the generator according to the formula (10), τ’d is the generator excitation system time constant, tmin is the time to reach the minimum voltage value for a self-excited generator:
${{t}_{\min }}={{{\tau }'}_{d}}\ln \left( \frac{{{U}_{st}}-{{U}_{est}}}{{{k}_{2}}k{{{{\tau }'}}_{d}}} \right)$ (8)
The factor k2 and the initial voltage in the expressions (7) and (8) can be determined by:
${{U}_{st}}={{{E}'}_{d}}\frac{{{x}_{d}}}{{{x}_{g}}+{{{{x}'}}_{d}}}$ (9)
${{k}_{2}}=\frac{{{x}_{g}}}{{{x}_{g}}+{{{{x}'}}_{d}}}$ (10)
where, xd, xg, and x’d are relative active and reactive resistances along the longitudinal and transverse axes, E’d is the electromotive force (EMF).
A steady-state voltage in (7) is determined by the following expression:
${{U}_{est}}={{E}_{d}}\frac{{{x}_{g}}}{{{x}_{g}}+{{x}_{d}}}$ (11)
The time constant of the excitation winding in (7) and (8) at the closed stator winding with a resistance of xg is calculated as
${{{\tau }'}_{d}}={{{\tau }'}_{d0}}\frac{{{x}_{g}}+{{{{x}'}}_{d}}}{{{x}_{g}}+{{x}_{d}}}$ (12)
The asynchronous motor reactance in formulae (9)–(12) is:
${{x}_{g}}=\frac{{{S}_{rG}}}{{{k}_{s}}{{S}_{rM}}}{{\left( \frac{{{U}_{rM}}}{{{U}_{rG}}} \right)}^{2}}$ (13)
where, SrG and UrG are the rated power and voltage of the generator, SrM and UrM are the rated power and voltage of the motor, and ks is the multiplicity factor of the asynchronous motor starting current in relation to the rated current.
Figure 3. A diagram of an autonomous electric power system
Figure 3 represents a model of an AEPS created using the MATLAB package and intended to simulate dynamic and emergency operation modes, that is, to assess the values of both AM and short-circuit currents.
The power plant contains three 3-phase AC voltage sources with an effective line voltage value of 400 V. The sources operate under an active-inductive 3-phase load. The A, B and C model ports are the terminals of the machine stator windings. The RMS and RMS1 units demonstrate the effective values of the phase currents. Vector signals consisting of 12 elements are generated on the m_SI output ports: the currents (isa, isb, isc), voltages (va, vb, vc) and EMF (ea, eb, ec) of the stator winding, the angular position (θm), rotor speed (vm), and the electromagnetic power (Pe). The SimPower Systems library provides the Machines Measurement Demux unit to extract the status variables for induction machines from the output vectors of the measured parameters. The signals corresponding to the mechanical power on the machine shaft are fed into the Pm input ports, and the E output ports receive the signals that set the effective values of the linear EMF of the stator windings.
The available calculation techniques are used for the 3-phase symmetric short circuit mode, that is, when 3-phase conductors are closed to each other, and for when a short circuit occurs in all three poles simultaneously. To determine short-circuit currents, the 3-Phase Fault units were used, in which an interphase short circuit occurs at a certain point in time. The 3-Phase Fault unit is controlled via the com port. When the control signal is fed in, a short circuit is generated within the circuit.
A short circuit can be simulated directly in the voltage source, on the voltage transmission line, and directly under load. The short-circuit location was selected using Manual Switches connected to the Subsystem unit (using signal 1 as the upper output and signal 0 as the lower output). The control signals were sent to a specific 3-Phase Fault unit using the Switches. By manipulating the Switches, a short circuit was set under the Load 3 load.
By the type of the current waveforms, it is possible to determine the type of interphase short circuit. With a 'metallic' short circuit, the current is the largest, and it is calculated during design. With an 'arc' short circuit, the current is less. But if the 'arc' short-circuit is unstable and constantly goes out, then lights up again, transient processes occur, leading to a short-term excess of the rated currents. With a 'glow' short-circuit, the current is much lower than the calculated one, which makes it impossible for the protective devices to react to its occurrence. A 'glowing' short circuit can suddenly turn into an arc or metal one, the protection will work, but when it is turned on again, the current will again be beyond the sensitivity threshold. Thus, the conclusion can be made that a 'metallic' short circuit occurred in the considered model.
The voltage and short-circuit current oscillograms were obtained from the AEPS operation simulation and are displayed in Figure 4a. For comparison, Figure 4b. represents the oscillograms of currents and voltages under the Load1 load, where there was no short circuit.
To design protection against voltage sags (VS) and prevent their consequences, it is necessary to forecast VS for a specific AEPS. Forecasts can be made from the available statistics obtained from long-term A* recorded observations or calculations for a specific network. To register the VS depth and duration, it is necessary to collect long-term measurements using special devices that provide reliable forecasts that depend on the extent of the network covered by the measurements.
To calculate the VS features, it is necessary to consider the actual structure and configuration of the AEPS and the operating modes of electrical equipment connected to the network. The model of the studied AEPS should describe it in such detail that the calculations performed make it possible to determine both the voltages in the nodes of interest and the deviations of these parameters from their normal steady-state values. The system operation mode was selected for each AEPS element, such that the element operated in the most difficult conditions when starting a powerful asynchronous motor. All generators capable of operating under the total load simultaneously (i.e., in parallel), electric machine converters, and all synchronous and asynchronous electric motors operating in the corresponding modes were included. The resistances of the elements in the design diagram can be expressed both in absolute (named) and relative units.
(a)
(b)
Figure 4. Simulation results: voltages and currents at (a) single-line to ground fault and (b) three-phase fault
The resistances of generators and motors (sometimes including other diagram elements) were set by the developers in relative units (r.u.) under the nominal conditions of this element. The values of these parameters in the named units can be obtained by the formula:
$A={{A}_{*}}{{Z}_{N}}$ (14)
where, A is a parameter in the named units; is the same parameter, but measured in r.u.; and ZN is the nominal resistance, in mΩ, determined by the formula:
${{Z}_{N}}=\frac{U_{N}^{2}}{{{S}_{N}}}=\frac{{{U}_{N}}}{\sqrt{3}{{I}_{N}}}$ (15)
where, UN is the rated voltage, V; SN is the total rated power in kVA; and IN is the rated current, A.
The transients were calculated in relative units. For this purpose, the parameters in the diagram resulted in uniform basic conditions. It is recommended to take the following as the basic values:
${{S}_{b}}={{S}_{G1}}+{{S}_{G2}}+...+{{S}_{Gn}}$ (16)
$\begin{align} & {{U}_{b}}={{U}_{N}} \\ & {{I}_{b}}=\frac{{{S}_{b}}}{\sqrt{3}{{U}_{b}}} \\ & {{Z}_{b}}=\frac{U_{b}^{2}}{{{S}_{b}}}=\frac{{{U}_{b}}}{\sqrt{3}{{I}_{b}}} \\\end{align}$ (17)
The selected basic units were used to align all physical quantities, both complete and component (active, reactive, etc.) in the r.u. Under the selected basic conditions, the relative EMF, voltage, current, power, and resistance were determined as follows:
$\begin{align} & {{E}_{*b}}=\frac{E}{{{U}_{b}}},{{U}_{*b}}=\frac{U}{{{U}_{b}}},{{I}_{*b}}=\frac{I}{{{I}_{b}}} \\ & {{P}_{*b}}=\frac{P}{{{S}_{b}}},{{Z}_{*b}}=\frac{Z}{{{Z}_{b}}} \\ & {{r}_{*b}}=\frac{r}{{{r}_{b}}},{{x}_{*b}}=\frac{x}{{{x}_{b}}},{{S}_{*b}}=\frac{S}{{{S}_{b}}} \\\end{align}$ (18)
where, the “*” asterisk indicates that the corresponding value is expressed in r.u., and the “b” index means that it results in a basic condition in the same named units as the corresponding basic values: E, U, I, S, P, Z, r, and x, respectively: EMF, voltage, current, active power, full power, complete resistance, active resistance, and inductive resistance. The values were converted from relative units to the named units using the formulae:
$\begin{align} & U={{U}_{*b}}{{U}_{b}},E={{E}_{*b}}{{U}_{b}} \\ & S={{S}_{*b}}{{S}_{b}},P={{P}_{*b}}{{S}_{b}} \\ & Z={{Z}_{*b}}{{Z}_{b}} \\ & r={{r}_{*b}}{{r}_{b}},x={{x}_{*b}}{{x}_{b}} \\\end{align}$ (19)
The single-line calculation diagram was drawn up for the selected calculation mode based on the AEPS block diagram. The calculation diagram included:
The power (PEM) and rated current (INEM) of the motors were determined by the load table as the sum of the rated capacities and rated currents of the inductive motors operating in the mode under study. The equivalent motor was connected directly to the main distribution board bars.
The equivalent network was drawn up based on the calculation diagram. To do this, active and inductive resistances were substituted for the diagram elements (generators, transformers, motors, reactors, the cable route, and the extended bars sections). Equivalent electrically connected circuits substituted for the magnetically connected sections of the system. Synchronous generators, synchronous and asynchronous motors in the equivalent network were considered by the EMF and active and inductive resistances. Unless the diagram is completely symmetrical (i.e. identical sources and resistances, etc.), it can be folded along the axis of symmetry, that is, connect the points of equal potential. In this case, the power of sources or motors is equal to the sum of the capacities, but the resistances are summed in parallel.
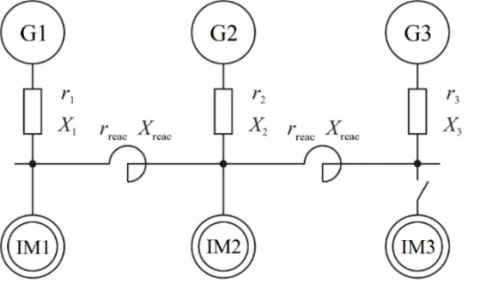
Figure 5. A diagram of an electric power system
Figure 6. A network equivalent to the electric power system
The equivalent circuit is based on the design scheme and is performed in a single-line image. In the equivalent circuit, the elements of the design circuit (in the general case, generators, cables, buses, devices, their contacts, transformers, reactors, and motors) are replaced by EMF sources, active and inductive resistances per phase. The studied power plant contains three synchronous generators with a capacity of 250 kW each (Figure 5). These generators form an important part of the AEPS equivalent circuit and when calculating short circuit currents, their parameters, such as EMF, active ri and reactive Xi resistance (shown in Figure 6), must be taken into account when calculating short circuit currents. If at the time of the occurrence of an event that leads to the appearance of a voltage dip, i.e. short circuit or start-up of a powerful asynchronous motor, one or two generators will be working, then only they should be taken into account when drawing up the equivalent circuit of the AEPS. In the case under consideration, all three generators are working, and all of them are connected to the MSB buses.
Figure 6 represents the equivalent network of the studied electric power system. The equivalent network can be converted in both named and relative (basic) units. In cases where the estimated values of the starting currents are expected to be within acceptable limits, it is acceptable to discard the relatively small resistances of circuit breakers, generator cables up to 10 to 15 meters long, transient resistances of contacts, etc.
To determine the number of voltage spikes and sags that may occur for various reasons, a statistical data collection method based on processing the observations of events leading to voltage sags was used. The data obtained in this way are necessary to determine the empirical (statistical) distribution of a random variable (spikes and sags). Based on the individual load schedules, a daily load schedule of the MDB section was plotted (Figure 7). The approximate load commutation time was determined based on the operating modes determined by the operating procedures.
To calculate the numerical parameters for random procedures, the following formulae were used:
${{M}_{X}}=\frac{1}{{{N}_{S}}}\underset{k=1}{\overset{{{N}_{B}}}{\mathop{\Sigma }}}\,{{x}_{k}}$ (20)
and
$\sigma _{X}^{2}=\frac{1}{{{N}_{S}}}\underset{k=1}{\overset{{{N}_{S}}}{\mathop{\Sigma }}}\,x_{k}^{2}-M_{X}^{2}$ (21)
where, Mx is the mathematical expectation, $\sigma_X^2$ is the variance, and NS is the number of samples of xk.
Figure 7. The daily load schedule of the MDB section
The voltage sag mean value was 13.8 V, the minimum value was 7 V, and the maximum was 27 V. The voltage sag mean duration was 0.42 s. The voltage spike mean value was 12.9 V, the minimum spike value was 5 V, and the maximum was 25 V. The voltage sag mean duration was 0.4 s. The frequency of occurrence of voltage spikes and sags was approximately equal at 50%. The generators yielded the following parameter values: S = 250 kVA, U = 400 V, x'd = 0.20; xd = 1.1, k = 20, and t1 = 0.05 s. These values held for the GMS-13-31-12 generator.
The studied consumers were characterized by individual operation modes and the commutation procedure was random. For the single event of switching on the consumer, the voltage losses transmitted from the MDB to the final consumer were determined. Figure 8 presents the transient simulation voltage obtained when starting the asynchronous motor whose power was 185 kW.
Figure 8. Transient voltage when starting the asynchronous motor
The voltage recovery time was determined by the following formula [20]:
$t_{\text {est }} \leq$$1.5 \frac{\left[\left(r_a+0.4\right)^2+\left(x_d+0.92\right)\left(x_q+0.92\right)\left(r_a^2+x_d^{\prime} x_q\right)\right]}{\left[\left(r_a+0.4\right)^2+\left(x_d^{\prime}+0.92\right)\left(x_a+0.92\right)\left(r_a^2+x_d^x q\right)\right]} .$ (22)
where, ra, xd, xq are the relative active and reactive resistances along the longitudinal and transverse axes; 0.4 and 0.92 are the relative values of the active and inductive resistances of the load in the mode at cosj= 0.4. The maximum voltage sag is (as a percentage):
$U_{\max }=\left(1-U_{\min }\right) \cdot 100 \%$ (23)
Since the commutation procedures of connecting and disconnecting loads are random and lead to random fluctuations in the voltage amplitudes and frequency deviations of the network, the latter can be, to a certain extent, an assessment of the load commutation procedures within an autonomous network.
Experimental study of the AEPS operation dynamic modes was carried out in a specialized research laboratory of the Admiral Makarov National University of Shipbuilding. The created physical model of the AEPS contains three generator units that generate power up to 2-5 kW each and have microprocessor excitation systems that ensure the stability of the output voltage. The generators are driven by induction motors controlled by Altivar frequency converters (2.2 kW), as well as a diesel engine with microprocessor control. All automation means are integrated into a microprocessor network, which allows to development of hardware and software for the real-time control systems and researches the processes in the AEPS.
Control and monitoring of the AEPS parameters were performed from the control panel, which consists of three sections:
The control panel includes touch screens and touch panels to control the AEPS operation modes.
The AEPS voltage parameters monitoring system is presented in the form of a software complex, executing the task of collecting and processing data and organizing databases. During the development of the monitoring system and its graphical interface, the methods of conceptual modeling of information processes and intelligent systems were used [30, 31].
Conceptual modeling of the software development process is a model of process activity necessary to provide knowledge about the structure of the research area. This model takes into account the processes of the subject area, input and output information objects, and a set of controls. Such organization of information links facilitated a more visible transition from informal knowledge of the subject area to their formal presentation.
The conceptual model of the software graphic interface can be called the following set of processes and objects:
${{S}_{}}=\left\langle \begin{align} & P,D,G,{{H}_{p}},{{H}_{d}},{{H}_{g}},{{S}_{p}},{{S}_{d}}, \\ & {{S}_{g}},InD,InG,OutD,OutG \\\end{align} \right\rangle $ (24)
where, P={pi}–a set of the imaging and information processing procedures; D={di}–a set of information objects; G={gi}–a set of graphical objects; $H_p, H_d, H_g$ – establish a correspondence between individual objects of the model and a set of subordinate subobjects; $S_p, S_d, S_g$ – progressing of the processes that specify a partial order of execution; InD–input process information objects; InG–input process graphical objects; OutD–output process information objects; OutG– output process graphical objects.
The set of processes for constructing and processing information includes high-level functions that form an image (raster representations of objects, visible contours of objects, etc.), approximate to piecewise linear functions (graphical representations of objects, indicators, etc.), functions for processing input data, functions of forming control packets and others. The set of information objects D={di} includes incoming data packets, variables and their structures associated with controls, intermediate data stacks, generated data transfer reports, and others. A collection of graphical objects G={gi} are presented in the form of a set of indicators (graphical, arrow, scale, numeric, etc.) and control objects (I/O elements, status indication, display of line variables, etc.).
One of the main components of a graphical model is the concept of graphical attributes. Attribute sets describe the basic properties of graphic objects, such as line style, line color, outline dimensions, and background color. The graphic attribute model can be described as follows:
${{A}_{g}}=\left\langle C,{{F}_{c}},{{N}_{c}},{{T}_{c}},{{n}_{c}},{{t}_{c}},InC,OutC \right\rangle $ (25)
where, C={ci}– a set of graphic attributes; Fc–graphic image; Nc, nc–a set of graphic attribute names; Tc, tc– a set of graphic attribute type names; InC–a process that requests the attribute value; OutC–a process of the graphic object requested attributes set initializing. The model of graphic resources is made in a similar way:
${{A}_{r}}=\left\langle \begin{align} & R,{{F}_{r}},{{N}_{r}},{{T}_{r}},{{n}_{r}},{{t}_{r}}, \\ & InR,OutR,DelR \\\end{align} \right\rangle $ (26)
where, R={ri}–a set of graphical resources; DelR–a procedure of graphic resource visualization.
During the design of the conceptual model of an operator’s automated workstation (AWS) of the AEPS parameters monitoring system, shown in Figure 9, certain types of objects were used, which include graphic primitives, resources and attributes. To simplify the analysis of this model, domain templates were used. They are represented by separate fragments of the model and built-in relation to the selected processes, taking into account the interaction with others.
Figure 9. The conceptual model of the AEPS parameters monitoring system
Analyzing the structure of images for each individual process, the following dependencies of the output graphic objects can be formulated:
Based on the above dependencies, the conceptual model of the operator's AWS of the AEPS parameters monitoring system is regular. The passage in a regular conceptual model is associated with the redundancy of the model, introduces the simultaneous use of relations of the passage of processes Sp and images Sg. The visualization of images depends on the passes priority because they indirectly determine the process's execution order.
(a)
(b)
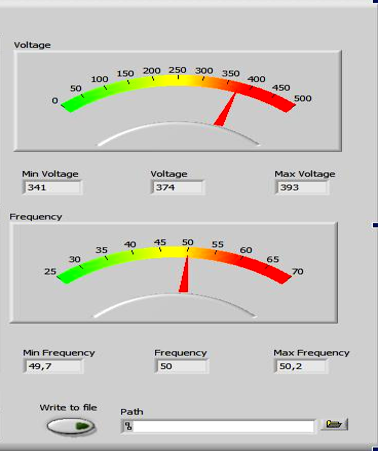
Figure 10. The user interface of the software for (a) the dynamic measured waveforms of voltage and frequency and (b) measured amplitude of voltage and frequency in AEPS
To obtain and process the results of the experiment, and taking into account the considered conceptual model, the software was developed to determine voltage spikes and sags when powerful power consumers are turning on and off (see Figure 10). The developed software allows determining the following characteristics of power quality: voltage deviation, frequency deviation, duration of voltage failure, duration of frequency failure, voltage sag, and voltage fluctuation range.
After the start of the generators and reaching the voltage and the frequency rated values (400V and 50Hz), the electric power parameters were measured. Next, the value of the expected voltage sag when starting the induction motor was obtained whiting modelling, after which the motor was connected to the main switchboard bus.
To develop the means of protection against voltage sags and to prevent their consequences, it is necessary to forecast VS for a specific AEPS. Forecasts can be made based on available statistics or calculations for a specific network. It is impossible to completely prevent voltage sags within external power supply systems. In particular, papers [32-35] also contain simulation studies of frequency control systems for asynchronous motors, and an analytical method for analyzing the control procedures of motors and generators as part of an AEPS. These papers also investigated a formal method for solving the problem of the structural optimization of the AM control system model that could be applied to the AEPS model in this paper.
A model of an autonomous electric power system consisting of three synchronous generators and an active-inductive load was developed from the performed analysis. The developed model of the AEPS solved the issues of determining short-circuit and starting currents of significant electric power consumers, for example, asynchronous motors. The simulation of the short-circuit mode within the network and the direct starting procedure of a powerful asynchronous motor were performed. The impact of these procedures on the voltage within the AEPS network was analyzed.
A comparative assessment of theoretical calculation methods and a simulation analysis demonstrated the high accuracy of the simulation results. The maximum spread of the estimated values did not exceed 10%, which is quite sufficient to solve such issues. For the calculated peak values of the starting currents, the errors were also in the range of 10 to 15%.
However, the current-time features of circuit breakers are important in calculating the starting currents of an AM. In this regard, the simulation analysis and the obtained transient curves for starting powerful consumers enabled a more accurate choice of the type of circuit breakers and their related settings. The damage from voltage sags can be reduced by using the set of measures here, by using special high-speed protection and automation systems, and by introducing efficient structures and methods of starting the relevant electric motors. The most effective way to solve the issues of voltage sags is feed-forward control.
[1] Hota, A., Agarwal, V. (2022). Novel three-phase H10 inverter topology with zero common mode voltage for three-phase induction motor drive applications. IEEE Trans. Ind. Electron., 69(7): 7522-7525. http://doi.org/10.1109/TIE.2021.3097656
[2] Nannen, H., Zatocil, H., Griepentrog, G. (2022). Predictive firing algorithm for soft starter driven induction motors. IEEE Trans. Ind. Electron., 69(12): 12152-12161. http:// doi.org/10.1109/TIE.2021.3135606
[3] Muyeen, S., Takahashi, R., Murata, T., Tamura, J. (2010) A variable speed wind turbine control strategy to meet wind farm grid code requirements. IEEE Trans. Power Syst., 25(1): 331-340. http://dx.doi.org/10.1109/TPWRS.2009.2030421
[4] Bakkar, M., Bogarra, S., Rolán, A., Córcoles, F., Saura, J. (2020). Voltage sag influence on controlled three-phase grid-connected inverters according to the Spanish grid code. IET Gener. Transm. Distrib, 14(10): 1882-1892. http://dx.doi.org/10.1049/iet-gtd.2019.1496
[5] Bae, Y., Vu, T., Kim, R. (2013). Implemental control strategy for grid stabilization of grid-connected PV system based on German grid code in symmetrical low-to-medium voltage network. IEEE Trans. Energy Convers, 28(3): 619-631. http://dx.doi.org/10.1109/TEC.2013.2263885
[6] Camacho, A., Gastilla, M., Miret, J., Borrell, A., de Vicuña, L. (2015). Active and reactive power strategies with peak current limitation for distributed generation inverters during unbalanced grid faults. IEEE Trans. Ind. Electron, 62(3): 1515-1525. http://dx.doi.org/10.1109/TIE.2014.2347266
[7] Wang, L., Lou, Y., Zhou, J., He, H. (2021). Research on voltage sag properties of medium-low voltage DC distribution system. 6th International Conference on Power and Renewable Energy (ICPRE), Shanghai, China, 68(12): 564-568. http://dx.doi.org/10.1109/ICPRE52634.2021.9635224
[8] Rolan, A., Bogarra, S., Bakkar, M. (2022). Integration of distributed energy resources to unbalanced grids under voltage sags with grid code compliance. IEEE Trans. Smart Grid, 13(1): 355-366. http://dx.doi.org/10.1109/TSG.2021.3107984
[9] Li, Z., Liu, J., Li, X., He, H. (2021). Study on a method to depict the multi-dimension characterization of DC voltage sag. 6th International Conference on Power and Renewable Energy (ICPRE), Shanghai, China, pp. 128-132. http://dx.doi.org/10.1109/ICPRE52634.2021. 9635220.
[10] Ryu, M., Kim, H., Baek, J., Kim, H., Jung, J. (2015). Effective test bed of 380-V DC distribution system using isolated power converters. IEEE Trans. Ind. Electron., 62(7): 4525-4536. http://dx.doi.org/10.1109/TIE.2015.2399273
[11] Awwad, A.E., Dieckerhoff, S. (2017). Operation of planar and trench SiC MOSFETs in a 10kW DC/DC-converter analyzing the impact of the body diode. In 2017 IEEE Energy Conversion Congress and Exposition (ECCE), pp. 917-924. http://dx.doi.org/10.1109/ECCE.2017.8095883
[12] Awwad, A.E., Badawi, N., Dieckerhoff, S. (2016). Efficiency analysis of a high frequency PS-ZVS isolated unidirectional full-bridge DC-DC converter based on SiC MOSFETs. In 2016 18th European Conference on Power Electronics and Applications (EPE'16 ECCE Europe), pp. 1-10. http://dx.doi.org/10.1109/EPE.2016.7695601
[13] Eial Awwad, A. (2020). On the perspectives of SiC MOSFETs in high-frequency and high-power isolated DC/DC converters, 8. Universitätsverlag der TU Berlin.
[14] Liao, J., Zhou, N., Huang, Y., Wang, Q. (2019). Unbalanced voltage suppression in a bipolar DC distribution network based on DC electric springs. IEEE Transactions on Smart Grid, 11(2): 1667-1678. http://dx.doi.org/10.1109/TSG.2019. 2941874
[15] Hernández-Guzmán, V.M., Silva-Ortigoza, R., Orrante-Sakanassi, J. (2021). Energy-based control of electromechanical systems. Springer. http://dx.doi.org/10.1007/978-3-030-58786-4
[16] Kim, Y.R., Kim, J.M., Jung, J.J., Kim, S.Y., Choi, J.H., Lee, H.G. (2021). Comprehensive design of DC shipboard power systems for pure electric propulsion ship based on battery energy storage system. Energies, 14(17): 5264. 10.3390/en14175264
[17] Palka, R., Woronowicz, K. (2021). Linear induction motors in transportation systems. Energies, 14(9): 2549. https://doi.org/10.3390/en14092549
[18] Son, S.G. (2017). Induction motor starting characterization with power factor correction capacitors. The Journal of Korea Institute of Information, Electronics, and Communication Technology, 10(3): 206-212. https://doi.org/10.17661/jkiiect.2017.10.3.206
[19] Liang, X., Ilochonwu, O. (2010). Induction motor starting in practical industrial applications. IEEE Transactions on Industry Applications, 47(1): 271-280. http://dx.doi.org/10.1109/TIA.2010.2090848
[20] Ushkarenko, A.O., Dorogan, O.I. (2017). Software development for calculation of ship diesel-generators' power based on the statistical processing of information. Проблеми інформаційних технологій, 21(1): 35-41.
[21] Ryabenkiy, V.M., Ushkarenko, A.O. (2012). Techniques of statistic research of power surges in marine power plants. Zeszyty Naukowe/Akademia Morska w Szczecinie, 30(102): 121-125.
[22] ISO 50001. (2018). Energy Management Systems – Requirements with Guidance for Use. https://www.iso.org/iso-50001-energy-management.html.
[23] Camarillo-Peñaranda, J.R., Ramos, G. (2018). Characterization of voltage sags due to faults in radial systems using three-phase voltage ellipse parameters. IEEE Transactions on Industry Applications, 54(3): 2032-2040. http://dx.doi.org/10.1109/TIA.2018.2793245
[24] Sha, H., Mei, F., Zhang, C., Pan, Y., Zheng, J. (2019). Identification method for voltage sags based on k-means-singular value decomposition and least squares support vector machine. Energies, 12(6): 1137. http://dx.doi.org/10.3390/en12061137
[25] Council of European Energy Regulators. (2012). Guidelines of Good Practice on the Guidelines of Good Practice on the Implementation and Use of Voltage Quality Monitoring Systems for Regulatory. https://www.ceer.eu/documents/104400/-/-/bdd2c6cb-5ccf-b342-2728-3e6c38536daf.
[26] Brémaud, P. (2020). Probability Theory and Stochastic Processes. Berlin/Heidelberg, Germany: Springer.
[27] Zabihian, F. (2021). Power Plant Engineering. 1st ed. Boca Raton: CRC Press. ISBN-9781498707121. https://doi.org/10.1201/9780429069451
[28] Korobko, G., Shilov, M. (2018). Application in Autonomous power plants of a diesel generator set with a variable frequency of rotation. Vestnik of Astrakhan State Technical University, pp. 42-48.
https://doi.org/10.24143/2073-1574-2018-4-42-48
[29] Gomez, J.C., Reineri, C., Campetelli, G., Morcos, M.M. (2004). A study of voltage sags generated by induction motor starting. Electric Power Components and Systems, 32(6): 645-653. http://dx.doi.org/10.1080/15325000490228423
[30] Ahmed, F., Robinson, S., Tako, A. (2014). Conceptual modelling: lessons from computer science. In 7th Simulation Workshop Conference (SW14), pp. 154-166.
[31] Zhou, M., Zhang, Q., Chen, Z. (2006). What can be done to automate conceptual simulation modeling? In Proceedings of the 2006 Winter Simulation Conference, 809-814. http://dx.doi.org/10.1109/WSC.2006.323162
[32] Yao, K., Xiao, H. (2020). Analysis of frequency control system in single-phase asynchronous motor. In 2020 IEEE 1st China International Youth Conference on Electrical Engineering (CIYCEE), 1-7. http://dx.doi.org/10.1109/CIYCEE49808.2020.9332777
[33] Awwad, A.E., Al-Quteimat, A., Al-Suod, M., Ushkarenko, O.O., AlHawamleh, A. (2021). Improving the accuracy of the active power load sharing in paralleled generators in the presence of drive motors shaft speed instability. International Journal of Electronics and Telecommunications, 67(3): 371-377. http://dx.doi.org/10.24425/ijet.2021.137822
[34] Said, A.E., Awwad, A.M.E. (2021). A comparative study of performance of AC and DC electric drive control systems with variable moment of inertia. Bulletin of Electrical Engineering and Informatics, 10(2): 588-597. http://dx.doi.org/10.11591/eei.v10i2.2768
[35] Klug, R.D., Griggs, M. (2004). Reliability and availability of megawatt drive concepts. In 2004 International Conference on Power System Technology, 2004. PowerCon 2004. 1: 665-671. http://dx.doi.org/10.1109/ICPST.2004.1460077