Devianti* | Dewi Sri Jayanti | Novia Amrida | Agustami Sitorus | Dewi Sartika Thamren
© 2021 IIETA. This article is published by IIETA and is licensed under the CC BY 4.0 license (http://creativecommons.org/licenses/by/4.0/).
OPEN ACCESS
The fulfilment of electricity needs in Aceh Province has not been evenly distributed so that the potential of available natural resources continues to be explored and destroyed to be utilized. One of the high available natural potentials in Aceh province is watershed and subwatershed. This study aims to study the potential use of Lawe-simpali subwatershed as a hydroelectric power plant to meet the electrical energy needs of remote communities around the Lawe-simpali Subwatershed, Aceh Province, Indonesia. The method used in this research is a literature study and field survey. Four types of methods for estimating rainfall frequency distribution were tested on climatological data obtained from around the Lawe-simpali subwatershed area. A Der Weduwen method is used to determine water discharge with a return period of up to 100 years. The results show that the Log Pearson Type III rainfall estimation method is more suitable for use in the Subwatershed Lawe-simpali area with a coefficient of inclination of 0.9. The estimated water discharge that can be generated from this Subwatershed for a biennial return period is 1571.85 m3/s. The discharge has the potential to be able to generate electricity by 26.2 kW for planning of 2 m head and 131.1 kW for planning head of 10 m. This shows that the Lawe-simpali subwatershed in Aceh Province has great potential to become micro and mini hydroelectric power so that it can meet the electrical energy needs of remote communities around it.
appropriate technology, electricity, energy, natural resources, rural communities, water
Electrical energy is a basic need for people in the modern era today , especially in Indonesia. Abundant electrical energy can meet household consumption needs and can be used as business activities and other industries. On the other side, the rapid growth of society makes the demand for electricity needs continue to increase. However, according to the results of Gultom and Togar , the electricity generated by the Indonesia State Electricity Corporation is not enough to meet the increasing needs of the community.
The level of electricity consumption in Aceh Province is still of low category. This is caused by many things, including the distance of a village from the primary source of electricity and the availability of electricity generation, which is still very limited. Remote villages that have not been electrified in Aceh province tend to be in hilly or mountainous topography which is very difficult to access . The natural condition is a challenge to be able to channel electrical energy from existing assembling sources in Aceh Province. However, these natural conditions leave a massive potential in the form of the creation of watershed and subwatershed from mountains and hills in Aceh Province. That can be an opportunity to be able to use watershed as a hydroelectric power plant.
Hydroelectric power plants that utilize watershed and subwatershed as generators can generate electricity in the range of 500 W to 1 MW. This natural potential according to some research results depends on the intensity of rain, frequency of rainfall, distribution of rainfall, water discharge in river flow and environmental topography as the head source of a hydroelectric power plant in the watershed and subwatershed area. Therefore, these natural potential factors are important to be reviewed and adjusted to watershed and subwatershed areas in the Aceh province to use them as hydroelectric power plants.
In general, watershed and subwatershed have anatomy in the form of upstream, middle, and downstream parts with different biophysical characteristics. Based on a different watershed, biophysical conditions will produce different discharges. The maintained state of the biophysical watershed will result in an undisturbed upstream of the watershed. The change of forest land to agricultural land significantly affects the watershed discharge. Hence, it is vital to keep the forest area around the watershed and subwatershed so that the discharge generated from the watershed remains stable . Therefore, to be able to plan the discharge following the Hydroelectric power plant, the study to be able to utilize the watershed and subwatershed is essential to do first. This study will focus on the use of the Lawe-simpali subwatershed area, South Aceh District, Aceh Province, Indonesia.
Previous studies on the use of watershed and subwatershed for hydroelectric power plants have been carried out. Research Hatamkhani et al. conducted a study through a simulation approach to be able to optimize the hydroelectric power plant system that utilizes the watershed Karkhe river. The results of this study report that optimization of electric power generated from the watershed with economic analysis can be modelled. However, this research has not been able to model the relationship between the electric power generated so that the operation of the hydroelectric power plant can work more minimally. Rospriandana and Fujii conducted an assessment of Ciwidey Subwatershed to be used as small hydropower. A combination of Geographic Information System (GIS) methods with the Soil and Water Assessment Tool (SWAT) hydrological model is used in this study. The results of the assessment state that Ciwidey subwatershed has the potential to produce a maximum of 1.72 MW of electric power. However, this study also reports that because it only relies on data from hydrological data, e.g., gauged discharge stations and daily precipitation makes one of the obstacles in making the assessment more accurate.
Opportunities and potential for utilization based on several research results states that subwatershed can be utilized as a hydroelectric power plant. However, in the paper, the results of these studies are not yet available in-depth studies of planning efforts to use the Lawe-simpali subwatershed as a hydroelectric power plant. Therefore, this study aims to conduct a study of the potential use of the Lawe-simpali subwatershed as a hydroelectric power plant to be able to meet the electricity needs of the remote area around the Lawe-simpali subwatershed, Aceh Province, Indonesia. It is expected that the hydroelectric power plant can be a solution to meet the needs of electrical energy for residents who live in remote areas around the Subwatershed Lawe-simpali. The results of this study are also expected to be a reference in the design of hydroelectric power plant designs that can improve the utilization of Subwatershed Lawe-simpali.
2.1 Site description
The research was carried out in the Lawe-simpali subwatershed, South Aceh District, Aceh Province, Indonesia (Figure ). Subwatershed Lawe-simpali is at 03°34'12"-03°14'24" LU and 97°21'36"-97°36'36" East which has a catchment area of 57,742.17 Ha, with a slope of 0.19%, and length watershed which is 63.8 km.
Figure 1. Geographic location of the study region sites
2.2 Data description
Rainfall data from the last ten years from the Lawe-simpali watershed area is analyzed. The data was obtained from the Meteorology, Climatology and Geophysics Agency (BMKG), Indonesia. South Aceh administration map, Krueng Kluet watershed map, Lawe-simpali subwatershed map, Lawe-simpali subwatershed land use map, and Mapali Simpali subwatershed soil type map was also obtained from the Banda Aceh Regional Development Planning Agency.
Rainfall data for each rain event is measured using a Hellman type rain gauge. This instrument can automatically record the volume of each rain event, and the operator will read the recorded results the next day. The instrument was placed in an open area and protected from trees or tall buildings. The daily rainfall data will be archived and can be further analyzed for specific purposes. In this case, the maximum rainfall data in a year will be further analyzed for this study.
2.3 Rainfall prediction
Data on rainfall prediction frequency is analyzed using several models that have been developed and used by several researchers . This is conducted to get the frequency and magnitude of rainfall that is most close to the actual conditions. The magnitude of the rainfall prediction model for the normal t-year replication method can be predicted using Eq. (1). The predicted rainfall magnitude model for the normal log method t-year replication can be predicted using Eq. (2). The predicted rainfall magnitude model for the Gumbel method t-year replication can be predicted using Eq. (3). The predicted rainfall magnitude model for the Pearson log method t-year test Type III can be predicted using Eq. (4).
$R_{N}=R_{a}+\left(C_{G} \times S\right)$ (1)
$\log \left(R_{L N}\right)=\log \left(R_{a}\right)+\left(C_{G} \times S_{\log (R)}\right)$ (2)
$R_{G M}=R_{a}+\left(C_{G M} \times S\right)$ (3)
$R_{L P 3}=\log \left(R_{a}\right)+\left(C_{L P 3} \times S_{\log (R)}\right)$ (4)
Frequency analysis is used to determine the appropriate distribution of rainfall amount based on the value of the skewness coefficient (Cs), kurtosis coefficient (Ck), and coefficient of variation (Cv) . Estimation of rainfall magnitude model will be analyzed the level of slope through the skewness coefficient approach through Eq. (5). Furthermore, the degree of peakedness from the rainfall distribution is compared with the coefficient of kurtosis (Eq. 6). The coefficient of variation from the rainfall data is also analyzed using Eq. (7). Skewness coefficient (Cs) will represent the symmetry in data distribution from rainfall. In addition, kurtosis coefficient (Ck) will represent how heavily the tails of a data of rainfall distribution differ from the tails of a normal distribution. Lastly, coefficient of variation (Cv) will represent the ratio of the standard deviation to the mean data rainfall. From these results, we will select the most likely value by looking at the criteria of the magnitude of statistical parameters using the standard in Table .
$C_{S}=\frac{n \cdot \sum_{i=1}^{n}\left[\log \left(R_{i}\right)-\log \left(R_{a}\right)\right]^{3}}{(n-1)(n-2)\left(S_{\log (R)}\right)^{3}}$ (5)
$C_{k}=\frac{n^{2} \cdot \sum_{i=1}^{n}\left[R_{i}-R_{a}\right]^{4}}{(n-1)(n-2)(S)^{3}}$ (6)
$C_{V}=\frac{S}{R_{a}}$ (7)
Table 1. Standard from the method of determining rainfall prediction
|
Type of rainfall frequency distribution method |
Requirements |
|
Normal method |
Cs = 0.0 |
|
Log Normal method |
Cs = 3Cv + Cv2 and Cs = 0.88325 |
|
Log Pearson Type III method |
Cs » 0.0 and 0.0 £ Cs £0.9 |
|
Gumbel method |
Cs = 1.1396 and Ck = 5.4002 |
2.4 Prediction of discharge using Der Weduwen method
Calculation of predictive discharge becomes very important in a river building plan that can be used as a hydroelectric power plant in a remote area. Predictive discharge volume can be a reference to choose the right type of building for the utilization of the river flow. The Der Weduwen method is one of the empirical equations that can be used to calculate plan water discharge . The prediction of the Der Weduwen method can be calculated using Eq. (8). To determine the coefficient of determination in predicting rainfall and discharge can be calculated using Eq. (13).
$Q_{D W}=\alpha \times \beta \times Q_{N} \times A_{W}$ (8)
$\alpha=1-\frac{4.1}{\left(\beta \times Q_{N}\right)+7}$ (9)
$\beta=\frac{\left[120+\frac{A_{W} \times(t+1)}{(t+9)}\right]}{120+A_{W}}$ (10)
$Q_{N}=\frac{R_{T}}{240} \times \frac{67.65}{(t+1.45)}$ (11)
$t=0.25 \times L \times Q^{-0.125} \times I^{-0.25}$ (12)
$R^{2}=1-\frac{\sum\left(y_{i}-\hat{y}_{i}\right)^{2}}{\sum\left(y_{i}-\bar{y}_{i}\right)^{2}}$ (13)
2.5 Determination of the type of hydroelectric power plant
The power generated from a hydroelectric power plant can be determined using Equation 14. The power generated can be classified according to Table . The head of the hydroelectric power plant can also be classified as the low head (<50 m), medium head (50 <h <250) and high head (> 250 m) .
$P=h \times Q \times g \times \eta$ (14)
Table 2. Hydroelectric power plant classification types based on the power generated
|
Tipe |
Capacity |
|
Mini-hydro |
100 kW - 1 MW |
|
Micro-hydro |
5 kW - 100 kW |
|
Pico-hydro |
500 W - 5 kW |
3.1 Rainfall frequency distribution
Rainfall frequency distribution analysis is a calculation of the repetition of rainfall events both the number of time and their return times. Determination of the rainfall distribution prediction is influenced by factors determining the pattern of rainfall distribution which is conducted by analyzing the maximum rainfall data in an area. The results of the calculation of rainfall data around the Subwatershed Lawe-simpali area are presented in Table . The standard deviation of the ten years of rainfall data is 60.83. The results of the analysis of the skewness coefficient (Cs), coefficient of kurtosis (Ck) and coefficient of variation (Cv) are respectively 0.8952, 4.361, 0.2700. These three parameters (skewness coefficient, kurtosis coefficient, variation coefficient) are still within normal limits according to the results of the study .
Table 3. Rainfall statistical parameters distribution in the subwatershed of Lawe-simpali
|
Year |
Annual maximum rainfall (mm) |
(Xi-$\overline{\mathrm{X}}$)² |
(Xi-$\overline{\mathrm{X}}$)³ |
(Xi-$\overline{\mathrm{X}}$)4 |
|
2009 |
208 |
299.29 |
-5,177.72 |
89,574.50 |
|
2010 |
249 |
561.69 |
13,312.05 |
315,495.66 |
|
2011 |
149 |
5,821.69 |
-444,194.95 |
33,892,074.46 |
|
2012 |
200 |
640.09 |
-16,194.28 |
409,715.21 |
|
2013 |
350 |
15,550.09 |
1,939,096.22 |
241,805,299.01 |
|
2014 |
274 |
2,371.69 |
115,501.30 |
5,624,913.46 |
|
2015 |
170 |
3,058.09 |
-169,112.38 |
9,351,914.45 |
|
2016 |
195 |
918.09 |
-27,818.13 |
842,889.25 |
|
2017 |
184 |
1,705.69 |
-70,445.00 |
2,909,378.38 |
|
2018 |
274 |
2,371.69 |
115,501.30 |
5,624,913.46 |
|
Total |
2253 |
33,298.10 |
1,450,468.44 |
300,866,167.82 |
|
Average |
225 |
3,329.81 |
145,046.84 |
30,086,616.78 |
Each rainfall frequency distribution has different properties, so it must be tested the suitability of rainfall data with the statistical properties of each distribution. Table shows the maximum average annual rainfall occurring in 2013, which was 350 mm and the minimum rainfall occurring in 2011, which was 149 mm. These results (Table ) show that the type of rainfall frequency distribution that is most eligible to be used in the Simpwed Lawe-simpali subwatershed area is the Log Pearson Type III method. Meanwhile, other types of rainfall frequency distributions do not meet the requirements to be used in Lawe-simpali subwatershed area. Therefore, for the next rainfall analysis, the prediction will use the Log Pearson Type III method.
3.2 Rainfall predictions
Predicted rainfall with a return period of up to 100 years is presented in Table . The smallest predicted rainfall value is found in a biennial return period with a rainfall value of 214.74 mm. The most significant amount of rainfall occurs in the 100-year return period with rainfall of 430.03 mm. The increasing return period of rainfall that will be predicted will increase the value of the expected rainfall. Prediction of rainfall for up to 100 years with a data number of 10 using the Gumbel method will give a standard deviation of about 1.1834 .
The results also show that the probability of rain in the biennial return period with an intensity of 214.73 mm is 50%. The opportunity for rainfall in the five years return period with an intensity of 269.84 mm is 20%. The opportunity for rainfall in the five years return period with an intensity of 269.84 mm is 20%. The probability of rain occurring in the ten years return period with an intensity of 307.26 mm is 10%. The possibility of rain in the 50 years return period with an intensity of 392.37 mm is 2%. The probability of precipitation occurring in the 100 years return period with an intensity of 430.03 mm is 1%. The intensity of this predicted rainfall has been more significant than the results of research that uses the Log Pearson Type III method in determining the expected rainfall that occurs in a certain period.
Table 4. The results of determining the frequency distribution of rainfall
|
Type of rainfall frequency distribution method |
Value |
Annotation |
|
Normal method |
Cs = 0.8952 |
No |
|
Log Normal method |
Cs = 0.1466 |
No |
|
Log Pearson Type III method |
Cs = 0,4093 |
Yes |
|
Gumbel method |
Cs = 0.8952; Ck = 7.6554 |
No |
Table 5. Predictive rainfall with a return period of up to 100 years
|
Rainfall prediction period (year) |
Frequency factor |
Rainfall prediction (mm) |
|
2 |
-0.07 |
214.74 |
|
5 |
0.82 |
269.84 |
|
10 |
1.32 |
307.26 |
|
50 |
2.26 |
392.37 |
|
100 |
2.62 |
430.03 |
3.3 The predicted discharge generated by Lawe-simpali subwatershed
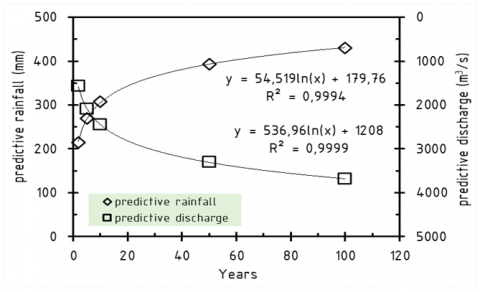
The results of the prediction discharge analysis of the Der Weduwen method with a return period of up to 100 years are presented in Figure . The relationship between the repetition period with the magnitude of the predictive discharge value in the Subwatershed Lawe-simpali region follows the logarithmic model. The model is presented in Eq. (15) with a coefficient of determination of 0.99. The relationship between the repetition period and the magnitude of the predicted rainfall value in the Subwatershed Lawe-simpali area follows the logarithmic model. The model is presented in Equation 16 with a coefficient of determination of 0.99. The average rain duration of the model is 6.74 hours. The accuracy of the Der Weduwen method in this study is reliable in line with the results of the Sustainable Research (2016) [27] which obtained predictive discharge for flood disaster management in Negara River.
$y=536.96 \ln (x)+1208$ (15)
$y=54.52 \ln (x)+179.76$ (16)
Figure 2. Der Weduwen's prediction discharge method with a certain return period
3.4 Hydroelectric power plant classification in Lawe-simpali subwatershed
The results of the power analysis that can be generated by Subwatershed Lawe-simpali at various prediction discharges with a return period of 100 years are presented in Figure . The potential head of the Subwatershed Lawe-simpali region is in the range of 2 m to 10 m. Potential head of 2 m with 100 years return period discharge can generate electricity up to 61.5 kW. This shows that the power plant potential can be included in the micro-scale hydroelectric power plant category. Potential head of 10 m with 100 years return period discharge can generate electricity up to 307.4 kW. This shows that the potential of the plant is included in the category of mini and micro hydropower plants. The potential of this subwatershed includes a very large category considering that the Lawe-simpali subwatershed area is a remote area in which there are rural communities that cannot yet enjoy electricity. If in one house, the rural population uses 450 watts for lighting, then with these resources at least be able to meet a minimum of 58 rural community homes. The potential of electric power generated in the Lawe-simpali subwatershed area has been higher than the results of research which conducted a study of the possibility of electric power from one of the watersheds in China and research results in the subwatershed Ciwidey, Indonesia.
Figure 3. Power that can be generated from the Lawe-simpali subwatershed
An initial investigation to be able to plan a hydroelectric power plant in the subwatershed Lawe-simpali has been carried out. The Log Pearson Type III method is more reliable to be used to predict the frequency distribution of rainfall in this subwatershed with a skewness coefficient of 0.9. The projected maximum rainfall intensity with a biennial return period is 214.73 mm with an opportunity of 50%. The predicted discharge prediction with a biennial return period is 1571.85 m3/s which can generate electricity by 26.2 kW (with a head of 2 m) and 131.1 kW (with a head of 10 m). This hydroelectric power plant has the potential to be utilized at least to be able to meet the power needs of 58 houses around the Subwatershed Lawe-simpali area. The next work of this research is to conduct a study of the carrying capacity of the land and its environment for the establishment of a hydroelectric power plant in the Subwatershed Lawe-simpali.
|
RN |
Prediction of rainfall plan using normal method (mm) |
|
Ra |
average rainfall (mm) |
|
CG |
Gauss coefficient |
|
RLN |
Prediction of rainfall plan using log normal method (mm) |
|
S |
Standard deviation of rainfall |
|
RGM |
Prediction of rainfall plan using Gumbel method (mm) |
|
CGM |
Gumbel coefficient |
|
RLP3 |
Prediction of rainfall plan using log Pearson III method (mm) |
|
CLP3 |
Log pearson III coefficient |
|
L |
River length (m) |
|
I |
The average slope of the riverbed |
|
P |
Power generated (kW) |
|
h |
Head (m) |
|
g |
Gravity (m/s2) |
|
$\eta$ |
Power plant efficiency (%) |
|
Cs |
Skewness coefficient |
|
Ri |
The value of rainfall-i (mm) |
|
N |
The amount of rainfall data |
|
$\alpha$ |
Rainwater runoff coefficient |
|
Ck |
Coefficient of kurtosis |
|
$\beta$ |
Coefficient of reduction in rainfall area in subwatershed |
|
Cv |
Coefficient of variation |
|
QN |
Flood discharge prediction(m3/hr) |
|
AW |
Subwatershed area (m2) |
|
RT |
Rainfall prediction for t-year return period |
|
yi |
Observation data |
|
$\bar{y}$ |
Average |
|
QDW |
Predictive discharge (m3/s) |
|
t |
Rainfall duration (hr) |
|
R2 |
coefficient of determination |
|
$\hat{y}_{i}$ |
Prediction data i |
[1] He, X.P., Reiner, D. (2016). Electricity demand and basic needs: Empirical evidence from China's households. Energy Policy, 90: 212-221. https://doi.org/10.1016/j.enpol.2015.12.033
[2] Shyu, C.W. (2014). Ensuring access to electricity and minimum basic electricity needs as a goal for the post-MDG development agenda after 2015. Energy for Sustainable Development, 19: 29-38. https://doi.org/10.1016/j.esd.2013.11.005
[3] Buchholz, T., Da Silva, I. (2010). Potential of distributed wood-based biopower systems serving basic electricity needs in rural Uganda. Energy for Sustainable Development, 14(1): 56-61. https://doi.org/10.1016/j.esd.2010.01.002
[4] Gultom, T.T. (2017). Pemenuhan sumber tenaga listrik di indonesia. Jurnal Ilmiah Research Sains, 3: 130-138.
[5] Siregar, K., Alamsyah, R., Ichwana, S., Tou, S.B. ( 2017). Rancang bangun mesin pembangkit listrik tenaga biomassa (PLTBM) pada daerah terisolasi dari jaringan listrik PT. PLN (Persero) di Indonesia melalui aplikasi tarwet scrubber dan gas filter. Prosiding Seminar Nasional FKPT-TPI 2017, pp. 150-162.
[6] Guo, Z.W., Li, Y., Xiao, X.M., Zhang, L., Gan, Y.L. (2007). Hydroelectricity production and forest conservation in watersheds. Ecological Applications, 17(6): 1557-1562. https://doi.org/10.1890/06-0840.1
[7] Wang, G.H., Fang, Q.H., Zhang, L.P., Chen, W.Q., Chen, Z.M., Hong, H.S. (2010). Valuing the effects of hydropower development on watershed ecosystem services: Case studies in the Jiulong River Watershed, Fujian Province, China. Estuarine, Coastal and Shelf Science, 86(3): 363-368. https://doi.org/10.1016/j.ecss.2009.03.022
[8] Hatamkhani, A., Moridi, A., Yazdi, J. (2020). A simulation–optimization models for multi-reservoir hydropower systems design at watershed scale. Renewable Energy, 149: 253-263. https://doi.org/10.1016/j.renene.2019.12.055
[9] Huang, Z., Peng, B. (2017). Measuring and mapping the impact of land use and land cover change on the hydropower production-A case study of Jiulong River in Fujian Province. Journal of Water Resources Research, 6: 370-383.
[10] Rospriandana, N., Fujii, M. (2017). Assessment of small hydropower potential in the Ciwidey subwatershed, Indonesia: a GIS and hydrological modeling approach. Hydrological Research Letters, 11(1): 6-11. https://doi.org/10.3178/hrl.11.6
[11] Kusre, B.C., Baruah, D.C., Bordoloi, P.K., Patra, S.C. (2010). Assessment of hydropower potential using GIS and hydrological modeling technique in Kopili River basin in Assam (India). Applied Energy, 87(1): 298-309. https://doi.org/10.1016/j.apenergy.2009.07.019
[12] Mahdavi, M., Osati, K., Sadeghi, S.A.N., Karimi, B., Mobaraki, J. (2010). Determining suitable probability distribution models for annual precipitation data (a case study of Mazandaran and Golestan provinces). Journal of Sustainable Development, 3(1): 159-168. https://doi.org/10.5539/jsd.v3n1p159
[13] Vogel, R.M. (1986). The probability plot correlation coefficient test for the normal, lognormal, and Gumbel distributional hypotheses. Water Resources Research, 22(4): 587-590. https://doi.org/10.1029/WR022i004p00587
[14] Liu, Y.R., Li, Y.P., Ma, Y., Jia, Q.M., Su, Y.Y. (2020). Development of a Bayesian-copula-based frequency analysis method for hydrological risk assessment-The Naryn River in Central Asia. Journal of Hydrology, 580: 124349. https://doi.org/10.1016/j.jhydrol.2019.124349
[15] Sharma, C., Ojha, C.S.P. (2020). Statistical parameters of hydrometeorological variables: Standard deviation, SNR, skewness and kurtosis. n: AlKhaddar R., Singh R., Dutta S., Kumari M. (eds) Advances in Water Resources Engineering and Management. Lecture Notes in Civil Engineering, 39: 59-70. Springer, Singapore. https://doi.org/10.1007/978-981-13-8181-2_5
[16] Syafri, R.R., Hadi, M.P., Suprayogi, S. (2020). Hydrodynamic Modelling of Juwana River flooding using HEC-RAS 2D. In IOP Conference Series: Earth and Environmental Science, 412: 012028. https://doi.org/10.1088/1755-1315/412/1/012028
[17] Vaheddoost, B., Aksoy, H. (2017). Structural characteristics of annual precipitation in Lake Urmia basin. Theoretical and Applied Climatology, 128: 919-932. https://doi.org/10.1007/s00704-016-1748-3
[18] Bilayat, B., Subandiyah, A., Lies, W.K. (2019). Time and cost efficiency of Kedunglarangan River normalization using channel design optimization. International Journal of Scientific Engineering and Science, 3: 15-19.
[19] Herison, A., Romdania, Y., Purwadi, O.T., Effendi, R. (2018). Kajian Penggunaan Metode Empiris dalam Menentukan Debit Banjir Rancangan pada Perencanaan Drainase. Jurnal Aplikasi Teknik Sipil, 16(2): 77-86.
[20] Ertsen, M.A. (2011). A not completely satisfactory attempt": Peak discharges and rainfall-runoff relations for Javanese rivers between 1880 and 1940. History of Geo-and Space Sciences, 2(1): 39-55. https://doi.org/10.5194/hgss-2-39-2011
[21] Penche, C. (1998). Layman’s handbook on how to develop a small hydro site. Luxemburg: European Commission: Directorate General for Energy (DG XVII). 2nd ed.
[22] Paish, O. (2002). Small hydro power: Technology and current status. Renewable and Sustainable Energy Reviews, 6(6): 537-556. https://doi.org/10.1016/S1364-0321(02)00006-0
[23] Elbatran, A.H., Yaakob, O.B., Ahmed, Y.M., Shabara, H.M. (2015). Operation, performance and economic analysis of low head micro-hydropower turbines for rural and remote areas: A review. Renewable and Sustainable Energy Reviews, 43: 40-50. https://doi.org/10.1016/j.rser.2014.11.045
[24] Singh, D. (2009). Micro Hydro Power: Resource Assessment Handbook. New Delhi, India: Renewable Energy Cooperation- Network for the Asia Pacific (RECAP).
[25] Dwiyanto, V., Kusumastuti, D.I., Tugiono, S. (2016). Analisis Pembangkit Listrik Tenaga Mikro Hidro (PLTMH) Studi Kasus: Sungai Air Anak (Hulu Sungai Way Besai). Jurnal Rekayasa Sipil dan Desain, 4(3): 407-422.
[26] Onen, F., Bagatur, T. (2017). Prediction of flood frequency factor for Gumbel distribution using regression and GEP Model. Arabian Journal for Science and Engineering, 42: 3895-3906. https://doi.org/10.1007/s13369-017-2507-1
[27] Utami, S., Lestari, U.S. (2016). Kajian metode empiris untuk menghitung debit banjir Sungai Negara di ruas Kecamatan Sungai Pandan (Alabio). Poros Teknik, 8(2): 86-96. https://doi.org/10.31961/porosteknik.v8i2.373