Saidjon Sheralievich Tavarov* | Alexander Ivanovich Sidorov | Yulia Vladimirovna Kalegina
© 2020 IIETA. This article is published by IIETA and is licensed under the CC BY 4.0 license (http://creativecommons.org/licenses/by/4.0/).
OPEN ACCESS
The article is devoted to solving the problem of increasing the energy efficiency of urban electrical networks based on identifying factors affecting power consumption. According to the established patterns, a forecasting model has been developed, on the basis of which seasonal schedules of electricity consumption by household consumers are proposed. To monitor and control the operating parameters of the urban electrical network, taking into account the functionality of smart electricity meters, a control algorithm is proposed based on the proposed seasonal power consumption schedules by household consumers and a schematic implementation using smart electricity meters.
energy efficiency, power consumption, forecasting model, control algorithm
In the last ten years, the picture of electricity consumption by household consumers in the cities of the Republic of Tajikistan has changed significantly. At the same time, in cities, electricity consumption by household consumers changes not only upwards but also downwards. Neither optimal power consumption by the considered consumers becomes the main reasons for the decrease in the efficiency of urban electric networks.
The identification of factors affecting the uneven power consumption by household consumers remains at the moment the main problem, the solution of which will allow solving a number of problems such as [1-7]:
1. Improve energy efficiency;
2. To increase the reliability of elements of electrical distribution networks;
3. Reduce electricity losses;
4. Equalize the load between the phases;
5. To increase the service life of electrical equipment in urban electrical networks.
The developed norms of specific loads for residential consumers of standard design do not fully correspond to the current conditions. This is primarily because these standards do not take into account the electrical loads generated by air conditioners and electric water heaters.
However, since the main source of electricity in the Republic of Tajikistan is hydroelectric power plants, and their power generation depends on the inflow of water, and the inflow of water comes from the mountains, when glaciers melt on winter days due to frost, there is a sharp decrease in water inflow, which leads to a shortage electricity.
In this case, it is necessary to take into account the specifics of the location of the cities of the Republic of Tajikistan. Depending on the climatic and meteorological conditions of the area and the geographical position of the city, they are located at different heights above sea level with different ambient temperatures.
As an example, from the point of view of territorial location, the ambient temperature in Dushanbe does not fall below -5℃ in winter, and in the Gorno-Badakhshan Autonomous Region with the center of Khorog, the ambient temperature in winter can reach -30℃, therefore, electricity consumption by household consumers in Khorog will be higher than in Khorog. The influence of temperature on power consumption has been sufficiently studied [8-12].
However, this well-known position does not take into account the influence of the geographic location of residential consumers relative to a point above sea level and their welfare [13-21]. According to our assumption, these factors may be an additional factor leading to uneven power consumption, the detection of which will allow solving the above tasks.
The Republic of Tajikistan (RT) on the geographical location of cities has its own characteristics.
These features are:
1. Large elevation differences with the location of cities;
2. Different climatic and meteorological conditions of the area.
Therefore, it is necessary to predict the consumption of electricity by these consumers, since the absence of a forecast will lead to a decrease in the reliability of power supply and everything related to reliability. This is due to the fact that the main source of electricity in the Republic of Tajikistan is hydroelectric power plants, which depend on the inflow of water due to the melting of glaciers.
In the process of searching for a solution to the scientific problem posed, we collected data on power consumption in 9 cities of Tajikistan. The study was based on consumers living in 9 cities of Tajikistan Dushanbe (D), Khorog (X), Bokhtar (B), Kulyab (K), Garm (G), Istaravshan (I), Isfara (Is), Khadzhent (Khad.) and Panjakent (P) total 980 consumers (people).
A visual analysis of the data obtained made it possible to put forward an assumption about the dependence of power consumption on a number of parameters. The purpose of further research was to substantiate this assumption and identify these parameters. The method of achieving the goal was mathematical modeling:
$\mathrm{W}=\mathrm{f}(\mathrm{t} ; \mathrm{h} ; \mathrm{c} ; \mathrm{s})$ (1)
where, W- the amount of power consumption given to us in units of measurement, kWh;
t-temperature coefficient in showing the extreme temperature difference during the study period, given to us ℃.
h-is the geographical coefficient associated with the height of the local area of residence of energy consumers above sea level, the reference value given to us in meters.
с-coefficient of constructive and technological readiness of buildings and structures, consumer places of residence, taking into account the number of storeys of the building, percentage of wear and tear and physical characteristics of networks and wiring in the building, network throughput, type of electricity meters, technologies for collecting data on electricity consumption adopted in this group consumers, given in conventional level units (1 - zero readiness, 2 - low readiness, 3 medium readiness, 4 readiness above average, 5 - high readiness).
S-is the welfare coefficient of consumers living compactly, taking into account the population density, the price per kWh of electricity and the average annual income per capita, given to us per day in units / person.
The modeling was carried out in two stages.
At the first stage:
1) statistical processing of empirical data collected in 9 cities of Tajikistan for 36 months (three years);
2) checking consumer groups for homogeneity in terms of electricity consumption;
3) analysis of the statistical significance of each of the parameters in homogeneous groups
4) search for a form of mathematical recording of the dependence of energy consumption on the identified parameters.
The presented electrical consumers were selected after a qualitative analysis of the structural and technological features of buildings and structures: the main development of cities and the choice of methods of power supply and metering of power consumption were formed in these groups before the beginning of the study period, are identical and have undergone minimal transformation during the study period. Thus, the homogeneity of the groups by parameter "c" was revealed through observations, interviews of experts, work with technical documentation. It turned out to be at the average level.
Statistical processing of empirical data was carried out by the method of finding the average seasonal (winter, spring, summer, autumn) and average annual values of electricity consumption and temperatures in order to level them out and find a trend.
$\mathrm{t}_{0}=\left(\mathrm{T}_{\max }-\mathrm{T}_{\min }\right)_{\mathrm{i}} / 36$ (2)
where, Tmax and Tmin respectively, the extreme maximum and minimum temperature values for the investigated month of the year, i is the month of the year for the three-year study period, t0- is the average annual temperature coefficient.
$t_{\text {winter}}=\left(T_{\max }-T_{\min }\right)_{i} / 9$ (3)
where, Tmax and Tmin respectively, the extreme maximum and minimum temperature values for the studied month of the winter period, i-is the month of the winter period for the three-year period of the study, Twinter-is the average seasonal winter temperature coefficient.
$t_{\text {Spring}}=\left(T_{\max }-T_{\min }\right)_{i} / 9$ (4)
where, Tmax and Tmin respectively, extreme maximum and minimum temperature values for the studied month of the spring period, i-is the month of the spring period for the three-year period of the study, tspring-is the average seasonal spring temperature coefficient.
$t_{\text {summer}}=\left(T_{\max }-T_{\min }\right)_{i} / 9$ (5)
where, Tmax and Tmin respectively, the extreme maximum and minimum temperature values for the investigated month of the summer period, i - is the month of the summer period for the three-year period of the study, tsummer-is the average seasonal summer temperature coefficient.
$t_{\text {autumn}}=\left(T_{\max }-T_{\min }\right)_{i} / 9$ (6)
where, Tmax and Tmin respectively, the extreme maximum and minimum temperature values for the studied month of the winter period, i-is the month of the autumn period for the three-year study period, tautumn-is the average seasonal autumn temperature coefficient.
As a result of processing, the statistical data took the form (Table 1).
By pairwise comparison of the parameter value in the groups with an average sample value of the parameter, all nine groups were tested for homogeneity in terms of the average annual energy consumption parameter. Pearson's X2 statistical goodness test was used for testing.
The statistical null hypothesis Ho was that the two compared groups of consumers are similar in terms of average annual energy consumption for the three years under study.
The X2 value for the groups ranged from 6 to 46.23.
К (degree of freedom)=1,
Р (significance level)=0.05,
Table value $\mathrm{X}_{\text {critical}}^{2}$=3.84.
$\mathrm{X}_{\text {critical}}^{2}<\mathrm{X}^{2} \min =3.84<6$
Since the critical value is less than the calculated one, then the null hypothesis at this level of significance can be accepted, we consider the groups to be homogeneous in the average annual consumption.
As a result of testing at a significance level of 0.05, the hypothesis was confirmed for all experimental groups, but a large scatter of X2 values required an additional study for homogeneity in some groups. As a result of increasing the power of the criterion, that is, at a significance level of 0.01, a block of groups heterogeneous with the rest of the groups according to the proposed parameter was revealed.
Table 1. Statistical data on temperatures and electricity consumption for the cities under consideration
|
Consumers |
Average temperature coefficient for the year (t0), ℃ |
Electricity consumption, kWh |
Average temperature coefficient in winter (twinter), ℃ |
Electricity consumption, kWh |
Average temperature coefficient in spring (tspring), ℃ |
Electricity consumption, kWh |
Average temperature coefficient in summer (tsummer), ℃ |
Electricity consumption, kWh |
Average temperature coefficient in autumn (tautumn), ℃ |
Electricity consumption, kWh |
|
D |
14.40 |
1184.87 |
3.37 |
1888.26 |
14.73 |
890.98 |
25.37 |
783.92 |
14.00 |
1176.32 |
|
G |
10.00 |
1737.31 |
-1.9 |
2762.56 |
10.23 |
1746.47 |
22.4 |
832.72 |
12.53 |
1607.50 |
|
Kh |
7.55 |
1899.34 |
-5.47 |
2290.66 |
8.57 |
760.23 |
21.57 |
328.75 |
10.80 |
619.79 |
|
Is |
12.55 |
1519.92 |
0.10 |
2686.68 |
13.90 |
1253.92 |
25.30 |
523.95 |
12.50 |
1615.14 |
|
P |
12.35 |
1617.93 |
1.00 |
2714.74 |
12.40 |
1445.39 |
23.73 |
689.04 |
12.37 |
1622.57 |
|
I |
11.65 |
1700.13 |
0.07 |
2885.45 |
11.30 |
1603.47 |
23.73 |
689.04 |
12.37 |
1622.57 |
|
Haj |
13.90 |
1367.90 |
0.9 |
2732.95 |
15.90 |
976.37 |
27.33 |
309.52 |
13.80 |
1452.75 |
|
K |
16.25 |
1082.79 |
4.17 |
2150.41 |
16.20 |
928.14 |
28.63 |
174.96 |
16.77 |
1077.66 |
|
B |
15.20 |
1157.73 |
3.77 |
2221.45 |
16.90 |
837.04 |
27.37 |
305.42 |
15.2 |
1267.03 |
So the value of X2 in the groups fluctuated equal to 6 and 6.2, respectively.
When К (degree of freedom)=1,
Р (significance level)=0.01,
Table value $\mathrm{X}_{\text {critical}}^{2}$=6.64.
$\mathrm{X}_{\text {critical}}^{2}>\mathrm{X}^{2} \max =6.64>6.2$
Therefore, the hypothesis of their homogeneity should be rejected (Table 2).
Table 2. Blocks of homogeneous and heterogeneous groups in terms of height above sea level
|
1 block of homogeneous groups |
2 block of heterogeneous groups |
|
P., Is., K., B. |
Had., H., D., G., I. |
Consequently, in the groups Had., Kh., D., G., I. there is a factor statistically significantly influencing, other things being equal, on electricity consumption.
A detailed qualitative analysis of the differences between these groups confirmed the assumption and statistical conclusions: Electricity consumption is a function of the consumer's location above sea level, that is, altitude above sea level is a statistically significant factor affecting electricity consumption.
Further analysis of the empirical data revealed that experimental groups homogeneous in terms of average annual electricity consumption have significant statistical distinction when comparing seasonal energy consumption.
The null hypothesis Ho was as follows: the experimental groups compared in pairs are statistically indistinguishable in terms of energy consumption. Statistical method for assessing agreement - Pearson X2 test.
As a result of statistical calculations, groups were revealed that are homogeneous and heterogeneous in terms of seasonal power consumption.
Within each season, the value of X2 in the studied experimental groups Had., D., K., B., H., G., P., Is., fluctuated:
in the range [2.48; 3.5] in groups, Hud., D., K., B.
in the range [6, 6; 9.2] in groups X., G., P., Is.
Insofar as К=1,
at р=0.05, 3.84>3.5 i.e. $\mathrm{X}_{\text {critical}}^{2}>\mathrm{X}^{2} \max$
Hence there are grounds for the given groups Had., D., K., B. to accept the hypothesis of their homogeneity, but since $\mathrm{X}_{\text {critical}}^{2}<\mathrm{X}^{2} \min =3.84<6.6$, then for the groups X., G., P., Is. it makes sense to reject the hypothesis.
The results are shown in Table 3.
Table 3. Blocks of homogeneous and heterogeneous groups by the parameter of well-being
|
1 block of homogeneous groups with the same climate, wealth height |
2 block of non-homogeneous groups - groups with the same altitude climate, but different in terms of well-being |
|
Had., D., K., B. |
H., G., P., Is. |
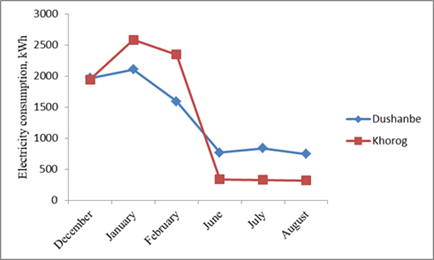
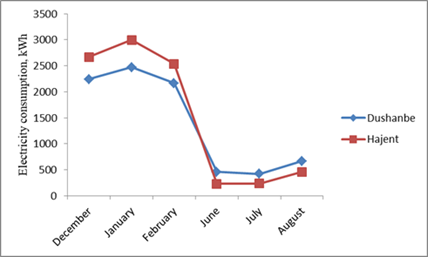
Revealed dependences of the influence of factors on seasonal power consumption (see Tables 1-3), we present the comparative dependences for several cities with different factor parameters, Figures 1-2. When comparing, we will take data from winter and summer periods.
Figure 1. Comparison of the distribution of power consumption values with different temperatures and altitudes above sea level
Figure 2. Comparison of the distribution of energy consumption values with the same temperatures and well-being but at different altitudes above sea level
The groups were subjected to a qualitative analysis of their characteristics, in the course of which it was found that they were distinguishable by the criterion of consumer welfare. So at low temperatures, the amount of electricity consumption increases statistically in those cities where consumers with high per capita income live, since they turn on additional power consumption devices.
Thus, as a result of the first stage of mathematical modeling, statistically significant factors of influence on energy consumption were identified:
t-temperature coefficient,
h-is the height of the local area of residence of energy consumers above sea level,
с-coefficient of structural and technological features of buildings and structures.
S-is the consumer welfare coefficient.
As parameters, these factors were statistically checked for significance, mathematically justified the feasibility of their inclusion and accounting when constructing a mathematical predictive model of power consumption.
Based on the identified factors of influence on power consumption in the conditions of the Republic of Tajikistan, a model for forecasting power consumption is proposed.
$W_{\text {forecast.}}=W_{\text {temporary norms}} \cdot\left(1-\alpha_{i}\right)$ (7)
The coefficient taking into account the factors affecting power consumption is presented in the following form:
$\alpha_{i}=\left(\left(t_{i} \cdot h+c\right) \cdot s\right) /(s+k)$ (8)
where, (ti·h+c)-coefficient that takes into account temperature, geographic (altitude) and design and technological coefficients, an analogue of the constant coefficient in the Tornquist function.
s-consumer welfare, an analogue of income in the Tornquist function.
k-coefficient that takes into account the dynamics and seasonal fluctuations in consumer welfare.
i–month of study.
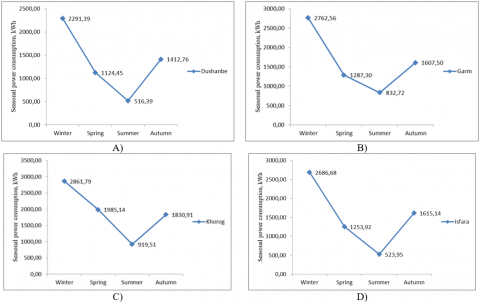
On the basis of the proposed model for forecasting power consumption, taking into account the factor coefficient, seasonal graphs of power consumption for 8 cities of the Republic of Tajikistan under consideration are proposed Figure 3.
Figure 3. Seasonal forecasts of electricity consumption for 8 cities of the Republic of Tajikistan
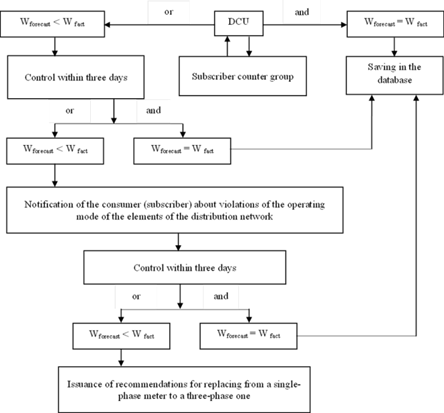
Figure 4. Algorithm for managing electricity consumption by household consumers based on smart meters
As can be seen from the obtained seasonal graphs of electricity consumption, depending on the established factors for the cities under consideration, electricity consumption is different. Consequently, these graphs allow the power supply organization to control the operating parameters of the electrical network.
The use of these graphs will allow the energy supplying organization of the Republic of Tajikistan, OJSC "Barki Tojik", to increase energy efficiency, reliability of power supply, optimize the operating modes of urban electric networks, and also reduce power losses.
At the moment, in the cities of the Republic of Tajikistan, it is at the stage of completing the adoption of a project to install smart electricity meters. The main goal of this project will be to increase the collection of funds for consumed electricity by household consumers. On the basis of the identified factors affecting the electricity consumption by household consumers and the proposed seasonal power consumption schedules (see Figure 3), we proposed an algorithm for managing the electricity consumption of household consumers for the cities under consideration. Considering the functionality of smart electricity meters, this control algorithm can be easily implemented into the function of these electricity meters. Our goal is to monitor electricity consumption to identify household consumers in excess of electricity consumption. This control, in our opinion, will allow solving the above stated problems, and most importantly, increasing energy efficiency and energy saving. Figure 4 shows the proposed algorithm for managing energy consumption by household consumers.
The above algorithm for managing electricity consumption by household consumers, Figure 4, is proposed to be implemented as follows:
1. When transmitting information from installed electricity meters to consumers via the WAN system about electricity consumption, information on actual electricity consumption will flow into the dedicated base - W fact and automatically in the united control center will be compared with the predicted data - Wforecast;
2. In cases where the forecasted data Wforecast<W fact is exceeded, the given consumer is taken under control within three days;
3. After three days, based on the logic "and" or "or", the predicted data is automatically compared-Wforecast with the actual - W fact, in cases Wforecast=W fact, the information is saved, if Wforecast<W fact, the consumer is notified of excessive power consumption;
4. Further points 1 and 3 are repeated;
5. After three days, in cases of further non-compliance with the established data, recommendations are issued to the consumer.
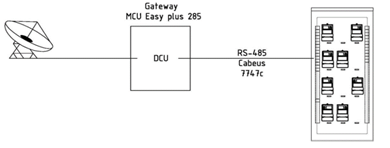
Figure 5 shows a schematic implementation of receiving and transmitting data over the WAN channel from the electricity meters to the "DCU" to the information collection center. The control algorithm and the reception-transmission scheme were transferred to the energy supply organization OJSC “Barki Tojik”, which is implementing a project to install smart electricity meters.
Figure 5. Scheme of receiving and transmitting information from the consumer to the information collection center
In the course of conducting a study on statistical data on electricity consumption by household consumers for 9 cities under consideration, factors influencing electricity consumption were identified, thereby understanding the energy efficiency of urban electrical networks. A forecasting model is proposed based on which seasonal schedules of electricity consumption by household consumers are proposed. To control operating parameters based on seasonal power consumption schedules, taking into account the functionality of smart electricity meters, a control algorithm and schematic implementation are recommended.
[1] Zakaria, Y., Anup, P. (2018). An optimal load schedule of household appliances with leveled load profile and consumer's preferences. International Conference on the Domestic Use of Energy (DUE), Cape Town, South Africa, pp. 1-7. http://dx.doi.org/10.23919/DUE.2018.8384382
[2] Zakaria, Y., Pule, K. (2018). A binary integer programming model for optimal load scheduling of household appliances with consumer's preferences. International Conference on the Domestic Use of Energy (DUE), Cape Town, South Africa, pp. 1-8. http://dx.doi.org/10.23919/DUE.2018.8384381
[3] Sidorov, A., Tavarov, S. (2021). Enhancing reliability of electricity supply of city electric networks cities of Dushanbe. Bulletin of Electrical Engineering and Informatics, 10(1): 46-54. https://doi.org/10.11591/eei.v10i1.2114
[4] Grigoras, G., Scarlatache, F. (2015). Processing of smart meters data for peak load estimation of consumers. 9th International Symposium on Advanced Topics in Electrical Engineering (ATEE), Bucharest, Romania, 864-867. http://dx.doi.org/10.1109/ATEE.2015.7133922
[5] Swalehe, H., Marungsri, B. (2018). Intelligent algorithm for optimal load management in smart home appliance scheduling in distribution system. International Electrical Engineering Congress (iEECON), Krabi, Thailand, Thailand, pp. 1-4. http://dx.doi.org/10.1109/IEECON.2018.8712166
[6] Issi, F., Kaplan, O. (2018). The determination of load profiles and power consumptions of home appliances. Energies, 11(3): 607. https://doi.org/10.3390/en11030607
[7] Angrisani, L., Bonavolontà, F., Liccardo, A., Moriello, R.S.L., Serino, F. (2018). Smart power meters in augmented reality environment for electricity consumption awareness. Energies, 11(9): 2303. https://doi.org/10.3390/en11092303
[8] Yan, K., Wang, X.D., Du, Y., Jin, N., Huang, H.C., Zhou, H.X. (2018). Multi-step short-term power consumption forecasting with a hybrid deep learning strategy. Energies, 11(11): 3089. https://doi.org/10.3390/en11113089
[9] Vojtovic, S., Stundziene, A., Kontautiene, R. (2018). The impact of socio-economic indicators on sustainable consumption of domestic electricity in lithuania. Sustainability, 10(2): 162. https://doi.org/10.3390/su10020162
[10] Ziel, F. (2020). Load nowcasting: predicting actuals with limited data. Energies, 13(6): 1443. https://doi.org/10.3390/en13061443
[11] Naz, A., Umar Javed, M., Javaid, N., Saba, T., Alhussein, M., Aurangzeb, K. (2019). Short-term electric load and price forecasting using enhanced extreme learning machine optimization in smart grids. Energies, 12(5): 866. https://doi.org/10.3390/en12050866
[12] To, W.M., Lee, P.K.C., Lai, T.M. (2017). Modeling of monthly residential and commercial electricity consumption using nonlinear seasonal models - the case of HongKong. Energies, 10(7): 885. https://doi.org/10.3390/en10070885
[13] Ryu, S., Noh, J., Kim, H. (2017). Deep neural network based demand side short term load forecasting. Energies, 10(1): 3. https://doi.org/10.3390/en10010003
[14] Repkina, N.G. (2015). Research of factors affecting the accuracy prediction daily power consumption. Russian Electromechanics, 2: 41-43. http://dx.doi.org/10.17213/0136-3360-2015-2-41-43
[15] Valeev, G.S., Dzyuba, M.A., Valeev, R.G. (2016). Modeling of daily load schedules of 6-10 kV distribution network sections in cities and localities under conditions of limited initial information. Bulletin Of SUSU. A Series of "Energy", 16(2): 23-29. https://doi.org/10.14529/power160203
[16] Sidorov, A.I., Tavarov, S.S. (2020). Method for forecasting electric consumption for household users in the conditions of the Republic of Tajikistan. International Journal of Sustainable Development and Planning 2020, 15(4): 569-574. https://doi.org/10.18280/ijsdp.150417
[17] Sidorov, A.I., Khanzhina, O.A., Tavarov, S.S. Osimi, M.S. (2019). Ensuring the efficiency of distribution networks C. Dushanbe and Republic of Tajikistan. International Multi-Conference on Industrial Engineering and Modern Technologies (FarEastCon), Vladivostok, Russia, pp. 1-4. http://dx.doi.org/10.1109/FarEastCon.2019.8934377
[18] SP 256. 1325800.2016. Electrical installations of residential and public buildings rules of design and installation. http://files.stroyinf.ru/Data2/1/4293751/4293751598.htm, accessed on July 11, 2017.
[19] RM-2696-01. (2001). Temporary instructions for calculating electrical loads of residential buildings. Moscow. Publishing House GUP "NIAC". https://www.ozeu.ru/lib/base0/rm/rm_2696_01.htm
[20] Gorshkov, A.S., Nemova, D.V., Vatin, N.I. (2013). The energy saving formula. Construction of Unique Buildings and Structures, 12(7): 49-63. https://doi.org/10.18720/CUBS.12.7
[21] GOST 30494-2011. Residential and public buildings. Microclimate parameters for indoor enclosures.