Lemou Wu | Yifeng Zheng | Xin Gao | Zeqiang Wang*
© 2020 IIETA. This article is published by IIETA and is licensed under the CC BY 4.0 license (http://creativecommons.org/licenses/by/4.0/).
OPEN ACCESS
Following the rapid development of China's construction industry, the formwork support system has become one of the indispensable temporary facilities at construction sites such as industrial and civil construction, and bridges. This paper aims to study the progressive collapse (PC) resistance of the formwork support system with couplers under accidental loads. To this end, the software ANSYS/LS-DYNA was used to establish a finite element model, and the components were removed in a short time to simulate the sudden failure of local members under accidental loads. Besides, based on the growth rate of axial force, the authors compared the PC resistance of formwork support systems under the conditions of different failure time, failure positions, spacing of upright tubes, lift height of horizontal tubes, and semi-rigid node stiffness. The results show that: the shorter the local failure time of the structure, the more obvious the dynamic response of the remaining structure; under the failure of different members, the maximum growth rate of the axial force for the adjacent members ranked from large to small: angle member>side member>internal member; in case of the member failure, the maximum growth rate for the axial force in the adjacent members is proportional to the spacing between upright tubes and inversely proportional to the lift height of the horizontal tubes; with the increase of the node stiffness, the maximum growth rate of the axial force hardly changes, but the response time of structural yielding gradually increases. The research findings provide references for future research in this direction and the compilation of specifications.
progressive collapse (PC), formwork support system with couplers, horizontal tube, upright tube, node stiffness
In recent years, with the rapid growth of China’s economy, the demands for industrial and civil construction, bridges and other building facilities have increased, and the architectural design has been increasingly developing in the direction of high space and large span. This has brought increasing pressure on the design and installation of formwork supports [1-3], when they are widely applied in building facilities now.
André et al. [4] introduced the risk analysis process of the selected bridge structure in the Cuplok system through the newly formulated risk guidance structure design method of the structural robustness and structural vulnerability index. Hu et al. [5] analyzed the force performance of the tall formwork support by removing the poles at different positions, and compared the PC resistance of the tall formwork support in the scenarios of non-diagonal brace, diagonal brace only in the horizontal directions, and diagonal brace in both horizontal and vertical directions. An et al. [6] proposed a tall formwork support system for preventing PC, which is composed of a dual-function sub-system and a single-function sub-system; these two sub-systems work together under normal design conditions (the first stage); occasionally the single-function sub-system fails first, and the dual-function sub-system works independently to avoid the continuous collapse of the entire structural system (the second stage). Popescu et al. [7] put forward a new formwork system as a solution to saving pouring materials, reducing labor, and saving economy for precast hyperbolic concrete geometry. Darwish et al. [8] developed a new scaffolding system based on the concept of cable arch, and performed parametric research to prove that the proposed system reduces the load-bearing capacity and is superior to the commonly used scaffolding system in terms of economy, efficiency, and occupation of construction site space. Lam et al. [9] presented a scaffolding monitoring system that detects and reports abnormal conditions before accidents occur. Chandrangsu and Rasmussen [10] conducted a few field measurements of geometric defects of the formwork support system, including the non-verticality of the upright tubes, the degree of structural asymmetry and the degree of load eccentricity, as well as the node test of the formwork support; also, statistical analysis of the data was used for the practical application of formwork support system modeling and probability evaluation.
As an important temporary structure during the construction period, the formwork support system should be designed, installed, and supervised in a strict manner. However, for a long time it has received less attention than the permanent structure. The related theoretical research is relatively backward, which is one of the reasons for the frequent occurrence of construction accidents dominated by the collapse of the formwork support system in recent years [11-14]. The analysis for the reasons of accidents has found that most of the accidents stem from design calculation and construction deficiencies, external factors, and excessive accumulation of materials and equipment etc. Meanwhile, most of the collapse process is progressive collapse, indicating that insufficient understanding of the PC resistance of the formwork support system is also one reason for frequent collapse accidents [15-17].
The PC occurs when some components in the structure are locally damaged in the case of accidental external load or large local load, which will cause the original load to be redistributed to the rest of the components, and then lead to damages to them, resulting in a chain effect, and eventually a continuous collapse that is disproportionate to the initial damage [18-21]. At present, most of the domestic research results on formwork support system focus on the calculation model, bearing capacity, and load probability model, but there have been few studies on its PC resistance performance and collapse mechanism, lacking sufficient reference for the compilation of specifications and the design and construction of actual engineering. In this paper, ANSYS-LS/DYNA software was used to analyze the PC resistance of the steel tubular formwork support with couplers. And an nonlinear finite element models under different working condition was established to analyzes the effects of different structural parameters, including spacing of upright tubes, lift height of horizontal tubes, node stiffness, member failure time and failure positions on the PC resistance of the steel tubular formwork support with couplers under accidental loads, which shall provide more theoretical basis for the written specification and actual engineering applications.
In this paper, the alternate path method was applied to analyze the PC resistance of the steel tubular formwork support system. This method simulates the partial failure of the structure by removing one or more components, but not reflecting the root cause of the PC of the structure. It is often used in the analysis of PC of the structure [22, 23].
The formwork support system mainly relies on the vertical axial load borne by the upright tubes. The instability under accidental load often results from the redistribution of the internal structure force and further the generation of a continuous effect when partial upright tubes reach the axial bearing capacity limit and lose the bearing capacity. The authors mainly study the redistribution of internal forces after the component removal under different working conditions, that is, the increase in the axial force of the remaining components, and then explores the impacts of different parameters on the PC resistance.
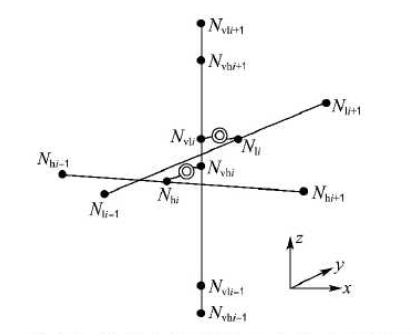
A simulation analysis was performed on the steel tubular formwork support system with couplers using the finite element software ANSYS/LS-DYNA. To establish a finite element model, the upright tubes and horizontal tubes were used as the bending members, and the BEAM161 element was selected; LINK160 element was used, considering that the diagonal brace can improve the overall structural rigidity; the SHELL163 element was used as the formwork to apply surface load and transfer downwards; the COMBI165 element in LS-DYNA was used to simulate the semi-rigidity of the couplers. Considering that in the actual project, the upright tubes and horizontal tubes, the longitudinal horizontal tubes and the transverse horizontal tubes of the formwork support system are not on the same plane, and the load and transmission path are eccentric, the method shown in Figure 1 was used to establish the model. Four nodes were set at the same position, and couplers were established through node coupling, as shown in Figure 1 [24, 25]. Since LS-DYNA, as an object of dynamic analysis, can only couple translational degrees of freedom, it needs to be modified after generating the keyed file, i.e., the keyword *CONSTRAINED_NODE_SET was replaced with *CONSTRAINED_NODAL_RIGID_BODY [26].
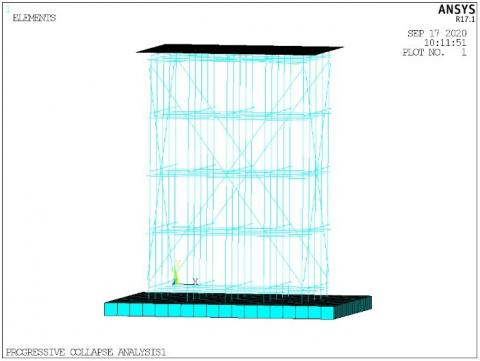
To better compare the effects of different upright tubes’ spacing and horizontal tubes’ lift height on PC resistance, this paper adopts a 4×4 formwork support system structure (5 horizontal tubes in the vertical direction, 5 upright tubes in the vertical and horizontal directions, vertical diagonal bracing in the vertical and horizontal directions, horizontal diagonal bracing on the top horizontal tubes), in which the material of the upright tube was Q235, with the yield strength of 235Mpa, ultimate strength of 370Mpa, density of 7,800kg/m3, elastic modulus of 206Gpa, Poisson ratio of 0.3, and the tangent modulus of 6,100Mpa; the material of the formwork was wood board, with the density of 500 kg/m3, the elastic modulus of 11MPa, and the Poisson's ratio of 0.33, as shown in Figure 2. In addition, the upright tubes were numbered, as shown in Figure 3.
Figure 1. Schematic diagram of the finite element model with coupling nodes
Figure 2. Finite element model of formwork support system
Figure 3. Upright tubes numbering of the formwork support system
4.1 Failure time
In this paper, the alternate path method was used to simulate the sudden failure of a local component under accidental load. First, delete the element at the component to be dismantled, and add the reaction force at each node of the element to the node of the remaining structure; then, simulate the stress state of the complete structure, and delete the load on the remaining structure within a certain period of time to simulate the failure of the component [22, 23]. Because the upright tube is still connected to the remaining horizontal tubes after failure, the loss of its bearing capacity can be simulated by deleting the two elements at the top and bottom of the upright tubes.
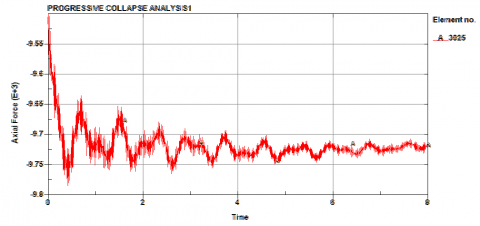
The maximum growth rate in residual axial force after partial failure was taken as the reference standard of PC resistance, and the applied surface load had no effect on the research conclusions. After applying a uniform surface load of 8kN/m2 on the formwork, a time-history curve of the axial force for No. 22 tube was obtained, as shown in Figure 4. It can be seen from the figure that the stress state gradually stabilizes, and the structure does not collapse. Thus, this paper selects 8kN/m2 uniform surface load as the initial stress state of the structure.
The member failure discussed in this paper was caused by accidental loads (such as explosions, accidents, etc.), so it often occurs in a short period of time, usually within a few milliseconds to tens of milliseconds. Generally, the failure time of a member is taken to be 0.1 times or less of the natural vibration period of the structure for the analysis of the PC resistance. This paper sets the structural failure time, namely 0.005s, 0.01s, 0.05s, 0.1s, 0.5s, and 0.1 times the natural vibration period of the remaining structure respectively, and observes the dynamic response state of structure under sudden local failure in different failure time. Considering that LS-DYNA structure will first produce a more obvious dynamic response with the force state changing, and then gradually stabilize, it’s determined to start the reaction force at 2s and end at 5s.
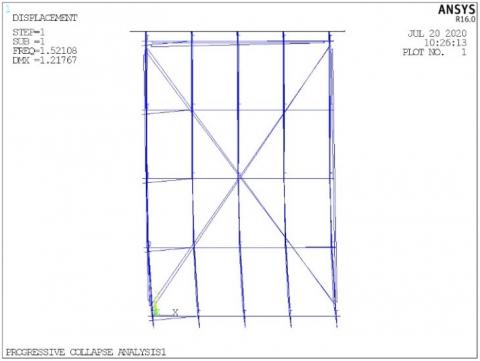
First, use ANSYS model to remove the top and bottom elements of No. 21 tube, and then perform modal analysis on the remaining structure to obtain its natural vibration period of 0.923s and the first-order modal, as shown in Figure 5. Next, perform analysis to achieve the time-history curve of the No. 22 tube’s axial force under the six failure times in Figure 5.
Figure 4. Time-history curves of axial force of No. 22 tube under 8kN/m2 uniform surface load
Figure 5. First-order mode of residual structure
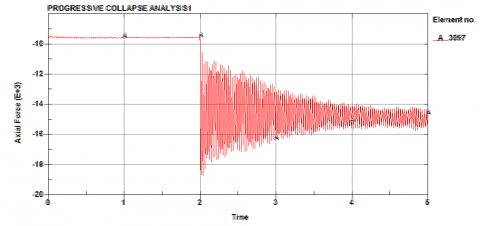
(a) Time-history curve of adjacent members’ axial force under 0.005s failure time
(b) Time-history curve of adjacent members’ axial force under 0.01s failure time
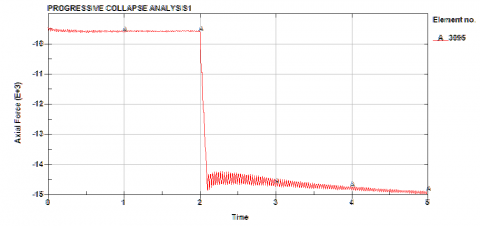
(c) Time-history curve of adjacent members’ axial force under 0.05s failure time
(d) Time-history curve of adjacent members’ axial force under 0.1s failure time
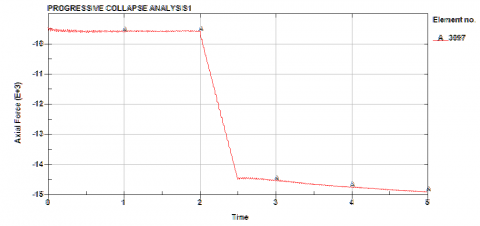
(e) Time-history curve of adjacent members’ axial force under 0.5s failure time
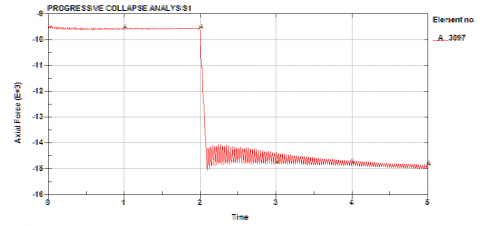
(f) Time-history curve of adjacent members’ axial force under 0. 1s failure time
Figure 6. Time-history curves of adjacent members’ axial force under different failure times
Figure 6 shows that when failure time was very short (0.005s, 0.01s), the structure presented an obvious dynamic response, and the fluctuating value of the axial force at the position of the 22rd tube reached 33% of the average axial force; when the failure time was long (0.5s), the structure after partial failure presented a very weak dynamic response, close to the static analysis; when the failure time was 0.1 times the natural vibration period of the incomplete structure (0.0923s) or close to the 0.1 times the structure vibration period (0.05s, 0.1s), the fluctuating values of the axial force were almost negligible. Therefore, the shorter the failure time of the structure, the more obvious the dynamic response.
4.2 Positions of member failure
The No. 21, 22, 23, 17, 13, and 18 tubes were dismantled to study the PC resistance of the structure under failure conditions at different positions of the members. Because it is similar to a symmetrical structure, the simulation for failure of the 6th tube is representative for summarizing the PC resistance of the structure under all the failure positions of the tubes.
During the simulation process of the failure of the No. 21 tube, the axial force growth rate of the tubes was 52.33% for the 22nd rod and 23.6% for the 17th rod, both showing large changes in the axial force. This indicates that the maximum growth rate for the axial force of upright tubes was 52.33% under the failure of the 21st tube.
During the simulation process of the failure of the No. 22 tube, the axial force growth rate of the several tubes with large changes were: 34.69% for the 21st tube, 39.06% for the 23rd tube, 16.87% for the 16th tube, 12.6% for the 17th tube, and 19.33% for the 18th tubes, while the changes in the axial force of the remaining members can be ignored. This indicates that the maximum growth rate of the axial force was 39.06% under the failure of No. 22 tube.
During the simulation process of the failure of the No. 23 tube, the axial force growth rate of the several tubes with large changes was: 39.32% for the 22th, 22.7% for the 17th, and 13.44% for the 18th tube. This indicates that the maximum growth rate of the axial force was 39.32% under the failure of the 23rd tube.
During the simulation process of the failure of the No. 17 tube, the axial force growth rates of the several tubes with large changes were: 14.6% for the 21st tube, 12.7% for the 22nd tube, 17.8% for the 23rd tube, 16.95% for the 13th tube, and 14.4% for the 18th tube. This indicates that the maximum growth rate of the axial force was 17.8% under the failure of No. 17 tube.
During the simulation process of the failure of tube, the axial force growth rate of the several tubes with large changes were: 19.9% for No. 22, 12.94% for No. 23, and 13.5% for No. 17, 12.7% for the 12th, and 17.8% for the 13th. This indicates that the maximum growth rate of the axial force was 19.9% under the failure of No. 18 tube.
During the simulation process of No. 13 failure, the axial force growth rate of several tubes with larger changes were: 13.56% for No. 18 and 9.5% for No. 23. This indicates that the maximum growth rate of the axial force was 13.56% under the failure of the 13th tube.
It can be seen from Table 1 that in case of tube failure, the axial force was mainly distributed to the adjacent tubes, and the maximum growth rate of the axial force after the failure of the angle member (No. 21) was greater than that after the failure of the side members (No. 22, 23), and much larger than after the failure of the internal members (No. 17, 13, and 18). Moreover, after the failure of the angle member, the maximum growth rate occurred near the adjacent tubes, while it’s similar to the maximum rate after the failure of the side members; when the internal members failed, the axial forces of the angle members, side members and internal members in the adjacent members were more evenly distributed.
Table 1. Maximum axial force growth rate of the upright tubes under different failure positions
|
Spec. |
Node stiffness |
Lift height of upright tubes over horizontal tubes |
Height of bottom horizontal tubes |
Failure tube No. |
Max growth rate |
Failure position at max growth rate of axial force |
|
1.8*1.2 |
19KPA |
0.1 |
0.3 |
21 |
52.33% |
22 |
|
1.8*1.2 |
19KPA |
0.1 |
0.3 |
22 |
39% |
23 |
|
1.8*1.2 |
19KPA |
0.1 |
0.3 |
23 |
39% |
22 |
|
1.8*1.2 |
19KPA |
0.1 |
0.3 |
17 |
15% |
23 |
|
1.8*1.2 |
19KPA |
0.1 |
0.3 |
18 |
18% |
22 |
|
1.8*1.2 |
19KPA |
0.1 |
0.3 |
13 |
17% |
18 |
|
Spec. |
Node stiffness |
Lift height of upright tubes over horizontal tubes |
Height of bottom horizontal tubes |
Failure tube No. |
Max growth rate |
|
1.5*1.3 |
19KPA |
0.1 |
0.3 |
21 |
59% |
|
1.5*1.2 |
19KPA |
0.1 |
0.3 |
21 |
56% |
|
1.5*1.0 |
19KPA |
0.1 |
0.3 |
21 |
53% |
|
1.5*0.9 |
19KPA |
0.1 |
0.3 |
21 |
49% |
|
1.8*0.9 |
19KPA |
0.1 |
0.3 |
21 |
47% |
|
1.2*0.9 |
19KPA |
0.1 |
0.3 |
21 |
50% |
|
0.9*0.9 |
19KPA |
0.1 |
0.3 |
21 |
53% |
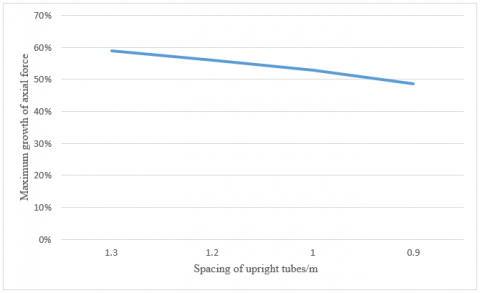
4.3 Spacing of upright tubes and lift height of horizontal tubes
(a) Variation trend of the maximum growth rate of axial force with the spacing of upright tubes
(b) Variation trend of the maximum growth rate of axial force with the lift height of horizontal tubes
Figure 7. Variation curves of the maximum growth rate of upright tubes’ axial force with spacings of upright tubes and lift height of horizontal tubes
The spacing of upright tubes and lift height of horizontal tubes have certain effects on the PC performance, For this, according to the specification JGJ130-2011 Technical Codes for Safety of Steel Tubular Scaffold with Couplers in Construction for the full hall support, the authors set the working conditions, and performed analysis calculation for the axial force growth rate of the 22nd tube after removing the 21st tube under each working condition. Table 2 lists the calculation results. At the same time, the results for lift heights of different horizontal tubes under the same spacing of upright tubes were compared with the spacing of different upright tubes under the same lift heights of horizontal tubes, as shown in Figure 7. It can be found that as the spacing between upright tubes decreases, the maximum growth rate of the axial force also drops; as the lift height of the horizontal tubes decreases, the maximum growth rate does not decrease but increases.
4.4 Node stiffness
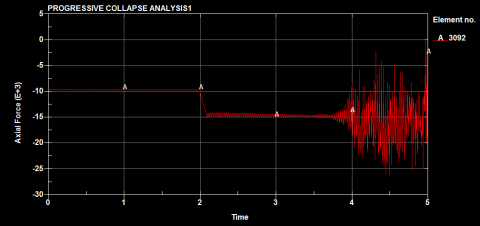
In the actual construction process, the tightening torque of right-angle couplers is generally 40kN·m-50kN·m. When the tightening torque is 40 kN·m, the rotational stiffness of the semi-rigid node in the finite element model should be set at 19kN·m/rad around [24, 25]. Therefore, with other structural parameters unchanged, the node stiffness was set to 9kPa, 19kPa, 29kPa, 39kPa, and 49kPa in five working conditions with no vertical and horizontal diagonal braces. By removing the 21st tube, the observation was made for the axial force growth rate of tube 22, as shown in Table 3. When the node stiffness was 9kPa, the axial force of the structure fluctuated quickly and greatly under the failure of the No. 21 tube, and it can no longer continue to bear the load normally (Figure 8). When the node stiffness was 19kPa, the tube started to yield and entered a stronger dynamic response state at 3.7s (Figure 9). When the node stiffness was greater than or equal to 19KPa, the maximum growth rate of the axial force was 52%-54%, indicating a small or negligible change.
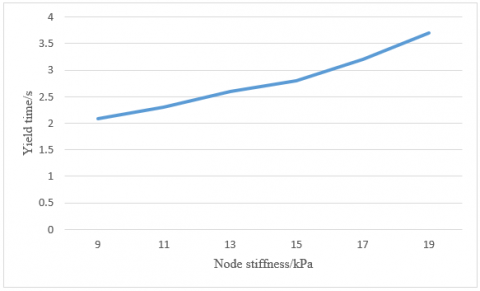
With the node stiffness of 9, 11, 13, 15, 17kPa respectively, the authors observed the changes of structure yield time with node stiffness, and obtained the change curve as shown in Figure 10. It indicates that as the stiffness of the node increases, the yield time is gradually extended.
Figure 8. Time-history curves of axial force of adjacent members with the node stiffness of 9kPa
Figure 9. Time-history curves of axial force of adjacent members with the node stiffness of 19kPa
Figure 10. Curve of structural yield time with node stiffness
Table 3. The growth rate of axial force under different node stiffness
|
Spec. |
Node stiffness |
Lift height of upright tubes over horizontal tubes |
Height of bottom horizontal tubes |
Failure tube No. |
Max growth rate |
Failure position at max growth rate of axial force |
|
1.8*1.2 |
9KPA |
0.1 |
0.3 |
21 |
—— |
22 |
|
1.8*1.2 |
19KPA |
0.1 |
0.3 |
21 |
52.33% |
22 |
|
1.8*1.2 |
29KPA |
0.1 |
0.3 |
21 |
54.4% |
22 |
|
1.8*1.2 |
39KPA |
0.1 |
0.3 |
21 |
54.4% |
22 |
|
1.8*1.2 |
49KPA |
0.1 |
0.3 |
21 |
54.4% |
22 |
This paper analyzes the PC resistance of the formwork support system with couplers using the ANSYS/LS-DYNA finite element software. The main conclusions have been drawn as follows:
(1) The shorter the local failure time of the structure, the more obvious the dynamic response of the remaining structure. Therefore, in the actual construction process, the failure time should be extended as much as possible to prevent excessive fluctuations in the structural stress, which can not only weaken the dynamic response of the structure, but also provide more valuable time for evacuation of on-site personnel and avoid more personnel casualties.
(2) Under the failure of the angle member, the maximum growth rate of the adjacent member’s axial force is the largest, followed by the side member, and the internal member is the lowest. In addition, considering that the sudden failure caused by accidental load generally occurs at the angle member or side member, the design of PC resistance takes no account of the distribution of axial force after the failure of internal members. Thus, in order to prevent the PC caused by accidents, precautions should be set mainly at the position of the corner rods and side rods.
(3) In case of tube failure, the maximum growth rate of the axial force in the adjacent tubes is directly proportional to the spacing of upright tubes and inversely proportional to the lift height of the horizontal tubes.
(4) The changes in the node stiffness have no significant effect on the maximum growth rate of the axial force can be ignored. However, as the stiffness of the node increases, the response time before structure yielding will gradually increase after the structure fails locally. Therefore, the higher node stiffness can improve the stability of the structure.
[1] Xie, N., Zhao, K., Hu, H., Pan, M.D. (2018). Error-tolerant optimization design of high falsework. Gongcheng Lixue/Engineering Mechanics, 35: 101-106. https://doi.org/10.6052/j.issn.1000-4750.2017.05.S018
[2] Peng, J.L., Pan, A.D.E., Chen, W.F. (2001). Approximate analysis method for modular tubular falsework. Journal of structural engineering New York, 127(3): 256-263. https://doi.org/10.1061/(ASCE)0733-9445(2001)127:3(256)
[3] Hadipriono, F.C., Wang, H.K. (1987). Causes of falsework collapses during construction. Structural Safety, 4(3): 179-195. https://doi.org/10.1016/0167-4730(87)90012-9
[4] André, J., Beale, R., Baptista, A.M. (2017). Risk analysis of bridge falsework Cuplok systems. Structure and Infrastructure Engineering, 13(10): 1327-1349. https://doi.org/10.1080/15732479.2016.1265991
[5] Hu, C.M., Wang, J., Mei, Y., Yuan, Y.L. (2019). Analysis on the Progressive Collapse Resistance of Fastener-Style Steel Tube Tall Falsework. Progress in Steel Building Structures, 21(3): 50-55. https://doi.org/10.13969/j.cnki.cn31-1893.2019.03.006
[6] An, Y.C., Xie, N., Jia, Y. (2017). Research on two-stage design of high falsework system against progressive collapse. Gongcheng Lixue/Engineering Mechanics, 34: 289-294. https://doi.org/10.6052/j.issn.1000-4750.2016.03.S058
[7] Popescu, M., Reiter, L., Liew, A., Van Mele, T., Flatt, R.J., Block, P. (2018). Building in concrete with an ultra-lightweight knitted stay-in-place formwork: Prototype of a concrete shell bridge. Structures, 14: 322-332. https://doi.org/10.1016/j.istruc.2018.03.001
[8] Darwish, M., Elsayed, A.Y., Nassar, K. (2018). Design and constructability of a novel funicular arched steel truss falsework. Journal of Construction Engineering and Management, 144(3): 04018002. https://doi.org/10.1061/(ASCE)CO.1943-7862.0001449
[9] Lam, R.C.Y., Lam, L.C.H., Li, N.X., Chu, D.L.M., Lee, P.K.K. (2019). IoT enabled falsework monitoring system for construction safety enhancement. Proceedings-6th Annual Conference on Computational Science and Computational Intelligence, Las Vegas, NV, USA, USA, pp. 1208-1213. https://doi.org/10.1109/CSCI49370.2019.00227
[10] Chandrangsu, T., Rasmussen, K.J.R. (2011). Investigation of geometric imperfections and joint stiffness of support scaffold systems. Journal of Constructional Steel Research, 67(4): 576-584. https://doi.org/10.1016/j.jcsr.2010.12.004
[11] Peng, J.L., Wang, C.S., Lin, C.C., Lin, S.K. (2017). Stability of independent heavy-duty scaffolds: An experimental study. Advanced Steel Construction, 13(4): 318-342. https://doi.org/10.18057/IJASC.2017.13.4.1
[12] Andr, J., Beale, R., Baptista, A.M. (2018). Experimental analysis of bridge falsework Cuplok systems. Proceedings of the Institution of Civil Engineers: Structures and Buildings, 171(9): 719-734. https://doi.org/10.1680/jstbu.16.00081
[13] André, J., Beale, R., Baptista, A.M. (2019). Numerical analysis of bridge falsework Cuplok systems. Proceedings of the Institution of Civil Engineers: Structures and Buildings, 172(3): 170-188. https://doi.org/10.1680/jstbu.16.00082
[14] Hadipriono, F.C., Wang, H.K. (1986). Analysis of causes of falsework failures in concrete structures. Journal of Construction Engineering and Management, 112(1): 112-121. https://doi.org/10.1061/(ASCE)0733-9364(1986)112:1(112)
[15] Wang, F., Song, G. (2020). Looseness detection in cup-lock scaffolds using percussion-based method. Automation in Construction, 118: 103266. https://doi.org/10.1016/j.autcon.2020.103266
[16] Sakhakarmi, S., Park, J., Cho, C. (2019). Enhanced machine learning classification accuracy for scaffolding safety using increased features. Journal of Construction Engineering and Management, 145(2): 04018133. https://doi.org/10.1061/(ASCE)CO.1943-7862.0001601
[17] Atherinis, D., Bakowski, B., Velcek, M., Moon, S. (2018). Developing and laboratory testing a smart system for automated falsework inspection in construction. Journal of Construction Engineering and Management, 144(3): 04017119. https://doi.org/10.1061/(ASCE)CO.1943-7862.0001439
[18] Tian, Y., Lin, K., Lu, X., Zhang, L., Li, Y., Guan, H. (2020). Experimental and theoretical study of seismic and progressive collapse resilient composite frames. Soil Dynamics and Earthquake Engineering, 139: 106370. https://doi.org/10.1016/j.soildyn.2020.106370
[19] Manzur, T., Manzur, T., Mahmood, M.H., Baten, B., Hasan, M.J., Hossain, M.R., Noor, M.A., Yazdani, N. (2020). Assessment of progressive collapse proneness of existing typical garment factory buildings in Bangladesh. Journal of Performance of Constructed Facilities, 34(5): 04020092. https://doi.org/10.1061/(ASCE)CF.1943-5509.0001496
[20] Adam, J.M., Parisi, F., Sagaseta, J., Lu, X. (2018). Research and practice on progressive collapse and robustness of building structures in the 21st century. Engineering Structures, 173: 122-149. https://doi.org/10.1016/j.engstruct.2018.06.082
[21] Pham, A.T., Tan, K.H., Yu, J. (2017). Numerical investigations on static and dynamic responses of reinforced concrete sub-assemblages under progressive collapse. Engineering Structures, 149: 2-20. https://doi.org/10.1016/j.engstruct.2016.07.042
[22] Marjanishvili, S., Agnew, E. (2006). Comparison of various procedures for progressive collapse analysis. Journal of Performance of Constructed Facilities, 20(4): 365-374. https://doi.org/10.1061/(ASCE)0887-3828(2006)20:4(365)
[23] Kim, J., Kim, T. (2009). Assessment of progressive collapse-resisting capacity of steel moment frames. Journal of Constructional Steel Research, 65(1): 169-179. https://doi.org/10.1016/j.jcsr.2008.03.020
[24] Lu, Z.R., Guo, C., Wen, Y.Q., Chen, Z.H., Liu, T., Cao, S. (2016). Study of bearing capacity of fastener steel tubular full hall formwork support system under eccentric load. Dalian Ligong Daxue Xuebao/Journal of Dalian University of Technology, 56(1): 20-27. https://doi.org/10.7511/dllgxb201601004
[25] Lu, Z., Guo, C., Li, G., Cao, S., Li, C. (2016). Bearing capacity of bridge full hall formwork scaffold under eccentric load. Tianjin Daxue Xuebao (Ziran Kexue yu Gongcheng Jishu Ban)/Journal of Tianjin University Science and Technology, 49: 64-72. https://doi.org/10.11784/tdxbz201605010
[26] Hallquist, J. (2007). LS-DYNA Keyword User’s Manual. Livermore Software Technology Corporation, Livermore, CA, 2007. Version 971.