OPEN ACCESS
Petroleum is the world’s primary source of energy and to fulfill the ever-growing energy demands, petroleum is transported throughout the world by various means. Transportation of petroleum through pipelines is one of the principal means of deliverance, because of its significant economic advantages. However, there persists the risk of possible oil spill and gas leakage through these pipelines which could adversely affect the life of the people, environment and can also cause economic loss. Since oil and gas pipelines exists in large networks spread across on regional scale, it is imperative to utilize Geographic Information System (GIS), a rapidly growing technology in oil and gas industry, for predicting the vulnerability of different areas to possible oil spill/gas leakage, by spatial analysis. Fulfilling most of its energy requirements from petroleum, Pakistan has a wide network of oil and gas pipelines spread across the whole country that possess the susceptibility to the concerned hazards. The present study infers to contribute towards the safety of oil and gas industry in Pakistan from future hazards.
risk assessment, GIS, spatial analysis, oil and gas industry, Pakistan
Pakistan, officially the Islamic Republic of Pakistan, is a South Asian country. It is the fifth-most populous and 33rd largest country in the world. Pakistan covers an area of 881,913 square kilometers with 1,046 kilometers coastline along the Arabian Sea, in the South. In the East, Pakistan is bordered by India. It also shares its border with Afghanistan in the west, Iran in the southwest and China in the north. It is the second in the South Asia and only nation in the Muslim world declared as nuclear-weapons state. The economy of Pakistan is growing steadily, demanding higher energy consumption. This energy need is fulfilled by mainly exploiting petroleum resources. In 2014, Pakistan’s oil consumption was at a maximum of 450 thousand barrels per day [1]. Due to Pakistan’s modest oil production, the country is dependent on oil imports to satisfy domestic demands. As of November 2006, Pakistan had consumed approximately 350 thousand barrels of oil and various petroleum products, of which, more than 80 percent was imported. The majority of oil imports come from the Middle East, with Saudi Arabia as the lead exporter. [2] In Pakistan, most of the industrial and agricultural sector is dependent upon the petroleum resources. The need to transport oil is growing at a rapid pace in order to sustain the progressive growth of both the sectors. The transportation by road causes delays, environmental concerns and accidents, more specifically in urban areas. Therefore, transportation of petroleum by means of pipelines is considered as the ideal solution to these problems [3]. In Pakistan, there are several companies that are engaged in the business of transmission and distribution of natural gas. Sui Southern Gas Company (SSGC) operates the gas pipeline network that spreads across the southern part of the country- mainly Sindh and Baluchistan. Sui Northern Gas Company Limited (SNGCL) has the transmission system that extends from Sui in Baluchistan to Peshawar, Khyber Pakhtunkhwa (KPK). PARCO’s (Pak-Arab Refinery Limited) network of pipelines extends from Karachi and goes up to Machhike, Punjab. These systems of pipelines have contributed in reducing the congestion on the roads by substituting the tank lorries. However, despite being the efficient system of transmission of petroleum, they still pose numerous risks to the environment and life, a solution to which has become the basis of this study [4]. As this system of pipelines exist on regional scale, therefore Geographic Information System (GIS) has been utilized in the present study. In terms of definition, GIS is an advanced computer system developed to interpret the spatial and geographic data for better understanding of relationships and trends, usually in maps. GIS is being accepted more effectively than the traditional methods of risk assessment [5]. Risk can be defined as probable damage from a potentially destructive phenomenon in the prescribed area. Risk Assessment delivers the structural basis for the oil and gas industry in mitigating the hazards while ensuring that risk has been reduced to minimal level economically [6]. According to Ingleton, risk assessment is helping to elucidate the decision making and the development of mitigation strategies [7]. Alexander proposed that hazard is the pre-disaster event in which likelihood of disaster prevails, mainly due to self-reliant vulnerability of human population [8]. The above studies pertain the same notion that risk is the cumulative result of hazard and vulnerability. In the present research, GIS is employed for the development of the risk model that manifests the perils and threats to the petroleum infrastructure security.
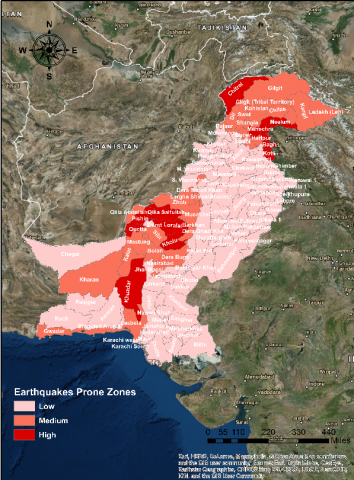
The present research involved several technical steps for the determination of risk zones for oil and gas pipelines. Foremost step was the development of a standard geo-database which held all the information to be utilized in the study. The data acquisition involved several open-source projects including DIVA-GIS directory and ArcGIS online database [9]. ArcGIS 10.1 has been used for the application of Geographic Information System. It is a renowned tool used for dealing with spatial information. The risk assessment was carried out in two phases, firstly, risk due to natural hazards was carried out and then hazards due to human-built environment were studied. The involvement of natural hazards in the risk assessment process is very crucial as Pakistan possess well-defined tectonic structures due to which the region is accustomed to tectonic activities. The suture zones of northern mountainous regions of Pakistan and the Quetta-Chaman Null Fault are the main tectonic features of Pakistan. Since Pakistan is in an earthquake zone due to the trijunction of the three plates, namely, Eurasian, Arabian and Indian Plate. Therefore, it is imperative to involve the tectonic setting of Pakistan into the study. The data for earthquake prone zones of Pakistan was retrieved from Integrated Context Analysis (ICA) [10]. Figure 1 illustrates the earthquakes-prone zones of Pakistan. Pakistan has episodically endured catastrophic floods that have caused devastation to the life and environment. Severe Flooding is also a great safety concern for the pipelines. The force generated by the flow of water, heavy debris, and increased pressure from the high water could affect the safety of the pipeline system. According to the news published in The Telegraph, 2010 floods in Pakistan were regarded as the greatest humanitarian crisis in recent history by the UN [7]. Therefore, the present study has involved the data pertaining to the 2010 Pakistan floods as demonstrated in figure 2 [11].
Figure 1. Earthquakes-prone zones of Pakistan
Figure 2. 2010 Flood affected regions of Pakistan
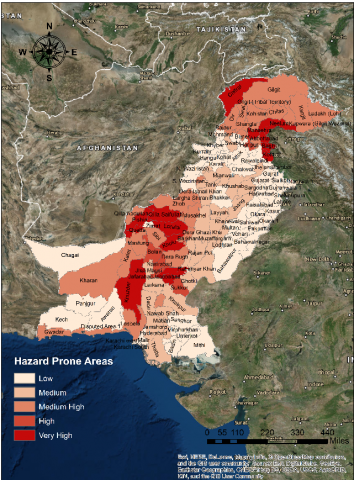
Figure 3. Hazard prone areas of Pakistan
A fixed classification scheme was adopted for the afore-mentioned hazards maps, assigning weightages through which flexibility was attained in the determination of the area.
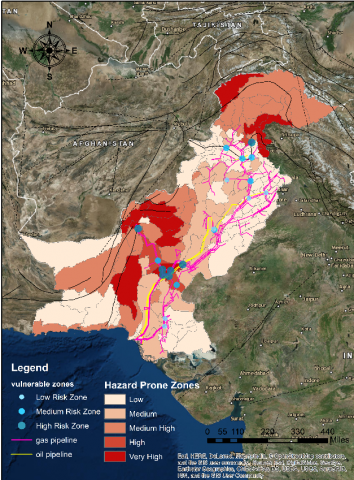
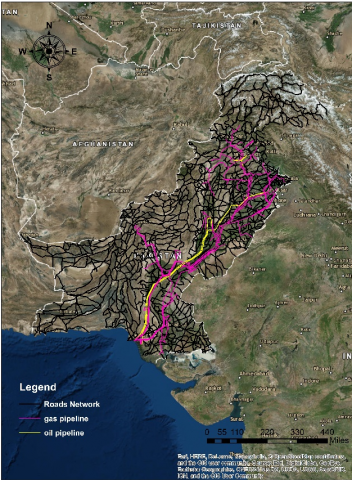
Figure 4. Hazard-prone zones and pipelines network of Pakistan
The individual weightages from both the hazards maps were summed up to derive a resultant map that showed the combined influence of the hazard prone zones. Figure 4 demonstrates this resultant hazard prone map.
The weightage scheme used in figure 3 is from 1-5 namely, low, medium, medium-high, high and very high. This diversified scheme provided a more comprehensive outlook towards the determination of severity of of areas. In order to have a better understanding of the influence of natural hazard-prone on the pipeline network of Pakistan, the oil and gas pipelines were overlaid on the map illustrated in figure 3. The geographic data for oil and gas pipelines was retrieved from the energy map published by Pakistan Petroleum Information Service [12]. The results thus obtained are demonstrated in figure 4.
Figure 5. Final risk zones due to natural hazards
In order to better study the vulnerability factor of the hazard-prone zones, the active faults data has been overlaid over the risk surface [13]. In figure 5, the combination of the active faults and the hazard risk map has been illustrated.
In figure 5, the active faults are illustrated by dark black lines. By thorough visual inspection of figure 5, the liable vulnerable zones were identified and given the ranks on the basis of the severity determined through their adjoining features with rank 1 termed as high-risk zone given to those areas where there is an intersection between the pipelines and the active faults in the high hazard prone zone. Similarly, other regions are indicated by lower ranks on the basis of the intersection or nearness of the adjoining features. The results obtained through this resultant map is keenly discussed in the subsequent section.
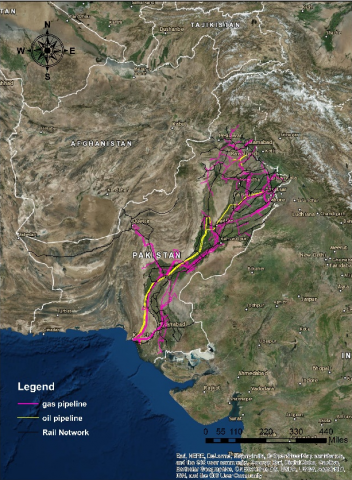
In the second phase of the research, all those features which were related to the human-built environment were involved in the study including roads and rail network and population density. The crossings of these features with the pipelines are illustrated in the subsequent figures (6A-D).
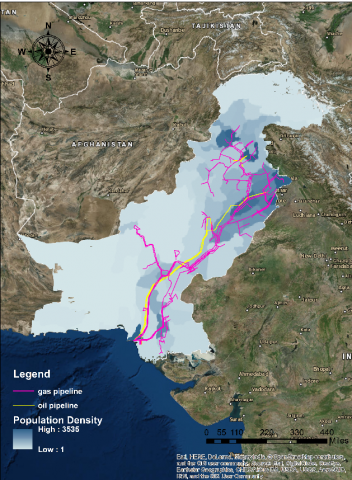
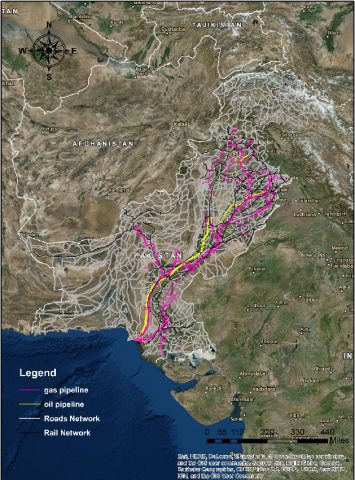
Figure 6A illustrates the crossing of roads networks with oil and gas pipelines in Pakistan. Figure 6B shows the crossings of rail network with the oil and gas pipelines. The combination of both roads and rails networks are demonstrated in Figure 6C. In 2016. The population density of Pakistan was around 251 people per square kilometers of land area which has been illustrated in Figure 6D. The ET Geowizards tool was utilized to form a grid placed all across the country. The points at which the vulnerability features intersected with the oil and gas pipelines were identified as separate point features in a particular shapefile using Intersect Tool. Through the implementation of Join and Relate Feature of ArcMap 10.1, these points were stored in the field named as “count” on district level. By natural breaks classification system, a well-defined and comprehensive weightage values were determined.
Figure 6-A. Roads networks crossing oil and gas pipelines
Figure 6-B. Rail networks crossing oil and gas pipelines
Figure 6-C. Roads and rails networks crossing oil and gas pipelines
Figure 6-D. Population density of Pakistan overlaid by oil and gas pipelines
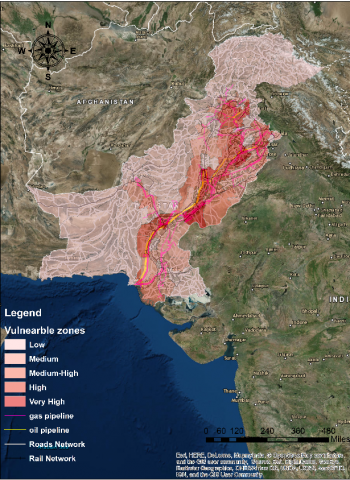
Figure 7. Final risk surface formed by vulnerability features
The Final risk map as illustrated in Figure 7, displayed the hazardous districts in terms of their weightages 1-5, namely low, medium, medium-high, high, very high, with manmade features overlaid on the risk surface of the map.
After the evaluation of hazard and vulnerable zones in Pakistan, it is now imperative to study the risks involved due to leakages of oil and gas. The natural break method was used to determine the ranges for the classification scheme. In natural break method, the data is divided into several classes by identifying the best groups having similar values and that maximize the differences between the classes. The data range included low, medium, medium-high, high, very high. In Figure 5, districts that were in close proximity to active fault lines showed significant risk. The risk involved was also influenced by the earthquakes and floods hazards. The results were utterly made more comprehendible by signifying the intersection of the OG pipelines with blue colored point features which varied in size and color according to the severity of hazard within a specified district.
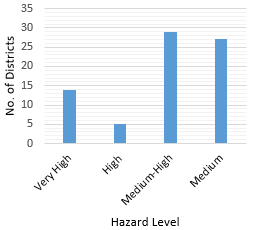
Figure 8. Hazard level district-wise
Figure 8 demonstrate the no. of districts at different level of hazard. Most number of districts lie under the medium-high category. The districts involving low hazard are excluded in figure 8 because they have negligible significance in the study. Khuzdar, Jacobabad, Jafrabad, Qila Saifullah, Pischin, Quetta, Chitral, Muzzafrabad etc. exhibit high level of hazard, most probably due to their proximity towards the active fault lines. The district that expressed very-high hazard occupied an area of 105524 sq. km while the total area of the districts at high level of hazard is 20221 sq. km.
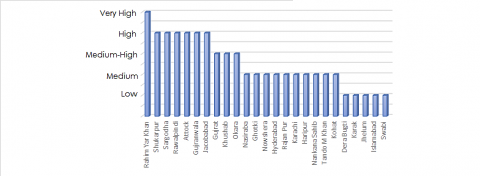
Figure 9. Vulnerable Areas District-wise
Figure 9 illustrate the vulnerability aspect of different districts of Pakistan. Rahimyar Khan is observed as the most vulnerable place prone to environmental and infrastructural damage as a network of pipelines prevail in the region and distribute further throughout the country. Other high vulnerable districts also lie close to Rahimyar Khan most probably due to afore-mentioned reason.
Table 1 enunciated the level of vulnerability throughout Pakistan by expressing the total area at varying level of vulnerability. A comprehensive interpretation of figure 5 and figure 8 was carried out through the involvement of hotspot analysis (Getis-Ord Gi*) in the study. Hotspot analysis is a spatial analyst tool that find its applications in the identification of statistically significant hotspot and cold spots in the data.spatial analyst tool that find its applications in the identification of statistically significant hotspot and cold spots in the data. The value of z-score and p-values indicate the spatial clustering of high or low values. A small p-value and high z-score indicates higher spatial clustering within the features and vice versa. No apparent spatial clustering is indicated by z-score nearer to zero. The mathematical interpretation of Getis-Ord local statistic is given as:
Table 1. Districts at different vulnerability level
|
S. No. |
Vulnerability |
Area (sq. km.) |
|
1. |
Very-High |
39165.83 |
|
2. |
High |
102321.1 |
|
3. |
Medium-High |
114820.2 |
|
4. |
Medium |
182438.1 |
|
5. |
Low |
735233.9 |
$\overline{X}=\frac{\sum_{j=1}^{n} x_{j}}{n}$ (2)
$S=\sqrt{\frac{\sum_{j=1}^{n} x_{j}}{n}-(\overline{X})^{2}}$ (3)
The $G_{i}^{*}$ statistic in equation (1) is a z-score so no further calculations are required.
The Hotspot analysis on the hazard map illustrated in figure 10 shows districts with high concentration of values having high z-score in Balochistan province and northern regions of Pakistan. The blue shaded districts, having significant low values clusters, are mostly seen in districts of Punjab and Sindh.
Figure 11 demonstrates a relationship between p-value and z-value of the data, indicating a high degree of clustering within the data.
The Hotspot Analysis evaluated on the vulnerability data has been illustrated in Figure 12. The results obtained showed higher value concentration in the region of Punjab, since this region has well-established infrastructures and transportation system. The blue shaded areas prominently cover the northern regions of the country showing low values clusters as the region possess mountainous and rugged terrains constraining the transportation throughout the region. The risk assessment should be keenly studied as to provide a theoretical groundwork in analyzing the vulnerability of the oil and gas infrastructure and pipelines [14]. It is envisaged that the proposed risk assessment methodologies will have comprehensive approach for better decisions and effective contingency plans.
Figure 10. Hotspot analysis of hazard map
Figure 11. Hotspot analysis of hazard data
The limitations encountered during the research were related to the acquisition of data. Though the acquired data fulfilled the requirements of the present study and produced meaningful results, the data retrieved from foreign projects could have been more reliable if that same data was obtained from national projects installed for the GIS-integrated data accumulation process.
Figure 12. Hotspot analysis of vulnerability map
Although, petroleum is a great source of energy and economic stability, it poses considerable adversity towards the environment. The degradation of the marine and continental ecosystem is becoming more usual due to increasing population, pollution etc. The accidents are also involved during the transportation of oil and gas. In order to have better understanding of the risks involved, we should have a deeper insight in the risk assessment. The present research is envisaged to provide an effective framework, which would form an essential module in prioritizing areas for the establishment of any future network of oil and gas pipelines.
[1] U.S. Energy Information Administration. The Global Economy.com. http://www.theglobaleconomy.com/Pakistan/oil_consumption, accessed on Jan. 23, 2018.
[2] Energy Information Administration. (2005-2006). Energy Information Administration Pakistan country brief analysis. http://www.eia.doe.gov/cabs/Pakistan/ Background.html, accessed on Dec. 30, 2017.
[3] Riboldi L, Cheng X, Farahmand H, Korpas M, Nord LO. (2017). Effective concepts for supplying energy to a large offshore oil and gas area under different future scenarios. Chemical Engineering Transactions 61: 1597-1602. https://doi.org/10.3303/CET1761264
[4] Ma S, Lyu S, Zhan Q. (2017). Research on the explosive characteristics of oil and gas mixture in urban drainage pipeline. Chemical Engineering Transactions 62: 1399-1404. https://doi.org/10.3303/CET1762234
[5] Cova T. (1999). GIS in emergency management, geographical information systems: Principles, techniques, applications, and management, P.A. Longley, M.F. Goodchild, D.J. Maguire, D.W. Rhind (Eds.), John Wiley & Sons, New York. West Sussex, England: Wiley 845-858.
[6] Tirmizi ST, Tirmizi SRUH. (2017). Hierarchical linear modelling of risk assessment of petroleum installations. Mathematical Modelling of Engineering Problems 4(4): 139-144. https://doi.org/10.18280/mmep.040401
[7] Ingleton J. (1991-2000). Natural disaster management, international decade for natural disaster reduction. (IDNDR) (Leicester: Tudor Rose Holdings Limited, 1999).
[8] Tweedie. N. (2018). The Telegraph, Pakistan floods: disaster is the worst in the UN’s history. http://www.telegraph.co.uk/news/worldnews/asia/pakistan/7935485/Pakistan-floods-disaster-is-the-worst-in-the-UNs-history.html, accessed on Jan. 13, 2018.
[9] DIVA-GIS Data [Online]. Availabe: http://www.diva-gis.org/gdata, accessed on Jan. 13, 2018.
[10] Integrated Context Analysis (ICA), GLOF Hazard Pakistan Layer. http://gis.wfp.org/arcgis/rest/services/ICA/pak_ica_earthquake_2017/FeatureServerGLO, accessed on Jan. 12, 2018.
[11] Zolman L. (2010). PakistanFlood_2010 (FeatureServer). https://services2.arcgis.com/qrAiXJtgThZPiSAh/arcgis/rest/services/PakistanFlood_2010/FeatureServer, accessed on Jan. 10, 2018.
[12] Energy Infrastructure Map (2014). Pakistan Petroleum Information Service, Islamabad, Pakistan.
[13] Global Faults Layer from ArcAtlas (ESRI), FaultLines Rep. https://services.arcgis.com/nzS0F0zdNLvs7nc8/arcgis/rest/services/Sean_View_6/FeatureServer, accessed on Jan. 13, 2018.
[14] Tirmizi ST, Tirmizi SRUH. (2017). GIS based risk assessment of oil and gas infrastructure in Sindh, Pakistan. Environmental and Earth Sciences Research Journal 4(3): 55-59. https://doi.org/10.18280/eesrj.040301