OPEN ACCESS
The study is based on the fact that this city is particularly marked by a rapid urbanization concentrated in the gas field and an attractive pole and constitutes a real economic metropolis, thanks to the activities of exploration and exploitation of the hydrocarbons, of the production, and transport. Industrial effluents released into the atmosphere are increasingly abundant, varied and complex, and various factors such as the development of industrialization, the proliferation of internal combustion engines and the increase in the density of pollutants exposed to the environment. Air quickly worsen the severity of air pollution, situation and progressively complicate the implementation of effective measures. Air pollution is perhaps the most hidden and the most difficult to fight. The levels of this pollution in the air and on the ground depend on the nature and the conditions of the polluting discharges as well as the atmospheric conditions which determine the transport, the diffusion and the fallout of these same pollutants. To achieve our objective, the experimental design method is used to estimate gas concentrations as a function of ambient temperature and smoke dryer temperature, in order to develop deterministic models of gas concentrations. The results of this study can be used to compare rates released, tolerated references specified by Decree 06-141.
Air pollution, atmospheric emission, measurement instruments, industrial rejection, nosif pollutant, Atmospheric dispersion, method of the plans of experiments, estimate of gas concentrations
Air pollution covers all toxic or smelly releases released by human activity into the air. Population growth and the industrial technological revolution are at the root of this growing increase in atmospheric pollutant releases. At the heart of the concerns of public health specialists and government agencies in charge of the protection of the environment. Changes in air components are likely to have an adverse effect on health. It affects the entire ecosystem (air, water, soil and vegetation). There is local, regional or global pollution, some are reversible and some are not, unfortunately. It is urgent to react against the pollutants that poison our planet little by little. Hydrocarbon products are a source of energy for all activities, but they are a major source of pollution because they generate huge amounts of combustion residues. The need to measure the quantities present to control the accumulation of products, their transformations and their fate, as well as to estimate their impact on flora, fauna and the environment. For example, fossil fuel plants, waste incinerators, refineries and motor vehicles produce gaseous effluents, containing oxides of nitrogen and sulfur (NOx, SO, VOC, etc.), even if they are present in low concentrations. Quantity (from a few hundred to several thousand ppm), these pollutants are harmful to the environment and man. Developing an air quality strategy is a complex task for local authorities. They must enforce air quality standards by reducing local emissions of various air pollutants and greenhouse gases, through a set of actions in a limited budget. Defining effective strategies requires accurate and detailed information about the local situation, as well as simple and quick tools to process. Scenario analysis is one of the most commonly used approaches. This methodology makes it possible to use deterministic models of gas concentrations based on the application of the experimental design method, in particular composite centered plans. This technique aims to quantitatively determine the variations of the response function. Significant influence factors. Modeling of the response function can also serve as a basis for finding optimal conditions. To measure the influence of factors ambient temperature (Tam) and fume drying temperature (Tsf) on gas concentrations. The fight against the phenomenon of atmospheric pollution requires timely decisions that must be based on in-depth studies, in particular by using modeling to simulate the dispersion processes that control the evolution of concentrations present in the atmosphere. Many industrial units have been installed on the most fertile land in the country, in areas vulnerable to pollution or developed in areas where groundwater is highly sensitive to pollution.
As a result, industrial complexes that emit pollutants that are very dangerous for public health at the urban periphery are currently located after the expansion of cities in the urban center and their discharges into the air constitute one of the most damaging pollutants in the urban environment. the urban environment. Atmosphere. This problem has become particularly important given its dependence on meteorological parameters.
This article is based on nine sections to eliminate or minimize air pollution from industrial units located at (HRM); drawing on the techniques used, modeling and simulation of pollution control systems proves to be necessary.
In the first section an introduction that allows us to situate the motivations and context of our work, as well as the process, structuring and organization of this research.
The second section presents a description and analysis of sites with methods of experimental measurements
The third section is devoted to the subject that interests us, that is to say, the application of the experimental design method in estimating the gas concentrations of the two sites studied, using in particular the centered composite plans.
Analysis of the test by the method of response surfaces (MSR), for the determination of the field of study is closely related to the initial knowledge held on the physical phenomenon studied but also to the objectives of the experiment.
The results obtained show the effectiveness of the models developed. The centered composite plane used has great capacity and flexibility in the modeling phase. The models developed are able to determine the gas concentrations from measurements of ambient temperature and fume drying temperature.
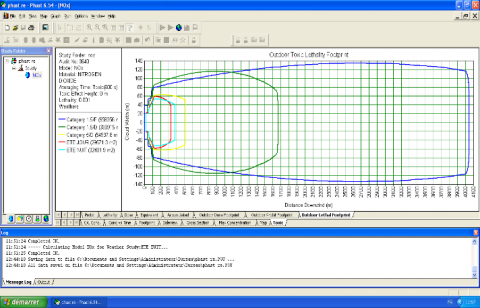
Part 4 presents the simulation of pollutant release dispersion with the PHAST software to examine the progression from a potential incident of initial releases to far-field dispersion, including spill and evaporation, as well as flammable and toxic effects, for our case the spread of the dispersion exceeds 4 kilometers.
Finally, the main conclusions of the various chapters which summarize the original points of our study as well as the perspectives are exposed [1-5].
Figure 1. Portable flue gas analyser (Lancom III)
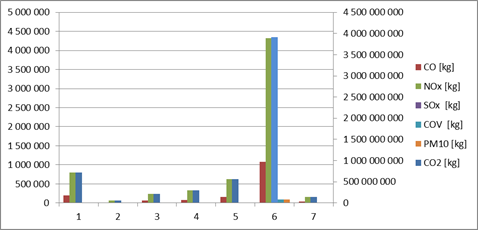
The results of the modeling make it possible to evaluate the emissions of six main pollutants related to the activities of the region of Hassi R'mel. Represents the main contributor of atmospheric pollutants establish emissions inventory management that will be updated annually and include all equipment with:
- The establishment of a data base of emissions related to equipment and maintained,
- Improving the quality of the information held and reassembled (exhaustive list of equipment, age and type of equipment, reports on the composition of regular gases, etc.)
- Maintenance management of leaks to trace the information used by the emissions inventory management database.
For all burners, adapt the combustion and find the best compromise allowing the primary abatement of NOx (decrease the temperature of the flame, without however increasing the production of carbon monoxide CO ....) And if it is necessary, change the burners [6].
Quantitative Health Impact Assessments (QHIA) can quantify the health benefits of air pollution abatement actions. In particular, they have the advantage of being able to estimate the future impact of action projects or actions in the process of being implemented. This contribution describes the results aimed at improving the quality of ambient air, identified in the industrial unit in (H.R.M), and provides an illustration of many cases of application of this approach. The analysis of the methodological elements that may differ according to the nature of the intervention, the context of the evaluation and the availability of the data makes it possible to support the realization of intervention QHIA which are intended to accompany the decisions. The results of these studies, for the most part encouraging, reinforce and encourage the measures implemented or to be. The analysis confirmed that the air in downtown (H.R.M) was rich in contaminated pollution. In this research has also been experimented an innovative method of monitoring the parameters of the releases based on the recording of data mounted on a drone. In the future, this method will be applied to measure pollutant concentrations. This acquisition system was useful for recording data in real time. The acquired data can be useful for building a real-time pollution map of the study area.
Compliance with these specifications is particularly important for the reliability of particle concentration measurements. The site wills continuously measure and record wind speed and direction. In order to validate all the measurements made by the site in self-monitoring, it will be necessary to have the measurements carried out once every five years by a qualified external body if the concentration thresholds specified by Decree 06-141 are exceeded or performance levels defined by the site, the operations department can act at different levels:
• Optimization of combustion source efficiencies,
• During the judgments, consider the advisability of bringing the installations into conformity with the rules of the art in the design of the installations:
• Height and diameter of combustion plants;
• Sizing torches according to API 537;
• Replacement of burners;
• Treat NOX-rich burned gases by.
2.1 Measuring equipment and experimental method
The production units are equipped with several systems of protection and detections for securing factories and equipment among the existing systems in the Hassi R'mel industrial zone are:
Gas detectors: at the facility level
• Infrared temperature sensors: in combustion chambers of turbines, columns, furnaces
• Smoke detectors: in all closed installations and racks rooms.
• Fire detectors: generally at the pumps.
For atmospheric discharges several reference calculation systems or standards can be used to quantify emissions of air pollutants. To date, the measuring devices have not been used by the various stakeholders for the operation of the turbines. As part of our end-of-study theme and to measure NOx greenhouse gas emissions emitted by the gas turbine and for this task we used the (LANCOM III) flue gas meter. The sampling analyzer is a portable mobile instrument that can be used in any place in the facilities. This device is equipped with a probe with an agglomerated ore filter connected to a sampling line the latter is flinching with the device through a sampling tank. A control panel to adjust the parameter according to the nature of the sampling required. Combustion parameters (light gases) are detected and measured on transmission [7].
The concentrations are obtained by direct reading following the introduction of the probe into the flue of the chimney. The parameters measured in (PPM or mg / Nm³) are:
• Carbon monoxide (CO);
• Nitric oxide (NO);
• Nitrogen dioxide (NO2);
• Carbon dioxide (CO2), calculated according to the type of fuel;
• Total Volatile Organic Compounds Index (Cx Hy).
- The modeled emissions concern only the emissions due to the combustion of fossil fuels, consumed by the operational units or sent in torch, and those due to the vents.
- The application of this methodology makes it possible to obtain estimates of emissions by calculation. These are by no means direct measurements of atmospheric releases.
- This approach requires knowledge of relatively few data. In particular no data on machines and equipment present on site (age, efficiency, brand, power ...) is necessary.
- For combustion emissions, only the volumes of fuel consumed, their composition and certain characteristics (density or density, higher heating value) are needed.
Several "paths" of calculation are possible according to the available data. When the necessary data are available, a stoichiometric approach is used to estimate CO2 emissions. For other pollutants, an approach based.
In this section, we will apply the experimental design methodology in estimating gas concentrations as a function of the ambient temperature and the flue gas temperature. Most of the achievements of the experimental plans call for prior specialized knowledge of the field of application. In order to be accessible. the objective initially set in our work is the development of deterministic models of gas concentrations based on the application of the experimental design method [8].
3.1 Models for calculating the gas concentrations of the two sites studied using the experimental design method
The database used in this work is actual records of the two sites studied. The calculation values of the gas concentrations for the different values of the ambient temperature and the flue gas temperature are illustrated in Tables 1 and 2. The objective in this work is to model each gas concentration. Using the experimental design method and in particular the composite centered plans [9].
Table 1. Data from the first site
|
Tam (°C) |
Tsf (°C) |
CO |
NO |
NO2 |
SO2 |
CO2 |
N0x |
|
13,5 |
414 |
88 |
29,33 |
51,67 |
18 |
4,84 |
96,67 |
|
15,3 |
418,7 |
70 |
34 |
43,67 |
6 |
5,23 |
95,33 |
|
23,6 |
428,4 |
36,67 |
43,33 |
16 |
0 |
2,3 |
82,67 |
|
Tam (°C) |
Tsf (°C) |
CO |
NO |
NO2 |
SO2 |
CO2 |
N0x |
|
17,8 |
372,3 |
0 |
106 |
2 |
0 |
7,34 |
163,33 |
|
20 |
403,3 |
0 |
106,67 |
2 |
3 |
7,27 |
164,67 |
|
20,6 |
410,9 |
0,67 |
90,67 |
0 |
0 |
8 |
138,67 |
|
29,1 |
534,8 |
6,33 |
90,67 |
4 |
0 |
2,79 |
143,33 |
3.2 Analysis of the test by the response surface method (MSR)
MSR is the second part of the experimental design method. This technique aims at quantitatively determining the variations of the response function with respect to the significant influence factors. Modeling of the response function can also serve as a basis for finding optimal conditions. In what follows we will present the experimental design used during our work. We want to measure the influence of the factors following: the ambient temperature (Tam) and the flue gas temperature (Tsf) on the gas concentrations.
3.3 Choice of factors and experimental domain
The determination of the field of study is closely related to the initial knowledge held on the physical phenomenon studied but also to the objectives of the experiment. In addition, care must be taken to minimize the cost of the study, expressed in number of trials. It is very interesting to mention that the results of the study will only be valid for the range of factors considered as shown in Tables 3 and 4 [10].
Table 3. Domain of variation of the factors (Field of study) of the first site
|
Factors |
Min (low level) |
Max (high level) |
|
Tam (°C) |
13,5 |
23,6 |
|
Tsf (°C) |
414 |
428,4 |
|
Factors |
Min (low level) |
Max (high level) |
|
Tam (°C) |
17,8 |
29,1 |
|
Tsf (°C) |
372,3 |
534,8 |
The limits of this domain have been chosen here so that it is as wide as possible, while hoping that the operation of the system remains relatively homogeneous in this field. The choice to take two levels of study for each factor implies of course that one assumes linearity or at least a monotony of the evolution of the response between these two levels.
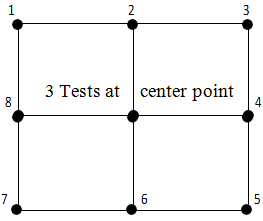
For the study of the response surfaces we used the composite plan with centered faces. The plane used is a composite plan with centered faces allowing modeling the evolution of a criterion by means of an analytical quadratic form taking into account 2 parameters (Figure 2) [11].
Figure 2. Experimental points of the two-factor centered-face composite plane
The models proposed based on the method of composite centered type experiment plans in the following form:
Concentration = a1.Tam+a2.Tsf + a12.Tam.Tsf + a11.T2am + a22T2sf + a0
With a0, a1, a2, a11, a12, a22 are the coefficients of the proposed model.
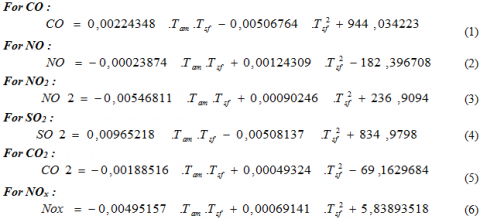
The models obtained based on composite experiment plans centered for each site are the following:
From the first site:
The second site: the calculation method is identical to the calculation of the first site.
The model developed, using the simple centered composite plane, gives an error-free estimation of the overall efficiency values of the turbine.
3.4 Statistical analyzes of the model developed for CO of the first site
Tables 5, 6 and 7 present the statistical analyzes of the model developed for CO of the first site.
Table 5. Regression statistics
|
Multiple coefficient of determination |
1 |
|
coefficient of determination R2 |
1 |
|
coefficient of determination $R_{a}^{2}$ justé$ |
-6,9849.10-10 |
|
Standard error |
0 |
|
Observations |
3 |
Table 6. Analysis of variance
|
|
Degree of liberty |
Sum of squares |
Average squares |
|
Regression |
5 |
1356,5526 |
271,31052 |
|
Residues |
4294967295 |
0 |
0 |
|
Total |
4294967300 |
1356,5526 |
|
|
Observations |
Previsions |
Residues |
Standardized residues |
|
1 |
88 |
-1,1369.10-13 |
-28226,7171 |
|
2 |
70 |
-2,2737.10-13 |
-56453,4342 |
|
3 |
36,67 |
-7,1054.10-14 |
-17641,6982 |
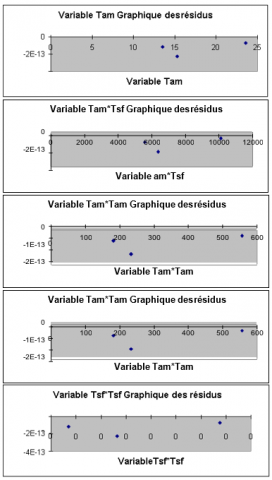
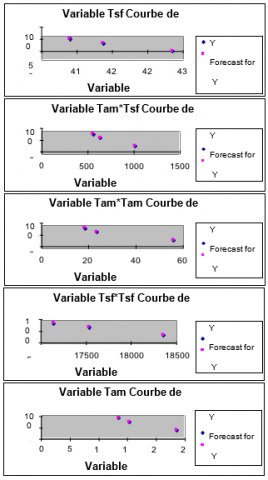
In Figures 3 (a) and (b), we present the different residue graphs and coefficient regression curves of the model developed for CO of the first site. The models developed reproduce the gas concentrations for the two sites studied in the modeling phase without error for the different values of the ambient temperature and the dry temperature of the fumes. In conclusion of this section, we have developed deterministic models of gas concentrations for two different sites using the experimental design method. The results obtained show the effectiveness of the models developed. The centered composite plane used has great capacity and flexibility in the modeling phase. The models developed are able to determine the gas concentrations from measurements of ambient temperature and dryer temperature already made.
Figure 3. (b). Different coefficient regression curves of the model developed for CO of the second site
Table 8. Major sources of air emissions from sites
|
Installation |
Main pollutants expected |
|
22 Gas turbines |
CO2, CO, NOx, CxHy |
|
3 Breather (i.e. vent) fitted to the lubricating oil cover of each turbine |
CH4, CO2, CO, NOx, COV, oil droplets |
|
29 Torches |
CO2, CO, NOx, CxHy and soot in case of incomplete combustion (especially at high flow rates) |
|
6 Emergency generators |
CO2, CO, NOx, CxHy, SOx et suies sous forme de particules |
|
14 ovens |
CO2, CO, NOx, CxHy |
|
5 partial condensing glycol regeneration boilers
|
CO2, CO, NOx, CxHy for the boiler discharge chimney Water vapor (constituting the main part of the discharge), VOCs (in particular glycol and other molecules derived from them) and mercury vapor for the regeneration process chimney |
|
Fire engine (emergency) |
CO2, CO, NOx, CxHy, SOx and soot in the form of particles |
The atmospheric emissions are evacuated by chimneys or by an evacuation pipe designed to allow a good diffusion of the emissions. These exit points are identified and numbered according to existing facilities. The main sources of air emissions identified during the audit are as follows. Potential effluent discharge points of industrial units in abnormal or degraded mode of operation are not subject to qualitative and quantitative analyzes. The analysis campaign focuses on the analysis of effluent discharges discharged from industrial facilities [12].
. The weather in the Hassi R'mel region
The concentration of pollutants in the atmosphere is highly dependent on weather conditions. After a consultation of weather service Hassi R'mel, it was able to obtain the data of last six months of the year 2011 [13].
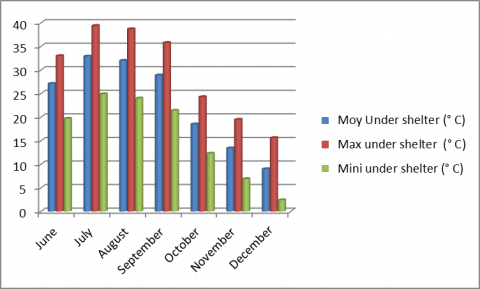
. Temperature
Temperature affects the chemistry of pollutants: cold decreases the volatility of certain gases while summer heat promotes the photochemical formation of ozone.
Table 9. Temperature monthly average
|
Temperature |
Jun |
Jul |
Aug |
Sept |
Oct |
Nov |
Dec |
Moy (℃) |
27,1 |
32,9 |
32 |
28,9 |
18,5 |
13,4 |
9 |
Max (℃) |
33 |
39,4 |
38,7 |
35,8 |
24,3 |
19,5 |
15,6 |
Mini (℃) |
19,7 |
24,9 |
24 |
21,4 |
12,3 |
6,9 |
2,4 |
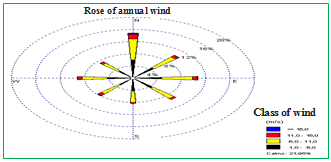
. The wind
Wind is an essential factor in the dispersion of pollutants. The speed of the wind plays on the dilution and the dispersion of the pollutants, the direction directs, meanwhile, the fallout of plumes. When winds are weak, the influence of local terrain is strong and local or regional breezes appear.
|
Month (2011) |
Jun |
Jul |
Aug |
Sept |
Oct |
Nov |
Dec |
|
Monthly average (m/s) |
55,6 |
60,9 |
49,6 |
56,7 |
37,2 |
52,1 |
43,6 |
Figure 5. Average monthly wind
Figure 6. Rose of wind
. The speed and direction of the wind
There is an obvious relationship between wind speed and pollutant concentration levels. Pollutant dispersion increases with wind speed and turbulence. Wind speed increases with altitude. As pollutants rise, horizontal dispersion is facilitated by wind. The stronger the wind, the lower the levels of pollution in the city. On the other hand, a low-speed wind favors the local accumulation of pollutants [13].
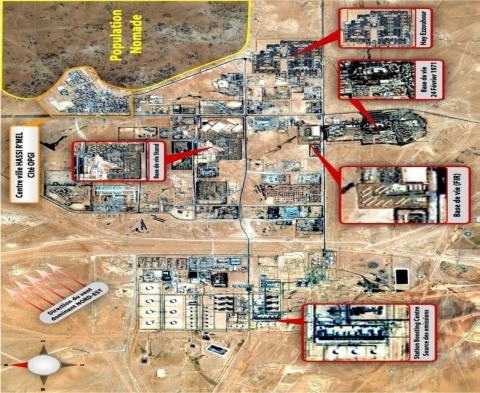
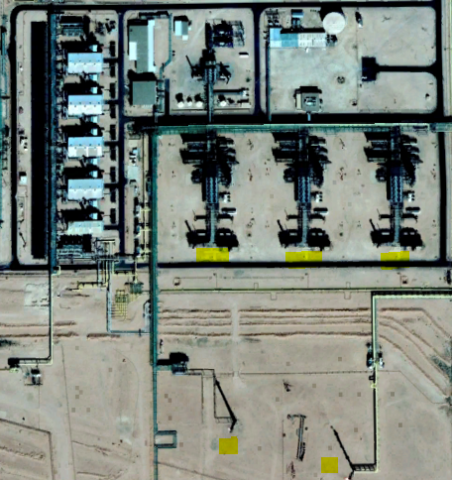
Figure 7. Position of the population in relation to pollution sources
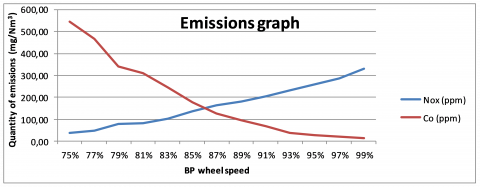
Figure 8. Turbine emissions curve
In this work we have increased the speed of the LP wheel after the end of the start sequence at the have to note the different stages of change of NOx and the CO of the speed 75% (end sequence of start of the gas turbine MS 5002C) and have continued the operation up to the maximum power of the turbine (maximum load) and at the end of this work a reference table has been obtained which shows the quantities of NOx and CO as a function of the speed BP of the turbine and added that this work was performed at ambient temperatures of 29 ° C and in the month of May where the turbine runs at its summer regime and that greasy has the influence of climatic conditions on the turbine and on all the ambient temperature and after this work we divided the operation of the three-zone turbine for each component NOx and CO:
Zone 1: safe zone [75% 89%]: In this zone the quantity of emissions of gases NOx are between very low up to an acceptable quantity which exceeds the norms because after the start of the turbine one does not have a great amount of combustion and with the increase of the speed of the BP wheel so the emissions will be more but they exceed the standards but in this phase have distinguished that the turbine output and very low and the operator cannot work with this scheme to spread to the production requirement of the modules so the slashing of the emission rates will not be taken into account and that to satisfy the production.
Zone 2: ideal zone [91%]: In this zone all the factors which interest us are in the ideal state or it is between 200 and 205 mg / Nm3 and this value and proportional with the quality of the emitted fuel of the module 1 (composition of the gas) and for the yield is ideal to spread to the production requirement it is for all these factors have chosen this area and the most ideal for reducing NOx emissions and for the good continuation of production.
Zone 3: danger zone [93% 99%]: In this zone the emission rate to exceed the norm by what it exceeded 200 mg / Nm3 so if the production will continue with this regime will affect our environment and it will start from then the environment to the good work until to our home or have reached the neighboring population despite the point of view exploitation will satisfy the demand for production and with large quantities.
Zone 1: The safe zone [93% 99%]: In this zone the emission rate is very acceptable and it does not exceed the standard and is proportional with the speed of the LP turbine wheel. That it increases the low emissions rate.
Zone 2: the ideal zone [91%]: In this zone all the factors which interest us are also in the ideal state or the emissions of CO is 76.6 mg / Nm3 is they are far than the zone of danger.
Zone 3: the zone of danger: in this zone the quantities of rate of the emissions and between one can acceptable until very dangerous and which are between 95.1 and 544 mg / Nm3 to it are to exceed the rate to require in the norms and the norm Algerian regulations and this amount shows directly after the end of the start sequence of the turbine to it is very large thanks to the poor combustion and stability of the flame.
After carrying out this work by regulating the speed of the LP wheel with respect to the quantity of NOx emissions and CO also want to value this work by the recommendations to reduce greenhouse gas emissions which are:
1. Use of the values of this table by setting the speed of the LP wheel on the value of 91% to reduce the greenhouse gas emissions and that for all the cases of production and also the cases of the climatic conditions,
2. Decrease the number of turbine start-ups in critical cases such as overhaul and emergency shutdown to avoid the accumulation of CO quantities.
3. The installation of online measuring devices and which clamp bound with the GAP and also to make periodic measurement at least every 6months (to check the summer diet and the winter diet)
4. So invest its installation by implementing systems like DLN to the DLE to protect the environment from atmospheric emissions.
4.1 Modeling the dispersion of NOX releases with PHAST software
PHAST is a software program used to evaluate situations presenting potential risks for personnel, facilities and the environment, and to measure the severity of its situations. PHAST belongs to a product range developed by DNV Software, recognized as the world leader in the field of industrial accident risk assessment. Naturally it has been adopted by many leading international companies and by governments as a valuable tool for decision support in industrial risk and public safety. PHAST examines the progression of a potential incident from the initial dispersion to far-field dispersion, including modeling of spill and evaporation puddles, as well as flammable and toxic effects. PHAST employs several methods of modeling hazardous phenomena among these methods: the CCPS (Roberts HSE) model that is used in our study [14].
4.2 The dispersion of NOx with the PHAST software
The results of measurements indicate no exceedance to the limit values indicated in the Executive Decree 06-138 for the gases detected by the flue gas analyzer. The results demonstrate an extremely low content of SO2 and compliant. On the basis of this result, the sulfur compounds content of the burned gases will be considered as zero in the context of the release inventory method described in the following paragraph.
The results demonstrate a consistent NOx content for the five combustion equipment considered, which represents the diversity of the combustion plants in the central area of Hassi R'mel. The results demonstrate an extremely low CO content which reflects good combustion control for the combustion equipment. The CO and NOx contents can be lowered by improving or modifying the burners. Further recommendations are given in the next section as part of a comprehensive program to reduce emissions of air pollutants [15].
Air is essential for life, but it can have harmful effects if its quality is bad. Its pollution poses an immediate threat to health, but also has an effect that is increasing over the years. The most sensitive people, such as children, the elderly, heavy smokers, patients with heart or lungs, are the most affected by air pollution. For them, pollution can promote diseases, worsen some, and sometimes even precipitate deaths. The effects of air pollution on health increase with the concentrations of polluting substances in the air and the duration of exposure. For some pollution indicators, the regulation defines reference concentrations to guide the action of public authorities. These are limit values and warning thresholds. Most epidemiological studies of the effects of exposure to air contaminants can be categorized into two broad types of research design:
• Time series studies provide information on acute effects (short-term effects)
• Cohort studies provide information on chronic effects (long-term effects).
According to the World Health Organization (WHO), estimating the health impacts of air pollution should include both acute and chronic effects (World Health Organization, 2000). Epidemiological studies showing an association between ambient concentrations of contaminants and an increase in mortality, did not establish a threshold, a minimum concentration below which there would be no significant effect. It appears that the relationship between contaminant levels and health effects is linear [16, 19].
Figure 9. Sources of pollution emissions from the production unit
Figure 10. The extent of pollutant dispersal
Figure 11. Pollutant release rates
Since the industrial revolution, humans have emitted substances in the atmosphere, mainly in the form of particulate and gaseous, which have an impact on their health and their environment: this is atmospheric pollution. Air pollution and its consequences is a topical issue, which we hear about today, the problem of climate change and its causes, and more precisely the extent of the disruption caused by answering the question. What are the consequences of air pollution on our environment, and how does man deal with it?
For this, we first sought information on the site description and the identity of the pollutants, their sources of emission and measuring equipment and experimental method.
It is clear that the man is at the origin of these emissions, but we have been able to note that the sectors of the industry, especially during the combustion of the fossil energies were at the origin of the emission of the atmospheric pollutants. Then, we turned to models for calculating the gas concentrations of the two sites studied according to the experimental design method. The damage that these gases do to our environment. There we became aware of the impact of the pollution and the extent of the damage it could create. Indeed, we first analyzed and tested the response surface method to measure the influence of the following factors, ambient temperature (Tam) and flue gas temperature (Tsf) on gas concentrations. To do this, it is necessary to draw the different graphs of the residuals and the different regression curves of the coefficients of the model developed. However, the role of topo climates should be moderate and play a role in the temporal distributions of particle concentrations. The causes are multiple to explain the levels of particles encountered in the Hassi R'mel area, the meteorological variables are therefore not sufficient to explain the particle concentrations revealed in particular the importance of local pollution. In order to reinforce these results and to complete these measurements carried out over a few days and in several places, the following part differs by the implementation of a dispersion modeling and the extent of atmospheric discharges make it possible to evaluate the emissions of six main pollutants related to the industrial activities of the site study. Atmospheric releases remain in the precise causes of the respiratory disorders encountered with regard to the composition of the pollution, given the complexity and heterogeneity of the pollutants involved. This contribution thus brings elements in favor of the causality of the effects on health. It also suggests that a decrease in air pollution levels may be followed by a decrease in adverse health effects:
- The atmospheric dispersion of pollutants depends on different parameters (wind, sunshine, local topology, temperature, rain, residence time of pollutants ...).
- The climatic changes induced by the increase of the greenhouse effect modify this dispersion of the pollutants,
- Measurement of local pollutants, but also basic measures,
- Atmospheric dispersion has three important events emission: artificial discharge, active natural release, suspension by passive flow wind transport in the atmosphere deposition on the ground and in the hydrosphere, dry or wet,
- Direct factors affecting the dispersion in the low layers weather conditions, wind speed, thermal stability of the atmosphere, turbulence, landscape structure, nature of the soil (roughness, vegetation cover, wet surfaces), obstacles, reliefs, etc.,
- Indirect factors affecting the dispersion in the low layers type of particles, heavy, light, reactive ... Source, geometric characteristics height, size, intensity, speed of ejection, quantity, temperature and composition of the rejection, position.
Its high lights the lack of scientific analysis of the situation, both on the definition of the study area and on the potential exposures of the population and the characterization of the latter. There remains a succession of findings leaving an impression of incompleteness in the analysis of the coherence and effectiveness of the actions. Finally, the article shows the difficulties of associating all the factors for a collective construction of objectives to be achieved in an obvious way the link between the exposure of people to particulate and gas pollution and their health effects or the mortalities.
The national companies Sonatrach, Sonelgaz and Direction of the environment wilaya de laghouat thank for the use of their sites and measuring equipment and calculation software (Phast).
[1] Kouidri, M.A., Mahi, D. (2018). Study and realization of an electrostatic precipitator device. Modelling, Measurement and Control C, 79(4): 235-241. https://doi.org/10.18280/mmc_c.790415
[2] Kouidri, M.A. (2018). Applications of high voltage in the field of electrostatic pollution control. Environmental study of an industrial station. Ph.D. thesis. University of Laghouat. Algeria.
[3] Rahal, F., Benharrats, N., Blond, N., Clappier, A., Ponche, J.L. (2014). Modelling of air pollution in the area of Algiers City, Algeria. Int. J. Environment and Pollution, 54(1): 32-58. https://doi.org/10.1504/IJEP.2014.064049
[4] Kouidri, M.A., Mahi, D., Hadjadj, A. (2015). Contribution to the depollution of the elements ejected by an energy production with the application of electro filter high voltage: Design of Electro filter multi-compartment. Electrical Engineering (ICEE), 4th International Conference Algeria, pp. 1-4. https://doi.org/10.1109/INTEE.2015.7416674
[5] Wilk, R.K. (2014). Syngaz as a reburning fuel for naturel gas combustion. Chemical and Process Engineering, 35(2): 181-190. https://doi.org/10.2478/cpe-2014-0014
[6] Arslanov, D.D., Spunei, M., Ngai, A.K.Y., Cristescu, S.M., Lindsay, I.D., Persijn, S.T., Boller, K.J., Harren, F.J.M. (2011). Rapid and sensitive trace gas detection with continuous wave optical parametric oscillator-based wavelength modulation spectroscopy. Applied Physics B, 103(1): 223-228. https://doi.org/10.1007/s00340-010-4242-0
[7] Baer, D.S., Paul, J.B., Gupta, M., O'Keefe, A. (2002). Sensitive absorption measurements in the near-infrared region using off-axis integrated-cavity-output spectroscopy. Applied Physics B, 75(2-3): 261-265. https://doi.org/10.1007/s00340-002-0971-z
[8] Benjamin, L., Marco, C., Polina, V., Jean-Pierre, C., Robert, T., Sophie, G. (2018). Evaluation of a new inference method for estimating ammonia volatilisation from multiple agronomic plots. Biogeosciences, 15(11): 3439-3460. https://doi.org/10.5194/bg-15-3439-2018
[9] Jacques, G. (2006). Introduction to experimental plans. Dunod, Revue Modulad, 34.
[10] Plackett, R.L., Burman, J.P. (1946). The design of optimum multifactorial experiments. Biometrika, 33(4): 305-325. https://doi.org/10.1093/biomet/33.4.305
[11] Jacques, G. (2006). Experiment plans for response surfaces. Dunod. Paris, Revue Modulad, 34: 74-113.
[12] Beekmann, M., Derognat, C. (2003). Monte Carlo uncertainty analysis of a regional-scale transport chemistry model constrained by measurements from the Atmospheric Pollution Over the Paris Area (ESQUIF) campaign. Journal of Geophysical Research, 23(D17): 10-1029. https://doi.org/10.1029/2003JD003391
[13] Chellali, F., Khellaf, A., Belouchrani, A., Recioui, A. (2011). A contribution in the actualization of wind map of Hassi R’mel Algeria. Renewable and Sustainable Energy Reviews, 15(2): 993-1002. https://doi.org/10.1016/j.rser.2010.11.025
[14] Brown, J., Graver, B., Gulbrandsen, E., Dugstad, A., Morland, B. (2014). Update of DNV recommended practice RP-J202 with focus on CO2 corrosion with impurities. Energy Procedia, 63: 2432-2441. https://doi.org/10.1016/j.egypro.2014.11.265
[15] Zmirou D, Touloumi G, Wojtyniak B, Ponka A, et al. (1997). Air pollution and daily admissions for chronic obstructive pulmonary disease in 6 European cities: results from the Aphea project. European Respiratory Journal, 10(5): 1064-71.
[16] Auvinen, A., Makelainen, I., Hakama, N., Castren, O., Pukkala, E., Reisbacka, H., Rytoomaa, T. (1998). Indoor radon exposure and risk of lung cancer: A nested case-control study. J Natl Cancer Inst, 90: 401-402.
[17] Aarnio, P., Yli-Tuomi, T., Kousa, A., Mäkelä, T., Hirsikko, A., Hämeri, K., Räisänen, M., Hillamo, R., Koskentalo, T., Jantunen, M. (2005). The concentrations and composition of and exposure to fine particles (PM2.5) in the Helsinki subway system. Atmospheric Environment, 39(28): 5059-5066. https://doi.org/10.1016/j.atmosenv.2005.05.012
[18] Acker, K., Möller, D., Marquardt, W., Brüggemann, E., Wieprecht, W., Auel, R., Kalaß, D. (1998). Atmospheric research program for studying changing emission patterns after German unification. Atmospheric Environment, 32(20): 3435-3443. https://doi.org/10.1016/S1352-2310(98)00041-7
[19] Akinaga, L.M.Y., Lichtenfels, A.J., Carvalho-Oliveira, R., Caldini, E.G., Dolhnikoff, M., Silva, L.F.F., De Siqueira Bueno, H.M., Pereira, L.A.A., Saldiva, P.H.N., Garcia, M.L.B. (2009). Effects of chronic exposure to air pollution from Sao Paulo city on coronary of Swiss mice, from birth to adulthood. Toxicological Pathology, 37(3): 306-314. https://doi.org/10.1177/0192623309332994