Effect of Calcination Temperature on the Morphology, Crystallinity, and Photocatalytic Activity of ZnO/TiO2 in Selenite Photoreduction from Aqueous Phase

A.K. Usman* | A. Aris | B.A. Labaran | M. Darwish | A.H. Jagaba
© 2022 IIETA. This article is published by IIETA and is licensed under the CC BY 4.0 license (http://creativecommons.org/licenses/by/4.0/).
OPEN ACCESS
In this study, ZnO/TiO2 was synthesized using the sol-gel method. The effect of calcination temperature was investigated on the morphology, crystal size, and influence on the photoreduction of selenite from the aqueous phase. The ZnO/TiO2 was calcined at 150 C, 350 C, and 500 C for 2 hours. The samples were characterized using SEM/EDX, XRD, and FT-IR for morphology/elemental composition, crystal structure/size, and functional group. The crystallite sizes were found to be 21.61 nm, 22.22 nm, and 24.80 nm for the temperatures, respectively. The composite morphology was found to be agglomerated granular particles that increase in agglomeration as the temperature increases. EDS results give the composition of Ti, Zn, and O2 in all samples, indicating the presence of ZnO and TiO2. XRD spectra were used to confirm the hexagonal and tetrahedral phase structure of the ZnO and TiO2. Photocatalysis experiment was conducted at pH 4 and 1 mg/L ZnO/TiO2 with 20 ppm initial concentration for 22 hrs under UV- irradiation. The catalyst calcined at 150 C showed 100% photoreduction of selenite to total selenium, while samples calcined at 350 C and 500 C showed 79% and 17%, respectively.
calcination temperature, characterization, crystallite size, photoactivity, selenite, total selenium, ZnO/TiO2
Selenium (Se) is a vital nutrient for human and animal health. It is an essential micronutrient with a daily body requirement range between 0.1 mg Se/kg to 1 mg Se/kg of body weight [1]. However, the intake of a high amount of Se poses adverse effects [2–7]. Selenosis is a human disease due to excessive Se intake characterized by fatigue, skin irritation, nail and hair loss, and nervous system disorder [8–10]. In addition, some studies indicated that extreme cases lead to loss of feeling and control of arms and legs [11]. Research conducted by a group of scientists in Italy linked an incidence of certain types of cancer and other neuro-disease with long- term consumption of water with high Se levels. [12–14]. Se is introduced to the environment through different sources, including mining, fossil fuel exploration, and agricultural activities [15]. The adverse effect of high Se intake through Se contaminated water necessitated the regulatory bodies to stipulate stringent guidelines to limit the concentration of Se in drinking water to safeguard public health. The United States Environmental Protection Agency (USEPA) pegs it to 50 µg Se/L [16] and the World Health Organisation at 40 µg Se/L [17].
Different researchers have used various technologies to treat Se contaminated water and wastewater, ranging from physical, chemical, and biological. However, these treatment technologies have some drawbacks, including huge waste disposal problems, high chemical cost, and the inhibitory effect of elemental Se formed on the microorganisms [15, 18]. Advanced Oxidation Processes (AOPs) have shown a significant advantage over the conventional treatment methods. These advantages include non-transfer of pollutants from one phase to another and no massive production of toxic sludge [19]. Several researchers have studied TiO2-based photocatalysis to remove selenium species from selenium contaminated wastewater [7, 15, 18, 20–24]. ZnO and TiO2 have proven to be the most widely and effective semiconductors used in photocatalysis. This is due to their low or non-toxicity, low cost, chemical stability, and high photoactivity [25–27]. One of the major setbacks of the photocatalysis technique for selenium removal from the aqueous phase is the recombination of the excited electrons and holes. This necessitates using organic hole scavengers, which are usually left partially untreated and can cause oxygen depletion in the receiving water bodies. A previous study by Usman et al. [28] synthesized ZnO/TiO2 and applied it successfully for the photoreduction of selenium species without using organic hole scavengers.
Calcination temperature plays a vital role in synthesizing a promising photocatalyst with good photoactivity. In addition, studies have shown how calcination temperature affects various semiconductors' structural morphology, crystallinity, and photocatalytic activity, especially in environmental remediation [10, 29–31].
In this study, we synthesized ZnO/TiO2 photocatalyst and calcined it at 150 C, 350 C, and 500 C for 2 hours. The resulting samples were characterized using the SEM/EDS, XRD, and FTIR. In addition, the three samples were tested for the photoreduction of selenite from the aqueous phase.
2.1 Materials
Zinc acetate dihydrate (99.8%), TiO2 Degussa P25 (99.9%), sodium selenite (Na2SeO3, ALDRICH), sodium bicarbonate (NaHCO3, BDH), sodium hydroxide (NaOH, LOBA chemie), and hydrochloric acid (HCL, LOBA chemie) were the chemicals used in this study. All chemicals used in the study are reagent grade. Deionized water was used throughout the study for sample and solution preparation.
2.2 ZnO/TiO2 synthesis and calcination
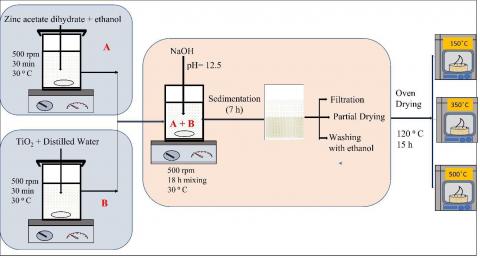
ZnO/TiO2 nanocatalyst was synthesized by the sol-gel method according to the procedure outlined by Usman et al [28]. ZnO/TiO2 was synthesized from commercial TiO2 powder, and zinc acetate dehydrate. TiO2 was oven-dried for 3 hours at 103 ℃ to remove some moisture. Both zinc acetate dehydrate and the TiO2 were then dissolved separately in ethanol and distilled water, respectively. Solution A (Zinc acetate dehydrate + ethanol) was then mixed with solution B (TiO2 + Distilled Water) in ratio of 1:1 ZnO:TiO2. The solution pH was raised to 12.5 and was stirred continuously at 500 rpm and 30 ̊C for 18 hours. The resulting solution was allowed to settle for 7 hours before decanting, washing and oven-drying at 120 ℃ for 15 hours. The produced photocatalyst was then calcined at 150 ℃, 350 ℃, and 500 ℃ for 2 hours in a muffle furnace. The final product was then cooled down in a desiccator and stored.
Figure 1. Synthesis and Calcination of ZnO/TiO2 nanoparticle Schematic
2.3 Characterisation
Different techniques were used to characterize the prepared nanocatalysts. First, the crystalline structures were studied with the help of Desktop XRD 2nd Gen D2 PHASER BRUKER for 2θ range of (20 to 90), 3.00 scan speed, and 0.03 ° sampling step size crystalline size was determined using Scherrer's Formula. The structural morphology and elemental composition were investigated and confirmed using the SEM/EDS (JEOL JSM-6610L). Thermo Scientific Nicolet iS10 spectrometer model recorded the FT-IR Spectrum of the ZnO/TiO2 nanocatalysts prepared at room temperature in the range of 400-4000 cm-1.
2.4 Photocatalysis experiment
Photocatalysis (PC) experiment was conducted in a 1-liter reactor. Synthetic selenite wastewater was prepared from sodium selenite reagents and distilled water. First, 1 g/L of ZnO/TiO2 dosage was suspended in a 20 ppm synthetic selenite [Se (IV)] wastewater solution at an initial pH of 4. For the first 30 min, the solution was kept in darkness to reach equilibrium, then subjected to UV Lamp (F15T8-BLB 15W, 315-400 nm and a maximum peak of 352 nm wavelength). The experiments were run for 22 hr each for the catalysts calcined at 150 ℃, 350 ℃, and 500 ℃. At given intervals of time, samples were collected from the running PC reactor and filtered using 0.2 µm filters (Allpure Biotechnology, UK). The filtered samples were analyzed using Sykam (Germany) ion chromatograph (IC) set-up for the selenite ions. The IC uses a conductivity detector for both cation and anion species analysis. The eluent used is composed of 1.3 mM NaCO3 and 2.0 mM NaHCO3 at a 0.8 ml/min flow rate. The Se species were analyzed using an anion separation column with specification ION A01 2.6 ˟ 150.
3.1 SEM/EDX: Morphology and elemental composition
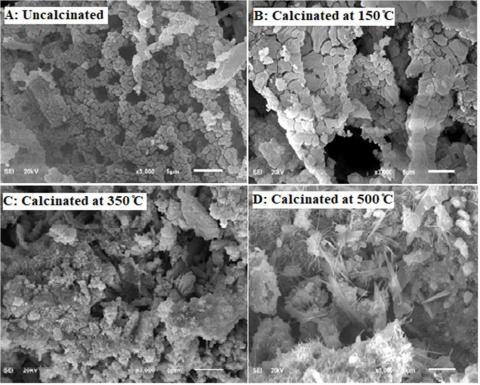
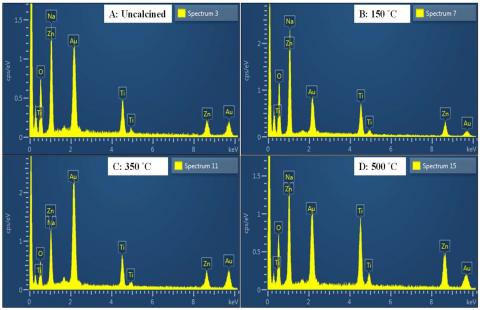
Figures 2 show the SEM of the ZnO/TiO2 synthesized and calcined at different temperatures. Figure 2 A[28] is the control which is the SEM image of the uncalcined nanocomposite. The morphology of the uncalcined sample consists of agglomerated granular particles. As the calcination temperature of the samples increased from 150 ℃, to 500 ℃ (Figures 2 B to 2 D), more agglomeration of the particles was observed, which indicates a relative increase in crystallinity and phase stability [32]. Parts of the sample calcined at 500 ℃ can be seen to have irregular nanostructure, which is a behaviour of ZnO and is mainly due to proneness to minimize the surface energy [33, 34]. EDS analysis was performed to determine the elemental composition of the ZnO/TiO2 nanocomposite samples. Figures 3 A to B show that Ti, Zn, and O2 were all present in the samples confirming the presence of TiO2 and ZnO. However, EDS analysis is rather more qualitative than quantitative due to its relatively large systemic errors [35], hence the need for other characterization techniques like XRD.
Figure 2. SEM Micrograph of ZnO/TiO2 A: Uncalcined, B: calcined at 150 ℃, C: calcined at 350 ℃, and D: calcined at 500 ℃
Figure 3. EDS Analysis for ZnO/TiO2 ; A. Uncalcined, B. Calcined at 150 ℃, C. Calcined at 350 ℃, and D. Calcined at 500 ℃
3.2 FTIR: Functional group
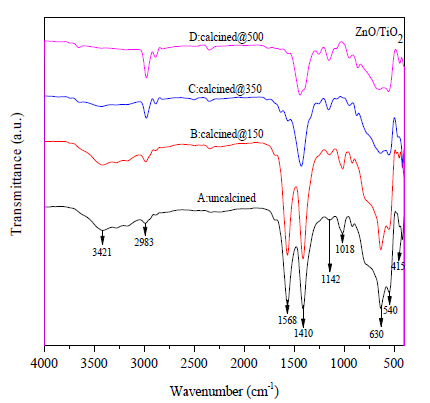
In Figure 4, various functional groups found in the nanocatalyst samples were analyzed using FTIR spectroscopy. The broad peaks at 3421 cm-1 wavelength are attributed to the O-H stretching vibrations due to moisture on the nanocatalysts' surfaces [28, 30, 36, 37]. As the calcination increased to 500 ℃, the peaks became weaker and broader, which implies that a certain amount of the O-H groups were removed from the surfaces of the catalysts due to the calcination [37]. The peaks that appear in the range of 415 cm -1 – 630 cm -1 are significant peaks that confirm the ZnO/TiO2 nanocomposite [28]. The peak range of 400 cm -1 – 550 cm -1 is attributed to the Zn-O stretching mode [30, 38, 39]. Ti-O-O has been found in 600 cm -1 to 700 cm -1 stretching vibrations. Therefore, the peaks observed in that range in Figure 4 confirm the presence of TiO2. The FITR analysis confirms the presence of ZnO/TiO2 hybrid formation in all samples; it also shows that an increase in calcination temperature increases the dryness and pureness of the composite catalysts formed.
Figure 4. FTIR spectra of the ZnO/TiO2 nanocomposite synthesized and calcinated at different temperatures; A: Uncalcined, B: Calcined at 150 ℃, C: Calcined at 350 ℃, and D: Calcined at 500 ℃
3.3 XDR analysis: Crystallite size, phase composition
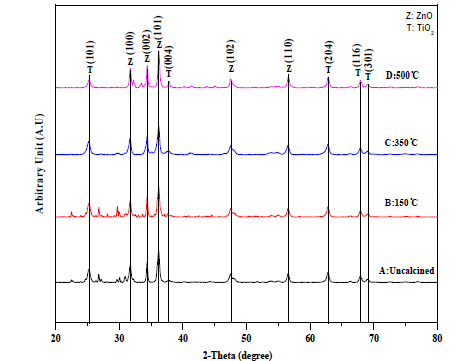
The various XRD pattern of all the calcined samples of ZnO/TiO2 is shown in Figure 5. All samples exhibited the same peaks at 2θ = 31.73 (100), 34.37 (002), 36.21 (101), 47.48 (102), and 56.54 (110), which were matched and in good agreement with a typical hexagonal ZnO structure (ICSD Collection Code 034477). The peaks at 2θ = 25.27 (101), 37.69 (004), and 68.59 (116) were matched with tetragonal anatase TiO2 (ICSD Collection Code 202242). The peaks at 2θ = 62.73 (116) and 69.01 were matched with traces of tetragonal rutile TiO2. The presence of both peaks of ZnO and TiO2 in the XRD spectra of all catalysts confirms the formation of the ZnO/TiO2 hybrid. It is observed that the sharpness of the peaks increased with an increase in calcination temperature, which is attributed to an increase in crystallinity; this trend is also observed and corroborated by several researchers [29, 30, 32, 36, 40, 41]. The average crystallite sizes were calculated using the Scherrer's for mula (Equation 1) [40] and were found to be 21.61 nm, 22.22 nm, and 24.80 nm for the nanocatalysts calcined at 150 ̊C, 350 ̊C, and 500 ̊C. It can be noted that increase in temperature produced larger crystallite size; this may be attributed to the removal of defects and irregularities among others, from the crystals during the prolonged heat treatment [40]. Though no phase transformation was noticed, the calcination temperature is seemed to produce a more well- defined crystalline phase.
$D=\frac{K \lambda}{\beta \cos \theta}$ (1)
Figure 5. XRD spectra of the ZnO/TiO2 nanocomposite synthesized and calcinated at different temperatures; A: Uncalcined, B: Calcined at 150 ℃, C: Calcined at 350 ℃, and D: Calcined at 500 ℃
3.4 Effect of calcination temperature on the photocatalytic reduction of selenite by ZnO/TiO2 nanoparticle
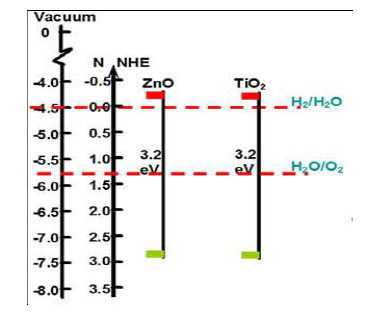
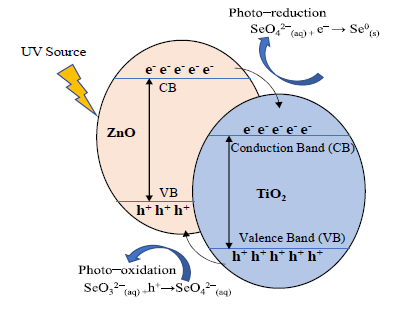
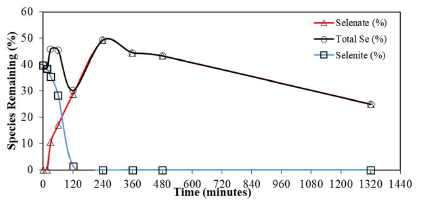
The effectiveness of the calcined catalysts was tested for the photoreduction of selenite from the aqueous phase. It is worth noting from Figures 7a to 7c that the selenite is initially oxidized to selenate before reduction to elemental selenium; equations 2 & 3 give the complete oxidation and reduction reactions involved in the photocatalytic conversion of selenite to elemental selenium. The detail of the photoreduction process of selenite to elemental selenium is reported elsewhere by Usman et al. [28]. The conduction band edges of TiO2 and ZnO are known to be -4.21 eV and -4.19 eV [42, 43], which makes the conduction band of ZnO a little bit higher than that of TiO2 as shown in Figure 6a. Hence, electrons move from the conduction band of ZnO to the conduction band of TiO2, which helps in the reduction process, while holes move from the valence band of TiO2 to the valence band of ZnO which helps in the oxidation process as shown in Figure 6b. The wavelengths at which all the ZnO/TiO2 samples absorbs light were determined using the UV-vis spectrophotometer. The band gaps of all the calcined samples were determined through Tauc plot method [44]. Table 1 gives the maximum wavelength and band gap variation with calcination temperature. It is noticed that as the calcination temperature increases from 150 to 500 ̊C, the band gap decreases from 2.9 to 2.55 eV, this might be due to the increase in size of the nanoparticle which reduces the photoactivity of the nanocatalyst. The decrease in the photoactivity might also be attributed to the moving away of the band gap of the hybrid from the pristine active ZnO and TiO2 of 3.2 eV.
Oxi: $\mathrm{SeO}_{3^{2-}(\mathrm{aq})}+\mathrm{H}_2 \mathrm{O} \stackrel{\mathrm{ZnO}^2 \mathrm{TiO}_2}{\longrightarrow} \mathrm{SeO}_4^{2-(\mathrm{aq})}+2 \mathrm{H}^{++}2 \mathrm{e}^{-}$ (2)
Red: $\mathrm{SeO}_4^{2-(\mathrm{aq})}+6 \mathrm{e}^{-}+8 \mathrm{H}^{+} \stackrel{\mathrm{ZnO}^2 / \mathrm{TiO}_2}{\longrightarrow} \mathrm{Se}^0+4 \mathrm{H}_2 \mathrm{O}$ (3)
Figure 6a. Energy Band Structures of ZnO and TiO2 [45]
Figure 6b. Mechanism of Selenite Conversion to Elemental Selenium
Table 1. Band gap and Wavelength Variation with Calcination Temperature
|
Calcination Temperature (℃) |
Wavelength (nm) |
Band Gap (eV) |
|
Uncalcined |
370.10 |
2.88 |
|
150 |
370.10 |
2.90 |
|
350 |
371.76 |
2.76 |
|
500 |
373.13 |
2.55 |
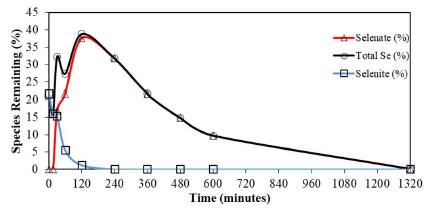
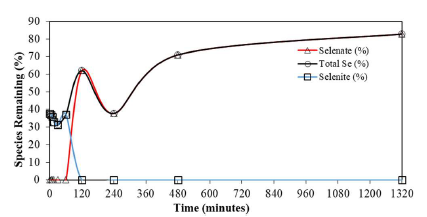
Figure 7a shows the photocatalysis trend for removing 20 ppm selenite using ZnO/TiO2 photocatalyst calcined at 150 ℃. The results show gradual disappearance of selenite between 0 and 4 hours of irradiation accompanied by increase in the concentration of selenate because of oxidation from selenite to selenate. After near complete disappearance of selenite, selenate concentratation starts to go down leading to a complete removal after 22 hours. A change in color from milky-white to pinkish red confirms the photoreduction of the produced selenate to elemental selenium. Figure 7b, on the other hand, shows the photocatalysis trend for the removal of 20 ppm selenite using ZnO/TiO2 photocatalyst calcined at 350 ̊C. Slower conversion of selenite to selenate was observed for the photocatalyst calcined at 350 ̊C compared to that calcined at 150 ̊C as a result of low adsorption of selenite. This can be attributed to the increase in the crystallinity of the photocatalyst which decreases the surface area as the calcination temperature is increased from 150℃ to 350℃ as discussed in Section 3.1 and 3.3. Despite this slower rate of adsorption, selenite still disappeared within 2 hours as shown in Figure 7b. However, photoreduction of the produced selenate to elemental selenium was slower which might be as a result of drop in the number of active sites due to the increase in the crystallinity resulting from rise in the calcination temperature. About 25% of the produced selenate resulting from the oxidation of selenite still remains in the system after 22 hr of photoreduction. This represents about 75% photoreduction of the total selenium (added initially as selenite) to elemental selenium as shown in Figure 7b. Further decrease in the photocatalytic reduction of selenite was observed when the calcination temperature was raised to 500 ̊C, as shown in Figure 7c. Figure 7c shows that only 17% photoreduction of selenite was achieved using ZnO/TiO2 photocatalyst calcined at 500 ℃. It is worth noting that in Figures 7a, 7b, and 7c, selenite is completely oxidized to selenate. The difference is in the photoreaction of the produced selenate to elemental selenium which may be due to the decrease in the surface area resulting from more intense heat, which tends to collapse the pores. Furthermore, higher crystallinity due to higher temperatures increases the chances of transforming Anatase to Rutile TiO2, which is less active [46]. Research output by Akihiko Kudo and Yugo Miseki [31] shows that increase in crystallite size is accompanied by a decrease in the surface area, thereby reducing the active sites on the photocatalyst. Thus, the overall drop in selenite photoreduction efficiency is due to the increase in calcination temperature beyond 150 ℃.
Figure 7a. Photoreduction of selenite by ZnO/TiO2 calcined at 150 ℃ (20 ppm selenite, pH 4)
Figure 7b. Photoreduction of selenite by ZnO/TiO2 calcined at 350 ℃ (20 ppm selenite, pH 4)
Figure 7c. Photoreduction of selenite by ZnO/TiO2 calcined at 500 ℃ (20 ppm selenite, pH 4)
This study successfully synthesized ZnO/TiO2 photocatalysts by the sol-gel method and subjected them to different temperatures ranging from 150 ̊C to 500 ̊C. The calcined samples were characterized by SEM/EDS, FTIR, and XRD techniques for morphology/elemental composition, functional group, and crystalline structure determination of the composite. An increase in calcination temperature was found to increase the agglomeration of the granular composite. The crystallite sizes were calculated to be 21.61 nm, 22.22 nm, and 24.80 nm for ZnO/TiO2 photocatalysts calcined at 150 ̊C, 350 ̊C, and 500 ̊C respectively. Increase in the calcination temperature was found to increase the crystallite size, and purity of the catalyst through possible elimination of irregularities and defects. 100%, 75%, and 17% total selenium removal (added as selenite) were achieved for ZnO/TiO2 photocatalysts calcined at 150 ̊C, 350 ̊C, 500 ̊C respectively. This shows that with careful selection of calcination temperature and other appropriate operating parameters, ZnO/TiO2 photocatalysis can be an efficient technology for the removal of selenite and other oxyanions from aqueous phase.
[1] Gonzalez, C. M., Hernandez, J., Peralta-Videa, J. R., Botez, C. E., Parsons, J. G., Gardea-Torresdey, J. L. (2012). Sorption kinetic study of selenite and selenate onto a high and low pressure aged iron oxide nanomaterial. Journal of Hazardous Materials, 211–212, 138–145. https://doi.org/10.1016/J.JHAZMAT.2011.08.023
[2] Aman, N., Mishra, T., Hait, J., Jana, R. K. (2011). Simultaneous photoreductive removal of copper (II) and selenium (IV) under visible light over spherical binary oxide photocatalyst. Journal of Hazardous Materials, 186(1), 360–366. https://doi.org/10.1016/j.jhazmat.2010.11.001
[3] Bleiman, N., Mishael, Y. G. (2010). Selenium removal from drinking water by adsorption to chitosan–clay composites and oxides: Batch and columns tests. Journal of Hazardous Materials, 183(1–3), 590–595. https://doi.org/10.1016/j.jhazmat.2010.07.065
[4] Geoffroy, N., Demopoulos, G. P. (2011). The elimination of selenium(IV) from aqueous solution by precipitation with sodium sulfide. Journal of Hazardous Materials, 185(1), 148–154. https://doi.org/10.1016/j.jhazmat.2010.09.009
[5] Hu, X., Wang, F., Hanson, M. L. (2009). Selenium concentration, speciation and behavior in surface waters of the Canadian prairies. Science of The Total Environment, 407(22), 5869–5876. https://doi.org/10.1016/j.scitotenv.2009.08.001
[6] Torres, J., Pintos, V., Gonzatto, L., Domínguez, S., Kremer, C., Kremer, E. (2011). Selenium chemical speciation in natural waters: Protonation and complexation behavior of selenite and selenate in the presence of environmentally relevant cations. Chemical Geology, 288(1–2), 32–38. https://doi.org/10.1016/J.CHEMGEO.2011.06.015
[7] Labaran, B. A., Vohra, M. S. (2018). Competitive adsorption of selenite [se(IV)], selenate [se(VI)] and selenocyanate [seCN–] species onto TiO2: Experimental findings and surface complexation modelling. Desalination and Water Treatment, 124, 267–278. https://doi.org/10.5004/dwt.2018.22742
[8] Prabhu, K. S., Lei, X. G. (2016). Selenium. Advances in Nutrition, 7(2), 415–417. https://doi.org/10.3945/an.115.010785
[9] Hwang, S. W., Lee, H. J., Suck Suh, K., Kim, S. T., Park, S. W., Hur, D. Y., Lee, D., Seo, J. K., Sung, H. S. (2011). Changes in murine hair with dietary selenium excess or deficiency. Experimental Dermatology, 20(4), 367–369. https://doi.org/10.1111/j.1600-0625.2010.01207.x
[10] Fuziki, M. E. K., Brackmann, R., Dias, D. T., Tusset, A. M., Specchia, S., Lenzi, G. G. (2021). Effects of synthesis parameters on the properties and photocatalytic activity of the magnetic catalyst TiO2/CoFe2O4 applied to selenium photoreduction. Journal of Water Process Engineering, 42.https://doi.org/10.1016/j.jwpe.2021.102163
[11] Qi, Z., Liu, R., Joshi, T. P., Peng, J., Qu, J. (2021). Highly efficient removal of selenite by electrolysis-assisted nano-zerovalent iron (nZVI): Implication for corrosion and reduction. Chemical Engineering Journal, 405. https://doi.org/10.1016/j.cej.2020.126564
[12] Vinceti, M., Vicentini, M., Wise, L. A., Sacchettini, C., Malagoli, C., Ballotari, P., Filippini, T., Malavolti, M., Rossi, P. G. (2018). Cancer incidence following long- term consumption of drinking water with high inorganic selenium content. Science of The Total Environment, 635, 390–396. https://doi.org/10.1016/j.scitotenv.2018.04.097
[13] Vinceti, M., Bonvicini, F., Rothman, K. J., Vescovi, L., Wang, F. (2010). The relation between amyotrophic lateral sclerosis and inorganic selenium in drinking water: a population-based case-control study. Environmental Health, 9(1), 77. https://doi.org/10.1186/1476-069X-9-77
[14] Vinceti, M., Ballotari, P., Steinmaus, C., Malagoli, C., Luberto, F., Malavolti, M., Rossi, P. G. (2016). Long- term mortality patterns in a residential cohort exposed to inorganic selenium in drinking water. Environmental Research, 150, 348–356. https://doi.org/10.1016/j.envres.2016.06.009
[15] Labaran, B. A., Vohra, M. S. (2014). Photocatalytic removal of selenite and selenate species: Effect of EDTA and other process variables. Environmental Technology (United Kingdom), 35(9), 1091–1100. https://doi.org/10.1080/09593330.2013.861857
[16] USEPA. (2003). Update on USEPA’s drinking water regulations. In Journal / American Water Works Association (Vol. 95, Issue 3, pp. 57–68). https://doi.org/10.1002/j.1551-8833.2003.tb10314.x
[17] WHO. (2003). English only Selenium in Drinking-water Background document for development of WHO Guidelines for Drinking-water Quality (Vol. 2).
[18] Nguyen, V. N. H., Beydoun, D., Amal, R. (2005). Photocatalytic reduction of selenite and selenate using TiO2 photocatalyst. Journal of Photochemistry and Photobiology A: Chemistry, 171(2), 113–120. https://doi.org/10.1016/J.JPHOTOCHEM.2004.09.015
[19] Mishra, N. S., Reddy, R., Kuila, A., Rani, A., Mukherjee, P., Nawaz, A., Pichiah, S. (2017). A review on advanced oxidation processes for effective water treatment. Current World Environment, 12(3), 470.
[20] Tan, T., Beydoun, D., Amal, R., Nguyen, V. N. H., Beydoun, D., Amal, R. (2003). Effects of organic hole scavengers on the photocatalytic reduction of selenium anions. Journal of Photochemistry and Photobiology A: Chemistry, 159(3), 273–280. https://doi.org/10.1016/S1010-6030(03)00171-0
[21] Tan, T. T. Y., Beydoun, D., Amal, R. (2003). Photocatalytic reduction of Se(VI) in aqueous solutions in UV/TiO2 system: Importance of optimum ratio of reactants on TiO2 surface. Journal of Molecular Catalysis A: Chemical, 202(1–2), 73–85. https://doi.org/10.1016/S1381-1169(03)00205-X
[22] Vohra, M. S., Al-Suwaiyan, M. S., Essa, M. H., Chowdhury, M. M. I., Rahman, M. M., Labaran, B. A. (2016). Application of Solar Photocatalysis and Solar Photo-Fenton Processes for the Removal of Some Critical Charged Pollutants: Mineralization Trends and Formation of Reaction Intermediates. Arabian Journal for Science and Engineering, 41(10), 3877–3887. https://doi.org/10.1007/s13369-015-2021-2
[23] Sanuki, S., Shako, K., Nagaoka, S., Majima, H. (2000). Photocatalytic reduction of Se ions using suspended anatase powders. Materials Transactions, JIM, 41(7), 799–805. https://doi.org/10.2320/MATERTRANS1989.41.799
[24] Labaran, B. A., Vohra, M. S. (2017). Solar Photocatalytic Removal of Selenite, Selenate, and Selenocyanate Species; Solar Photocatalytic Removal of Selenite, Selenate, and Selenocyanate Species. CSAWAC, 45(10). https://doi.org/10.1002/clen.201600268
[25] Abdullah, H., Khan, M. M. R., Ong, H. R., Yaakob, Z. (2017). Modified TiO2 photocatalyst for CO2 photocatalytic reduction: An overview. Journal of CO2 Utilization, 22, 15-32. https://doi.org/https://doi.org/10.1016/j.jcou.2017.08.004
[26] Luo, C., Ren, X., Dai, Z., Zhang, Y., Qi, X., Pan, C. (2017). Present Perspectives of Advanced Characterization Techniques in TiO2-Based Photocatalysts. ACS Applied Materials & Interfaces, 9(28), 23265–23286. https://doi.org/10.1021/acsami.7b00496
[27] Ishchenko, O. M., Rogé, V., Lamblin, G., Lenoble, D. (2016). TiO2- and ZnO-Based Materials for Photocatalysis: Material Properties, Device Architecture and Emerging Concepts. In Semiconductor Photocatalysis - Materials, Mechanisms and Applications. InTechOpen. https://doi.org/10.5772/62774
[28] Usman, A. K., Aris, A. B., Labaran, B. A. (2022). Eliminating the need for organic hole scavenger in the photoreduction of selenite and selenate from aqueous phase. DESALINATION AND WATER TREATMENT, 247, 206–215. https://doi.org/10.5004/dwt.2022.28077
[29] Park, G. C., Seo, T. Y., Park, C. H., Lim, J. H., Joo, J. (2017). Effects of Calcination Temperature on Morphology, Microstructure, and Photocatalytic Performance of TiO2 Mesocrystals. Industrial & Engineering Chemistry Research, 56(29), 8235–8240. https://doi.org/10.1021/acs.iecr.7b01920
[30] Ali, W., Ullah, H., Zada, A., Alamgir, M. K., Muhammad, W., Ahmad, M. J., Nadhman, A. (2018). Effect of calcination temperature on the photoactivities of ZnO/SnO2 nanocomposites for the degradation of methyl orange. Materials Chemistry and Physics, 213, 259–266. https://doi.org/10.1016/j.matchemphys.2018.04.015
[31] Kudo, A., Miseki, Y. (2009). Heterogeneous photocatalyst materials for water splitting. Chemical Society Reviews, 38(1), 253–278.
[32] Ashraf, R., Riaz, S., Kayani, Z. N., Naseem, S. (2015). Effect of Calcination on Properties of ZnO Nanoparticles. Materials Today: Proceedings, 2(10, Part B), 5468–5472. https://doi.org/https://doi.org/10.1016/j.matpr.2015.11.0 71
[33] Pudukudy, M., Hetieqa, A., Yaakob, Z. (2014). Synthesis, characterization and photocatalytic activity of annealing dependent quasi spherical and capsule like ZnO nanostructures. Applied Surface Science, 319, 221– 229. https://doi.org/10.1016/j.apsusc.2014.07.050
[34] Raoufi, D. (2013). Synthesis and microstructural properties of ZnO nanoparticles prepared by precipitation method. Renewable Energy, 50, 932–937. https://doi.org/10.1016/j.renene.2012.08.076
[35] Wang, J., Mi, W., Tian, J., Dai, J., Wang, X., Liu, X. (2013). Effect of calcinations of TiO2/ZnO composite powder at high temperature on photodegradation of methyl orange. Composites Part B: Engineering, 45(1), 758–767. https://doi.org/10.1016/j.compositesb.2012.09.053
[36] Menon, N. G., Tatiparti, S. S. V, Mukherji, S. (2019). Synthesis, characterization and photocatalytic activity evaluation of TiO2 – ZnO nanocomposites: Elucidating effect of varying Ti:Zn molar ratio. Colloids and Surfaces A: Physicochemical and Engineering Aspects, 565, 47-58. https://doi.org/https://doi.org/10.1016/j.colsurfa.2018.12.053
[37] Chen, Y.-F., Lee, C.-Y., Yeng, M.-Y., Chiu, H.-T. (2003). The effect of calcination temperature on the crystallinity of TiO2 nanopowders. Journal of Crystal Growth, 247(3–4), 363–370. https://doi.org/10.1016/S0022-0248(02)01938-3
[38] Zamani, M., Rostami, M., Aghajanzadeh, M., Kheiri Manjili, H., Rostamizadeh, K., Danafar, H. (2018). Mesoporous titanium dioxide@ zinc oxide–graphene oxide nanocarriers for colon-specific drug delivery. Journal of Materials Science, 53(3), 1634–1645. https://doi.org/10.1007/s10853-017-1673-6
[39] Heena Khan, S., R, S., Pathak, B., Fulekar, M. H. (2015). Photocatalytic degradation of organophosphate pesticides (Chlorpyrifos) using synthesized zinc oxide nanoparticle by membrane filtration reactor under UV irradiation. Frontiers in Nanoscience and Nanotechnology, 1(1), 23–27. https://doi.org/10.15761/FNN.1000105
[40] Saikumari, N., Dev, S. M., Dev, S. A. (2021). Effect of calcination temperature on the properties and applications of bio extract mediated titania nano particles. Scientific Reports, 11(1), 1734. https://doi.org/10.1038/s41598-021-80997-z
[41] Kim, M. G., Kang, J. M., Lee, J. E., Kim, K. S., Kim, K. H., Cho, M., Lee, S. G. (2021). Effects of Calcination Temperature on the Phase Composition, Photocatalytic Degradation, and Virucidal Activities of TiO2 Nanoparticles. ACS Omega, 6(16), 10668–10678. https://doi.org/10.1021/acsomega.1c00043
[42] Xu, Y., Schoonen, M. A. A. (2000). The absolute energy positions of conduction and valence bands of selected semiconducting minerals. American Mineralogist, 85(3– 4), 543–556. https://doi.org/10.2138/am-2000-0416
[43] Wang, N., Li, X., Wang, Y., Hou, Y., Zou, X., Chen, G. (2008). Synthesis of ZnO/TiO2 nanotube composite film by a two-step route. Materials Letters, 62(21–22), 3691– 3693. https://doi.org/10.1016/j.matlet.2008.04.052
[44] Singh H., Rajput, J. K. (2020). Effect of calcination temperature on magnetic, structural, thermal and optical properties of BFO-T nanoparticles. SN Applied Sciences, 2(8), 1322. https://doi.org/10.1007/s42452-020-3140-2
[45] Li, D., Jiang, X., Zhang, Y., Zhang, B., Pan, C. (2013). A novel route to ZnO/TiO 2 heterojunction composite fibers. Journal of Materials Research, 28(3), 507–512. https://doi.org/10.1557/jmr.2012.282
[46] Luttrell, T., Halpegamage, S., Tao, J., Kramer, A., Sutter, E., & Batzill, M. (2014). Why is anatase a better photocatalyst than rutile? - Model studies on epitaxial TiO2 films. Scientific Reports, 4(1), 4043. https://doi.org/10.1038/srep04043