M. Dadvand* | O. Savadogo
© 2022 IIETA. This article is published by IIETA and is licensed under the CC BY 4.0 license (http://creativecommons.org/licenses/by/4.0/).
OPEN ACCESS
The electrochemical corrosion and mechanical properties of direct current and pulsed reverse current electrodeposited nickel and nickel-tungsten were investigated by using cyclic polarization measurement and nano-indentation techniques. Direct and pulsed reverse current electrodeposited nickel-tungsten coatings revealed a significant higher resistance to pitting corrosion when compared to direct and pulsed reverse current deposited nickel. Furthermore, pulsed reverse current electrodeposited nickel-tungsten displayed the most noble corrosion potential and higher corrosion resistance compared to direct current electrodeposited nickel-tungsten. This was attributed to the more nano- crystalline structure of the pulsed-reverse current deposited coatings when compared to that of the direct current electrodeposited nickel-tungsten. The average modulus for both direct and pulsed reverse current deposited nickel-tungsten were found to be similar but the average hardness of direct current deposited nickel-tungsten was slightly higher than that of pulsed reverse current deposited nickel-tungsten. This was attributed to the higher tungsten content (35 wt.%) in the direct current deposited nickel-tungsten coating compared to that (25 wt.%) in the pulsed reverse current deposited nickel-tungsten and is supported by our energy dispersive X-ray spectroscopy results.
Nickel-tungsten coating, direct current, pulsed reverse current, electrodeposition, cyclic polarization
Electrochemical deposition methods have been widely used to produce various coatings of nickel (Ni) alloys such as nickel-tungsten (NiW) in various engineering applications due to their simplicity and affordability [1]. In recent years, pulsed reverse current (PRC) electrodeposition method has gained considerable interest owing to its unique mechanical and corrosion properties. PRC technique has unique ability to produce coatings with greater uniformity, and finer grain size than the coatings obtained by using direct current (DC).
It has been also reported that deposits with high tungsten content produced by means of PRC are superior with respect to being crack-free with lower defects compared to those produced by DC with the same tungsten content. Formation of residual tensile stress as a result of hydrogen evolution over the cathode was reported as the main cause for cracking of DC deposited NiW with high tungsten content, whereas in PRC technique, the reverse or anodic current consumes evolved hydrogen through its re-oxidation on the surface of cathode [1-3].
In general, electrodeposited NiW coatings have demonstrated high hardness and high wear resistance. Therefore, improving their corrosion performance in various environments is in high interest. It is also imperative to investigate their corrosion behavior as well as corrosion mechanism and correlate them with their microstructures [1-6]. There are a limited number of published articles about electrochemical investigation on corrosion behavior of electrodeposited NiW alloys [7–12] Majority of such studies are on investigation of general corrosion behavior of NiW alloys and their composites using potentiodynamic polarization technique in various corrosive environments and there is also not much information available regarding their pitting behavior [7-8, 13-17]. For example, Sriraman et al. [7] studied the influence of the tungsten content of the coatings on the corrosion resistance of the Ni-W and Ni-W-Fe alloys in 3.5 wt. % NaCl and sulfuric acid solution using polarization and electrochemical impedance spectroscopy techniques. They found that Ni-W with 7.54 at.%. tungsten and Ni-W-Fe with 9.20 at.% tungsten had the highest corrosion resistance.
Yao et al. [13] investigated the general corrosion behavior of NiW-SiC composite by using anodic polarization and electrochemical impedance spectroscopy (EIS) techniques. They reported that the inclusion of SiC nano-particulates into the NiW alloy matrix increased the general corrosion resistance. The enhancement of corrosion resistance was explained by physical barrier behavior of the SiC particles to the corrosion process. Hosseini et al. [14] reported the corrosion characteristics of DC electrodeposited NiW-SiC composite coatings by using mass loss and electrochemical measurements, including open circuit potential, electrochemical impedance spectroscopy and potentiodynamic polarization in a 3.5 wt. % NaCl solution. The results showedthattheaddition of SiC particle to the deposition bath of NiW significantly increased the corrosion resistance. To the best of our knowledge, no research has been reported to investigate the pitting corrosion behavior of pulsed reverse (PRC) electrodeposited nanostructure NiW and to compare them withthose of electrodeposited by DC current waveform.
Pitting corrosion is a localized form of corrosion that occurs through localized acceleration of dissolution of the material. The formation of passive films on many engineering metallic materials reduces the corrosion rate substantially [4-5]. However, the passive films can be broken locally resulting in accelerated dissolution of the underneath metal. The tendency of materials towards the localized corrosion in a corrosive environment can be evaluated by using cyclic polarization (CPP) technique. During the cyclic polarization test, the applied potential to the specimen is swept linearly in anodic direction [4–6]. The direction of the sweep is then reversed (cathodic) once the measured current density approaches a certain value. The formation and the size of a hysteresis represent the pitting formation and the tendency of the specimen towards the pitting, respectively. In CPP technique, pitting or breakdown potential (Ep or Eb), protection or re-passivation potential (Eprot or Erep), passivation current density (ip), anodic to cathodic transition potential, hysteresis, and anodic nose or active- passive transition potential can be used to evaluate the corrosion behavior of materials [4-5]. Pitting, re-passivation, andanodic to cathodic transition potentials are based on the difference in corrosion potential (Ecorr). In fact, the most important parameters for investigating of pitting resistance are the relative locations of pitting and protection potentials to corrosion potential.
In this work, we report for the first time on the pitting corrosion behavior of DC and PRC electrodeposited Ni and NiW coatings using cyclic polarization as well as their mechanical properties by nano-indentation technique.
2.1 Electrolyte composition
The $\mathrm{Ni}$ electrodeposition electrolyte was composed of nickel sulfate $\left(\mathrm{NiSO}_{4} .6 \mathrm{H}_{2} \mathrm{O}\right)$ as a source of nickel ions, citric acid as complexing agent, o- benzoic sulfimide (sodium saccharin, $\mathrm{C}_{7} \mathrm{H}_{5} \mathrm{NO}_{3} \mathrm{~S}$ ) as stress reducer, propargyloxopropane- 2,3-dihydroxy as a grain refiner and brightener, and DuPont Capstone fluorosurfactant FS-63 as a wetting agent. The $\mathrm{NiW}$ electrodeposition bath was prepared by adding sodium tungstate dehydrate $\left(\mathrm{Na}_{2} \mathrm{WO}_{4} \cdot 2 \mathrm{H}_{2} \mathrm{O}\right)$ as a source of tungstate ions into $\mathrm{Ni}$ electrodeposition bath. The composition and operating conditions used for electrodeposition condition of NiW is summarized in Table $1 .$
In this formulation, citric acid is used as a complexing agent to form complexes with both tungstate $\left(\mathrm{WO}_{4}^{2-}\right)$ and nickel $\left(\mathrm{Ni}^{2+}\right)$ ions to prevent direct reaction between nickel and tungstate ions. Such direct reaction could result in the formation of an insoluble nickel tungstate compound in the plating bath [18-19]. Sodium saccharin was used as a stress removal agent to reduce the accumulated stress within the electrodeposited coating [20].
We used propargyl-oxo-propane-2, 3-dihydroxy as a grain refiner and brightening agent to produce uniform deposit with mirror-finish surface. This compound increases the active nucleation sites on the electrode surface leading to the refinement of the grain size of the nickel [21]. Finally we used, Capstone fluoro-surfactant $\mathrm{FS}-63$ (DuPont) as a wetting agent to facilitate separation of adsorbed hydrogen gas bubbles covering the electrode surface during the electrodeposition process [22].
2.2 Substrate preparation
The surface of brass substrates was degreased, activated and rinsed prior to electrodeposition process. Substrates were immersed into $50 \mathrm{~g} \cdot \mathrm{L}^{-1}$ alkaline soap solution (TEC1001; Technic Inc.) at temperature of about $50^{\circ} \mathrm{C}$ for approximately 1 min followed by rinsing with deionized (DI) water. The substrate was then activated by immersing into dilute sulfuric acid $(10 \% \mathrm{v} / \mathrm{v})$ at room temperature for about 10 sec followed by rinsing with DI water. In order to determine the cleanliness of the substrate, water break test was performed. In this testing protocol, the substrate was gently rinsed with deionized water following the final rinse step. The substrate was considered clean if the water completely wets the surface.
2.3 Electrodeposition process
The electrodeposition setup was composed of an electrodeposition tank containing electrolyte, a pump (Flo King Filter System Inc.) to provide adequate agitation, an anode made of platinized titanium mesh, a cathode made of brass as a substrate being electrodeposited, and a pulsed reverse plating power supply. The electrodeposition bath was placed inside a water circulating bath operating at $60^{\circ} \mathrm{C}$ temperature. A typical composition of the chemical bath for the electrodeposition of Ni or NiW is shown in table 1.
Table 1. Nickel (Ni) and Nickel-tungsten (NiW) Electrodeposition electrolyte composition and components concentration
|
Chemical Compound or operating condition |
Concentration |
|
Nickel sulfate |
29.5-30 g.L-1 |
|
Sodium tungstate for NiW electrodeposition |
58-60 g.L-1 |
|
Citric acid |
63-67 g.L-1 |
|
Ammonia |
58 ml.L-1 |
|
Sulfuric acid |
As needed |
|
Propargyl-oxo propane-2,3- dihydroxy |
0.9-1 g.L-1 |
|
DuPontTM Capstone® Fluoro-surfactant FS- 63 |
1.8-2 g.L-1 |
|
Sodium saccharin |
0.5-1 g.L-1 |
|
Polyethyleneimine branched, Mn~600 by GPC |
0.5 g.L-1 |
|
Experimental parameters |
|
|
pH |
7.8-8.0 |
|
Temperature |
58-61${ }^{\circ} \mathrm{C}$ |
|
Time |
30 min |
Figure 1 represents the general schematic diagram of electrodeposition setup used for electrodeposition. A pulse reverse power supply (Model pe8005, Plating Electronic GmbH, Germany) was used to apply direct current (DC) and pulse reverse current (PRC) waveforms to the electrodeposition cell. Accordingly, Direct Current (DC) electrodeposited Nickel named DC-Ni and Direct Current (DC) electrodeposited Nickel –Tungsten (NiW) named DC- NiW coatings were electrodeposited by applying of DC waveform (0.14 A.cm-2 for duration of 30 min) from Ni and NiW baths, respectively. Whereas, pulse reverse current (PRC) electrodeposited Nickel (Ni) named PRC-Ni, and pulse reverse current (PRC) electrodeposited Nickel-Tungsten (NiW) named PRC-NiW coatings were electrodeposited by applying of PRC waveform (forward current density of 0.15 A.cm-2 for 16 ms and reverse current density of 0.11 A.cm-2 for 9 ms) from Ni, and NiW baths, respectively.
Figure 1. Electrodeposition cell setup
2.4 Characterization of deposits
The grain size and surface morphology of the deposits were characterized by energy scanning transmission electron microscopy (STEM, Hitachi Model HT7700) and scanning electron microscopy (SEM, Joel 7600 TFE), respectively.
The hardness and elastic modulus were evaluated by using a nano-indenter (Nanomechanics, Inc) with a conical diamond indenter tip (90 degrees, 5 µm radius spherical end). The pre- test parameters are displayed in Table 2. The nano-indentation technique is commonly used for the measurement of mechanical properties of the coating such as hardness and elastic modulus. In a typical nano-indentation, load and displacement are recorded as the indenter is pressed into the surface of the testing material under a fixed load. The response of interest is the load-displacement curve which is often called the P-h curve [23-25].
Table 2. Pre-test parameters for nano-indentation
|
Parameters |
Value |
|
Target load (mN) |
200 |
|
Target depth (nm) |
5000 |
|
Poisson's Ratio of Sample |
0.3 |
|
Target Indentation Strain Rate (s-1) |
0.2 |
|
Target Frequency (Hz) |
100 |
|
Surface Approach Velocity (nm.s-1) |
100 |
|
Hold Maximum Load Time (s) |
1 |
In Nano-indentation process, target load specifies the load at which the indentation test will terminate. This value also determines the load at which the average results will be reported. Poisson’s ratio of the sample was used in calculating the elastic modulus from indentation data. Target Indentation Strain Rate method attempts to maintain a constant indentation strain rate during loading and this value sets that strain rate. The loading algorithm of a constant indentation strain rate test follows a constant $\frac{d p / d t}{P}$, where $P$ is load and $t$ is time. The result is an exponential load rate. This is an important loading condition for strain rate sensitive materials. In order to obtain reliable statistics, 100 indents on various locations for each specimen were performed [26-28].
Potentiostat (Princeton Applied Research Potentiostat/Galvanostat Model 273A) was used for studying of pitting corrosion behaviors of the deposits. The potentiostat was equipped with CorrWare software enabling to apply potential scans remotely through the software. The Cyclic potentiodynamic polarization (CPP) scans were performed from -0.6 to 1.0 V in forward scan at room temperature and 5 mV.s-1 scan rate and from 1.0 to -1.0 V in reversed scan with 5 mV.s-1 scan rate. For all the CPP experiments, silver/silver sulfate electrode and graphite rod were used as reference and counter electrodes, respectively. The surface of the specimen was covered with an insulating 3M tape to expose 1 cm2 of the surface to corrosive liquid (artificial sea water). The composition of the artificial sea water is summarized in Table 3.
Table 3. Chemical composition of the electrolyte and components concentration for the corrosion tests
|
Ingredients |
Concentration (Wt.%) |
|
NaCl |
58.49 |
|
Na2SO4 |
9.75 |
|
CaCl2 |
2.765 |
|
KCl |
1.645 |
|
NaHCO3 |
0.477 |
|
KBr |
0.238 |
|
H3BO3 SrCl2.6H2O |
0.071 0.095 |
|
NaF |
0.007 |
|
MgCl2 |
26.46 |
3.1 Cyclic potentiodynamic polarization (CPP)
The cylic potentiondynamic polarization (CPP) curve of the DC electrodeposited Ni is shown is figure 2. As it can be seen, during the anodic polarization scan, the potential scanning begins from the corrosion potential (Ecorr). The rapid increase in current density before approaching the oxygen evolution potential can be due to the following factors: 1) formation of metastable pitting within the pore at the passive potential due to local dissolution of the active regions; 2) existence of defects on the surface of passive layer that can cause instability of the passivation film throughout the passive region. These defects are active and can propagate resulting in the increase of the current density; 3) breakdown of the passive layer and occurrence of pitting corrosion in the presence of corrosive ions [29–31]. These values of the current density can be also related to their corresponding potential values. The potential in which this sudden increase in current density occurs is named as pitting corrosion (Ep), breakdown or rupture potential. In other words, pitting potential is the minimum potential at which the material tends to the pitting corrosion. Above the pitting potential, new pits will initiate and develop. Pitting corrosion resistance (Rp) can be calculated from Rp = |Ecorr – Ep/di, where di is the corresponding variation of the current density. After increasing the current density at pitting potential, the direction of potential scanning is reversed. During the reversed scan, the current density is higher than the current density in the forward scan resulting in positive hysteresis which is indicative of pitting corrosion. Re-passivation or protection potential is the potential at intersection between reversed and forward polarization curves. At this potential, the anodic current density decreases to the smallest value on the reversed scan. This is in agreement with the results published elsewhere [4, 29–31].
Figure 2. Cyclic potentiodynamic polarization (CPP) curves of Direct Current(DC) electrodeposited Nickel (DC-Ni)
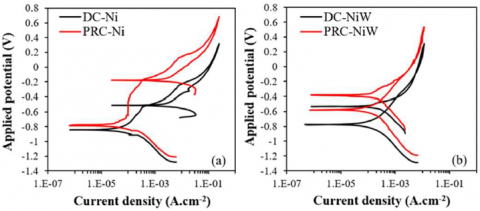
The CPP curves for samples based on DC-Ni, PRC-Ni, DC-NiW, and PRC-NiW are shown in figure 3, respectively. The curves of the DC and PRC electrodeposited Ni samples (figure 3a) display a relatively large positive hysteresis compared to those of the DC and PRC deposited NiW (figure 3b). The difference between Ep and Erep for Ni deposit is larger compared to that NiW. In other words, the deposited NiW displays higher pitting resistance (almost no pitting) than Ni deposit.
This conclusion is supported by the following explanation of difference between the value of the pitting (Ep) potential and that of the protection or re-passivation potential (Erep). At the protection or re-passivation potential, the growth of pits is stopped. The size of hysteresis is indicative of the degree of pitting corrosion and it is determined by the difference between pitting potential and protection potential (Ep-Erep). At the potential between Ep and Erep, only old pits propagate and there is no nucleation of new pits.
Figure 3. (a) Cyclic potentiodynamic polarization (CPP) of Direct Current (DC) electrodeposited Nickel (DC-Ni) and Pulse Reverse Current (PRC) electrodeposited Nickel (PRC- Ni); (b) Cyclic potentiodynamic polarization (CPP) of Direct Current (DC) electrodeposited Nickel-Tungsten (DC-NiW) and Pulse Reverse Current (PRC) electrodeposited Nickel- Tungsten (PRC-NiW)
The relative location of re-passivation potential (Erep) with respect to corrosion potential (Ecorr) determines the resistance of the material to localized or pitting corrosion. In other words, if Erep is nobler than Ecorr, the propagation of active pits is reduced or stopped and at potentials region between Erep and Ecorr, the passive layer is stable and pits will not initiate or grow. As well, in this region (perfect passivity region) crack initiation and propagation will not occur [17].
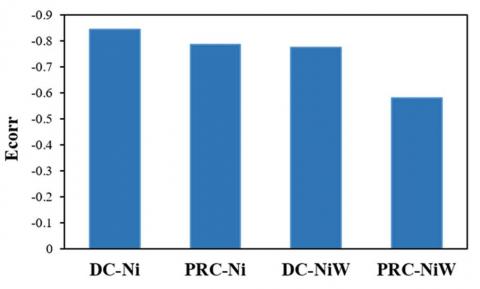
The corrosion potential values for DC-Ni, PRC-Ni, DC-NiW, and PRC-NiW extracted from figures 3(a) and 3(b) are displayed in Figure 4. As it can be seen, PRC-NiW exhibited the more positive corrosion potential (-0.6 V) in comparison to those of PRC-Ni an DC-NiW (bot around -0.8 V) and to that of DC-Ni (-0.85 V). Nickel electrodeposit with a Direct Current density (DC-Ni) exhibited the more negative corrosion potential and nickel electrodem. It was speculated that the difference in grain structures of DC-NiW and PRC- NiW resulting from the applied current waveforms (DC and PRC) were mainly responsible for different corrosion behaviors. Ghavidel et al. [32] investigated the pitting corrosion behavior of nano and microcrystalline Ni coatings deposited by direct and pulse current (PC) waveforms. They found that nano-crystalline coatings possessed higher breakdown potential than that of microcrystalline coating.
Figure 4. Comparison of the corrosion potential of Direct Current (DC) electrodeposited Nickel (DC-Ni) and Pulse Reverse Current (PRC) electrodeposited Nickel (PRC-Ni), Direct Current (DC) electrodeposited Nickel-Tungsten (DC- NiW) and Pulse Reverse Current (PRC) electrodeposited Nickel-Tungsten (PRC-NiW)
3.2 STEM analysis
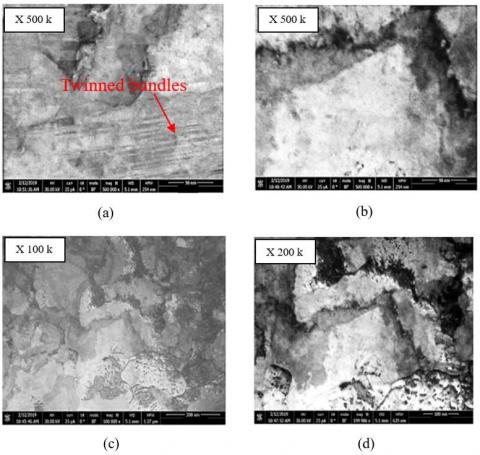
STEM (Scanning Transmission Electron Microscopy) observations were conducted on DC-NiW and PRC-NiW electrodeposited samples to examine the crystalline and/or amorphous structure of NiW coatings deposited on brass substrates. The samples for STEM analysis were thinned to<50 nm in thickness by FIB (Focussed Ion Beam) lift-out procedure to enable the analyzing beam of electrons to pass through the samples. The grains at region adjacent to brass substrate (figure 5a and 6a) exhibit preferentially oriented nano-twinned structure while all the grains in other region far from the substrate border such as the middle section of the coating (figure 5b and 6b) appear to be amorphous. In this region, numerous sub-domains are also visible which display various types of mass-thickness contrast (resulting from increased/decreased W content) or diffraction contrast. Different magnifications of the middle section of the coatings are displayed in figures 5(c), 5(d), 6(c) and 6(d).
Figure 5. Bright Field Scanning Transmission Electron Microscopy (BF-STEM) micrographs of Direct Current (DC) electrodeposited NiW; (a) the observed region of the sample is close to the substrate border; (b) the observed region of the sample is near the middle section of the deposit; different magnification images of the deposit: (c) magnification of x100,000 or 100 k and (d) magnification of 200,000 or 200 k
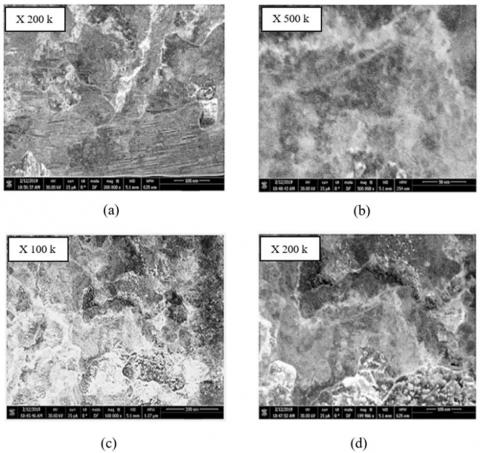
Figure 6. Dark Field Scanning Transmission Electron Microscopy (BF-STEM) micrographs of Direct Current (DC) electrodeposited NiW; (a) the observed region of the sample is close to the substrate edge; (b) the observed region of the sample is near the middle section of the deposit; (c) et (d) different magnification images of the deposit: (c) magnification of x100,000 or 100 k and (d) magnification of 200,000 or 200 k
Bright Field (BF) and Dark Field (DF) Scanning Transmission Eletron Microscopy (STEM) images of PRC- NiW at different magnifications are displayed in figure 7. Although BF-STEM has higher contrast than DF-STEM, DF- STEM provides better view from too small or out of view crystalline structures. Densely packed coherent nano-twins can be clearly seen throughout the deposits in DF-STEM image at lower magnification (figures 7c).
Figure 7. Bright Field Scanning Transmission Electron Microscopy (BF-STEM) micrographs; of PRC electrodeposited NiW at different magnifications: (a) x 250 000 or 250 k and (b) x500,000 or 500 k; Dark Field Scanning Transmission Electron Microscopy (DF-STEM) micrographs of PRC electrodeposited NiW at different magnifications: (c)x250,000 or 250 k and (d) x500,000 or 500 k
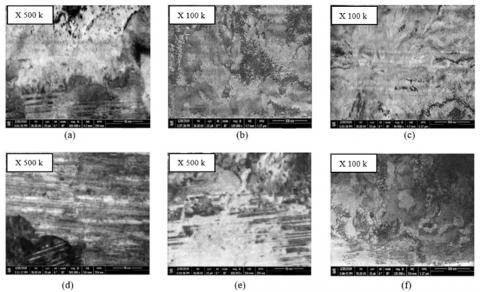
To investigate the influence of DC and PRC electrodeposition on microstructure of NiW coating, the BF- STEM images were taken from the DC (figures 8a, 8b, 8c) and PRC-NiW (figures 8d, 8e, 8f) at different locations adjacent to the substrate. One location is a distance smaller than 100 nm of the border of the substrate and the second location is at a distance greater than 500 nm from the border of the substrate. It was noticed that, in the case of DC-NiW, only few twinned grains are visible at regions close to the substrate border. However, in the case of PRC-NiW, preferentially orientated twinned grains are visible at different locations of PRC-NiW deposit which could be the possible reason for high pitting resistance of the PRC deposited coatings compared to DC electrodeposited ones. As well, some amorphous regions are still visible in locations smaller than 100nm from the border of the substrate and at a distance greater than 500 nm from the substrate border. It was reported that high pitting corrosion resistant of coatings with smaller grain size were attributed to the reduced absorption of chloride ions on the surface of the coating, which prevented the incorporation of chloride ions into the passive film. Recent studied have also shown that, nano-twins promote the formation of thin and compact passive film that improves the corrosion resistance of the coating [33- 34].
Figure 8. Comparison between various images of the Bright Filed-Scanning Transmission Electron Microscopy (BF- STEM) of Direct Current (DC) electrodeposited Nickel- Tungsten (DC-NiW) and those of Pulse Reverse Current electrodeposited NiW(PRC-NiW): From 8a to 8c case of BF-STEM of DC electrodeposited Ni,; (8a) Region close to the substrate, (8b) Region at a distance smaller than 100 nm from the substrate, (8c) Region at a distance of greater than 500 nm from the substrate and BF-STEM of PRC electrodeposited NiW: From 8d to 8f case of Pulse Reverse Current electrodeposited NiW(PRC-NiW), (8d) Region close to the substrate, (8e) Region smaller than 100 nm from the substrate and (8f) Region greater than 500 nm from the substrate
3.3 SEM and EDS analysis
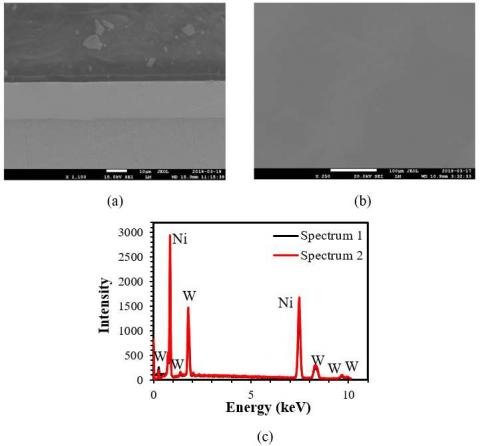
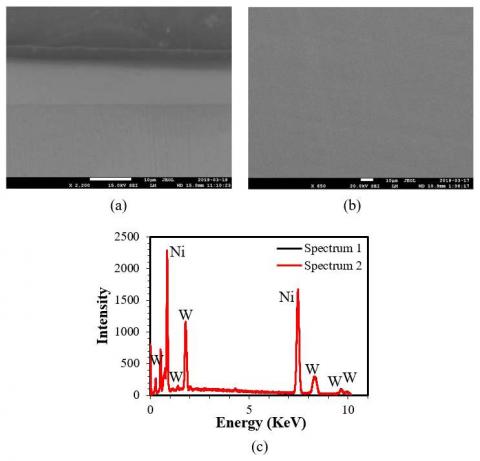
A uniform and defect-free coating was observed in surface and cross-section of SEM micrographs of DC-NiW and PRC- NiW (Figure 10). Similar to DC-NiW coatings, PRC-NiW coated samples were very smooth and crack-free throughout the surface and across the coatings (figure 11).
Furthermore, results from EDS spectra of different locations of DC (Figure 10c) and PRC-NiW coated substrates(Fig.11c) suggest that Ni and W are the main elements present in the coatings. Accordingly, similar chemical composition is obtained of the sample electrodeposited using DC or PRC method. But, from the EDS spectra (Figures 10c and 11c), the intensity of the tungsten pic for the sample electrodeposited using the DC method (Figure 10c) is higher than that of the tungsten of the sample electrodeposited using the PRC method (Figure 11c). This is an indication that the tungsten content is more important in the DC-electrodeposited sample than in PRC electrodeposited sample. This difference in tungsten content may have some impact on the mechanical properties of the samples. This is the objective of the following paragraph 3.4.
Figure 9. Scaning Electron Microscopy (SEM) micrographs of: (a) cross section of Direct Current (DC) electrodeposited of Nickel-Tungsten (DC-NiW) (x1100), (b) surface of DC- NiW electrodeposited on brass substrate(x250); and (c) EDS spectra of the surface of DC-NiW
Figure 10. Scanning Eletron Microscopy (SEM) micrographs of: (a) cross section of Pulse Reverse Current (PRC) electrodeposited Nickel-Tungsten (PRC-NiW) (x2200), (b) surface of PRC-NiW electrodeposited on brass substrate(x450), and (c) EDS spectra from surface of PRC- NiW
3.4 Mechanical properties
3.4.1 Nano-hardness results
Nano-indentation provided information on mechanical properties by calculation from indenter load and displacement. The first information on mechanical properties was obtained from a simple load-unload test, which provided a general idea and basic characteristics such as hardness and elastic modulus and also informed about irreversible processes. Load- displacement (depth) curves for DC-NiW, PRC-NiW, and brass substrate are shown in figure 12, respectively. They display typical load-depth curves of indentation into elastic- plastic materials. The curve for brass substrate was typical for a soft elastoplastic material, whereas those of DC-NiW and PRC-NiW were more typical of hard elastoplastic materials. Also, neither of the displayed curves display any cracks formation during loading, no phase transformation during unloading and no delamination of the indented coatings from brass substrate.
In general, the indentation response of a coating material is influenced by the properties of the coating. Therefore, to minimize the effect of the substrate, the indentation depth should be confined to less than 10% of the coating thickness. However, this 10% rule is not always reliable, especially if there is a large elastic mismatch between the film and the substrate and if the films are too thin that makes it difficult to obtain accurate results for very shallow indentations [35, 36]. The hardness and elastic modulus of brass substrate, DC-NiW and PRC-NiW coatings were evaluated by nano-indentation test from the load-displacement curves using the standard analysis procedure proposed by Oliver and Pharr [37].
Hardness (H) was calculated from:
$\mathrm{H}=\frac{P \max }{A}$
Elastic modulus was calculated using the following relation:
$\mathrm{E}=\frac{S \sqrt{\pi}}{2 \beta \sqrt{A}}$
where Pmax is the maximum load applied during nano- indentation, A is the contact surface area, β is a geometrical constant of the indenter, and S is the stiffness of contact and is the defined as the slope of the curve upon unloading.
The hardness values calculated from load-depth curves for each material (i.e., Brass substrate, DC-NiW, and PRC-NiW) are demonstrated in Figures 12. As it can be seen, the average hardness of DC-NiW (830 Vickers) was slightly higher than that of PRC-NiW(790 Vickers). This is expected since the content of co-deposited tungsten during pulse reverse electrodeposition step is reduced from 35 wt.% W down to about 25 wt.% W.). As indicated above in 3.3, the tungsten content of the electrodeposited layers was measured using EDS.
The hardness of DC-NiW (830 Vickers) and that of PRC- NiW(790 Vickers) are significantly higher than that of the brass substrate (240 Vickers). Accordingly, the coating improves significantly the hardness of the sample.
Figure 11. Load vs depth profiles for (a) Direct Current electrodeposited Nickel-Tungsten (DC-NiW) on brass substrate, (b) Pulse Reverse Current electrodeposited Nickel- Tungsten (PRC-NiW) on brass substrate, and (c) Brass substrate
Figure 12. Nano-hardness measurements at various locations on: (a) Direct Current (DC) electrodeposited Nickel- Tungsten (DC-NiW) on brass substrate, (b)Pulse Reverse Current (PRC) electrodeposited Nickel-Tungsten (PRC-NiW) on brass substrate, and (c) brass substrate
3.4.2 Elastic-modulus results
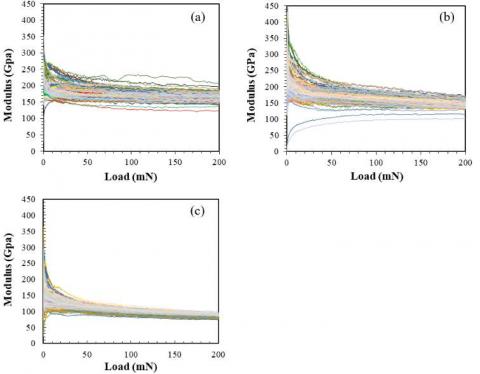
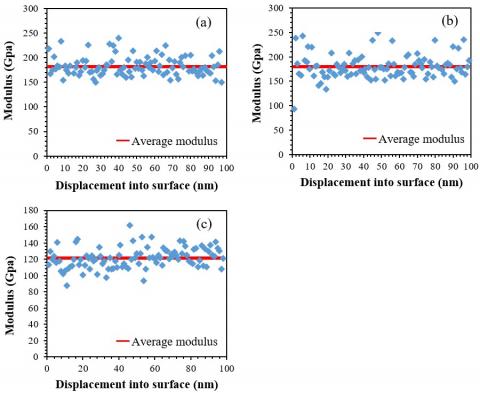
The variation of the modulus on the applied load for DC- NiW, PRC-NiW, and brass substrate was investigated (figure 13). From these figures, there is no significant effect of the rate of the loading on the modulus for DC-NiW and PRC-NiW based coatings. The average modulus values for 100 measurements at different locations on each sample was reported in Figures 14. We may conclude that the average modulus for both DC-NiW and PRC-NiW is approximately independent of loading rate. The current mode (DC or pulse) of electrodeposition of NiW has no significant effect on the modulus of the electrodeposited sample.
Figure 13. Modulus vs load profiles for: (a) Direct Current (DC) electrodeposited Nickel-Tungsten (DC-NiW) on brass substrate, (b) Pulse Reverse Current(PRC) electrodeposited Nickel-Tungsten (PRC-NiW) on brass substrate, and (c) Brass substrate
Figure 14. Modulus measurements at various locations on (a) DC-NiW electrodeposited on brass substrate, (b) PRC-NiW electrodeposited on brass substrate, and (c) Brass substrate
The corrosion potential obtained from Cyclic potentiodynamic polarization (CPP) graphs for DC-Ni, DC- NiW, PRC-Ni, and PRC-NiW were increased to less noble values to high noble values as follows: DC-Ni < DC-NiW < PRC-Ni < PRC-NiW, e.g, thermodynamically, PRC-NiW is more resistant to corrosion than DC-Ni. As well, CPP graphs showed that the difference between Ep (pitting potential) and Erep (protection or re-passivation potential) for DC and PRC- Ni deposit was larger compared to DC and PRC-NiW. In other words, the NiW displayed higher pitting resistance compared to Ni deposit only.It was speculated that the difference in grain structures of DC-NiW and PRC-NiW resulting from the applied current waveforms (DC and PRC) were mainly responsible for different corrosion behaviors. The pulse reverse current waveform produced grains in nanometer sizes whereas the deposits formed by applying DC displayed amorphous structure.
The influence of the current waveform (DC and PRC) on nano-hardness and elastic modulus of NiW coating was also investigated. The average hardness of DC-NiW was slightly higher than that of PRC-NiW. However, the elastic modulus of the both coatings was approximately similar with increase of the loading rate.
[1] Mahidashti, Z, Aliofkhazraei, M and Lotfi, N, "Review of Nickel-Based Electrodeposited Tribo-Coatings." Transactions of the Indian Institute of Metals, 71 (2) 257- 295 (2017). https://doi.org/10.1155/2021/5511127
[2] Allahyarzadeh, MH, Aliofkhazraei, M, Rouhaghdam, AS, Torabinejad, V, Alimadadi, H and Ashrafi, A, "Electrodeposition mechanism and corrosion behavior of multilayer nanocrystalline nickel-tungsten alloy." Electrochimica Acta, 258 883-899 (2017). https://doi.org/10.1016/j.electacta.2017.11.139
[3] Esmailzadeh, S, Aliofkhazraei, M and Sarlak, H, "Interpretation of Cyclic Potentiodynamic Polarization Test Results for Study of Corrosion Behavior of Metals: A Review." Protection of Metals and Physical Chemistry of Surfaces, 54 (5) 976-989 (2018).
[4] Sun, Q and Chen, K, "Inflection of backward sweep of cyclic polarization curve: Pit transition potential Eptp." Materials and Corrosion, 69 (12) 1729-1740 (2018). https://doi.org/10.1002/maco.201810419
[5] Frankel, GS, "Pitting Corrosion of Metals: A Review of the Critical Factors." Journal of The Electrochemical Society, 145 (6) 2186-2198 (2019).
[6] Wasekar, NP, Hebalkar, N, Jyothirmayi, A, Lavakumar, B, Ramakrishna, M and Sundararajan, G, "Influence of pulse parameters on the mechanical properties and electrochemical corrosion behavior of electrodeposited Ni- W alloy coatings with high tungsten content." Corrosion Science, 165 (2020). https://doi.org/10.1016/j.corsci.2019.108409
[7] Sriraman, KR, Ganesh Sundara Raman, S and Seshadri, SK, "Corrosion behaviour of electrodeposited nanocrystalline Ni–W and Ni–Fe–W alloys." Materials Science and Engineering: A, 460-461 39-45 (2007). https://doi.org/10.1016/j.msea.2007.02.055
[8] Alimadadi, H, Ahmadi, M, Aliofkhazraei, M and Younesi, SR, "Corrosion properties of electrodeposited nanocrystalline and amorphous patterned Ni–W alloy." Materials & Design, 30 (4) 1356-1361 (2009). https://doi.org/10.1016/j.matdes.2008.06.036
[9] Yang, FZ, Guo, YF, Huang, L, Xu, SK and Zhou, SM, "Electrodeposition, Structure and Corrosion Resistance of Nanocrystalline Ni-W Alloy." Chinese Journal of Chemistry, 22 228–231 (2004). https://doi.org/10.1002/cjoc.20040220303
[10] Elias, L and Chitharanjan Hegde, A, "Electrodeposition of laminar coatings of Ni–W alloy and their corrosion behaviour." Surface and Coatings Technology, 283 61-69 (2015). https://doi.org/10.1016/j.surfcoat.2015.10.025
[11] Indyka, P, Beltowska-Lehman, E, Tarkowski, L, Bigos, A and García-Lecina, E, "Structure characterization of nanocrystalline Ni–W alloys obtained by electrodeposition." Journal of Alloys and Compounds, 590 75-79 (2014). https://doi.org/10.1016/j.jallcom.2013.12.085
[12] Yao, Y, Yao, S, Zhang, L, "Corrosion behavior of Ni– W/SiC nanocomposite coating in NaCl solution." Surface Review and Letters, 13 489–494 (2006). https://doi.org/10.1142/S0218625X06008724
[13] Hosseini, MG, Abdolmaleki, M and Ghahremani, J, "Investigation of corrosion resistance of electrodeposited Ni–W/SiC composite coatings." Corrosion Engineering, Science and Technology, 49 (4) 247-253 (2013). https://doi.org/10.1179/1743278213Y.0000000120
[14] Hosseini, MG, Teymourinia, H, Farzaneh, A and Khameneh-asl, S, "Evaluation of corrosion, mechanical and structural properties of new Ni–W–PCTFE nanocomposite coating." Surface and Coatings Technology, 298 114-120 (2016). https://doi.org/10.1016/j.surfcoat.2016.04.060
[15] Panagopoulos, CN, Plainakis, GD and Lagaris, DA, "Nanocrystalline Ni–W coatings on copper." Materials Science and Engineering: B, 176 (6) 477-479 (2011). https://doi.org/10.1016/j.mseb.2010.03.058
[16] De Lima-Neto, P, Correia, AN, Santana, RAC, Colares, RP, Barros, EB, Casciano, PNS and Vaz, GL, "Morphological, structural, microhardness and electrochemical characterisations of electrodeposited Cr and Ni–W coatings." Electrochimica Acta, 55 (6) 2078- 2086 (2010). https://doi.org/10.1016/j.electacta.2009.11.037
[17] Vamsi, MVN, Wasekar, NP and Sundararajan, G, "Sliding wear of as-deposited and heat-treated nanocrystalline nickel-tungsten alloy coatings." Wear, 412-413 136-143 (2018). https://doi.org/10.1016/j.wear.2018.07.022
[18] Wasekar, NP, Latha, SM, Ramakrishna, M, Rao, DS and Sundararajan, G, "Pulsed electrodeposition and mechanical properties of Ni-W/SiC nano-composite coatings." Materials & Design, 112 140-150 (2016). https://doi.org/10.1016/j.matdes.2016.09.070
[19] Mohammadpour, Z and Zare, HR, "Improving the Corrosion Resistance of the Nickel–Tungsten Alloy by Optimization of the Electroplating Conditions." Transactions of the Indian Institute of Metals, 73 (4) 937- 944 (2020).
[20] Wang, Y, Yu, M, Luo, H, Qiao, Q, Xiao, Z, Zhao, Y, Zhao, L, Sun, H, Xu, Z, Matsugi, K and Yu, J, "Effect of Saccharin on the Structure and Properties of Electrodeposition NiWP Alloy Coatings." Journal of Materials Engineering and Performance, 25 (10) 4402- 4407 (2016).
[21] Cameron, JC, "Acetylenic Compositions and Nickel Plating Baths Containing Same." US Patent 4, 421, 611, 1983.
[22] https://www.chemours.com/en/media/files/capstone/caps tone-surfactants-brochure.pdf
[23] Schuh, CA, "Nanoindentation studies of materials." Materials Today, 9 (5) 32-40 (2006).
[24] Kushch, VI, Dub, SN and Litvin, PM, "Determination of the young modulus from elastic section of the Berkovich indenter loading curve." Journal of Superhard Materials, 29 (4) 228-234 (2007).
[25] Bull, SJ, "Nanoindentation of coatings." Journal of Physics D: Applied Physics, 38 (24) R393-R413 (2005).
[26] Guillonneau, G, Kermouche, G, Bec, S and Loubet, JL, "Determination of mechanical properties by nanoindentation independently of indentation depth measurement." Journal of Materials Research, 27 (19) 2551-2560 (2012).
[27] Basu, S, Moseson, A and Barsoum, MW, "On the determination of spherical nanoindentation stress–strain curves." Journal of Materials Research, 21 (10) 2628-2637 (2011).
[28] Shuman, DJ, Costa, ALM and Andrade, MS, "Calculating the elastic modulus from nanoindentation and microindentation reload curves." Materials Characterization, 58 (4) 380-389 (2007). https://doi.org/10.1016/j.matchar.2006.06.005
[29] Shi, Y, Yang, B and Liaw, P, "Corrosion-Resistant High- Entropy Alloys: A Review." Metals, 7 (2) (2017). https://doi.org/10.3390/met7020043
[30] Feng, L, Ren, Y-Y, Zhang, Y-h, Wang, S and Li, L, "Direct Correlations among the Grain Size, Texture, and Indentation Behavior of Nanocrystalline Nickel Coatings." Metals, 9 (2) (2019). https://doi.org/10.3390/met9020188
[31] Dong, CF, Luo, H, Xiao, K, Li, XG and Cheng, YF, "In Situ Characterization of Pitting Corrosion of Stainless Steel by a Scanning Electrochemical Microscopy." Journal of Materials Engineering and Performance, 21 (3) 406-410 (2011).
[32] Zamanzad-Ghavidel, MR, Raeissi, K and Saatchi, A, "The effect of surface morphology on pitting corrosion resistance of Ni nanocrystalline coatings." Materials Letters, 63 (21) 1807-1809 (2009). https://doi.org/10.1016/j.matlet.2009.05.043
[33] Liu, L, Li, Y and Wang, F, "Influence of grain size on the corrosion behavior of a Ni-based superalloy nanocrystalline coating in NaCl acidic solution." Electrochimica Acta, 53 (5) 2453-2462 (2008). https://doi.org/10.1016/j.electacta.2007.10.048
[34] Tiamiyu, AA, Eduok, U, Szpunar, JA and Odeshi, AG, "Corrosion behavior of metastable AISI 321 austenitic stainless steel: Investigating the effect of grain size and prior plastic deformation on its degradation pattern in saline media." Sci Rep, 9 (1) 12116 (2019).
[35] Li, H and Vlassak, JJ, "Determining the elastic modulus and hardness of an ultra-thin film on a substrate using nanoindentation." Journal of Materials Research, 24 (3) 1114-1126 (2011).
[36] Abadias, G, Chason, E, Keckes, J, Sebastiani, M, Thompson, GB, Barthel, E, Doll, GL, Murray, CE, Stoessel, CH and Martinu, L, "Review Article: Stress in thin films and coatings: Current status, challenges, and prospects." Journal of Vacuum Science & Technology A: Vacuum, Surfaces, and Films, 36 (2) (2018). https://doi.org/10.1116/1.5011790
[37] Kossman, S, Coorevits, T, Iost, A and Chicot, D, "A new approach of the Oliver and Pharr model to fit the unloading curve from instrumented indentation testing." Journal of Materials Research, 32 (12) 2230-2240 (2017). https://doi.org/10.1557/jmr.2017.120