Effects of TiO2 Nanotube Size on the Performance of Li-Ion Battery with TiO2 Nanotube as Anode Material

Jing Zou* | Gang Wu | Wei Jiang | Congwang Bao | Jiayin Zou
© 2020 IIETA. This article is published by IIETA and is licensed under the CC BY 4.0 license (http://creativecommons.org/licenses/by/4.0/).
OPEN ACCESS
This paper aims to disclose how the size of TiO2 Nanotubes affects the performance of Li-ion battery with TiO2 nanotubes as anode material. Firstly, TiO2 nanotubes of two different sizes were synthetized by hydrothermal method, namely, L-TiO2 nanotubes and S-TiO2 nanotubes. Next, the morphology, structure, cycle performance, rate performance, and electrochemical performance of the button batteries respectively assembled with L-TiO2 nanotubes and S-TiO2 nanotubes as anode materials (L-battery and S-battery) were tested with a scanning electron microscope (SEM), a transmission electron microscope (TEM), an X-ray diffractometer (XRD), a battery test system, and an electrochemical workstation. The results show that S-battery has better specific discharge capacity (SDC), cycle stability and rate performance than L-battery. The initial DSC of S-battery was as high as 262.6mAh/g; after 100 cycles, the DSC of that battery was still 250.5mAh/g, down by only 0.046%. Even if the rate increased to 2C, the DSC of the battery was maintained at 151.8mAh/g.
TiO2 nanotube, size, Li-ion battery, anode material
Featuring high energy density and a long cycle life, rechargeable Li-ion battery are widely used in automobiles, electric vehicles, and energy storage [1, 2]. However, the capacity and cycle performance of Li-ion battery can no longer fulfil the surging demand from emerging industries [3]. Traditionally, the electrodes of Li-ion battery are made of graphite, a material with poor cycle performance. Li dendrites will form on the surface of the battery at low voltage or overcharge/discharge. The ensuing short circuit or even explosion of the battery gives rise to serious safety risks [4, 5]. Hence, it is an urgent task to develop a new material with high lithium insertion capacity and excellent cycle performance to replace graphite as electrodes [6].
TiO2 is an abundant and environmental-friendly oxide with high capacity, stable structure, and good safety performance. It is a potential anode material for new-generation Li-ion battery [7, 8]. If adopted as the anode of Li-ion battery, TiO2 will exhibit good electrochemical activity, and offer a high charge and discharge platform (1.7V). In this case, no Li dentrite will form at low voltage. Neither will a solid electrolyte interface (SEI) appear on the electrode surface. Suffice it to say that TiO2 is promising candidate material for safe low-voltage anode [9, 10]. The electrode performance depends heavily on the morphology and size of its material. With a large specific surface area (SSA), TiO2 nanotube is an ideal anode material for miniature Li-ion battery, making it possible to control the packaging size within a limited space [11, 12].
This paper synthetizes TiO2 nanotubes of two different sizes by hydrothermal method. After that, the surface morphology and composition of the samples were analyzed with a scanning electron microscope (SEM) and a transmission electron microscope (TEM). In addition, the crystal structure of the samples was measured by an X-ray diffractometer (XRD). Finally, the electrochemical impedance and electrode performance of sample Li-ion batteries were investigated, using a battery test system and an electrochemical workstation.
2.1 Material preparation
Firstly, 30mL 10mol/L NaOH solution was prepared. Then, 0.2g P25 TiO2 (Evonik Industries Group) was added to the NaOH solution, followed by 5-10 min stirring. Once the solution was evenly mixed, 20mL of the solution was measured, and relocated into a 100mL stainless steel autoclave. After added with a magnetic rotor, the autoclave was put into a constant temperature heat-gathering magnetic stirrer, and heated at a constant temperature of 130-180°C.
After 24h reaction at 300r/min, the sample in the autoclave was cooled to room temperature, and then washed with deionized water to the pH of 9. Then, the sample was centrifuged and washed three times with 0.1mol/L HNO3. Next, the sample was centrifuged and washed again with deionized water to the pH of 7.
The white flocculent precipitation was dried completely in a vacuum oven at 70°C, and then annealed for 2h at 450°C in a tube furnace under argon atmosphere. After that, the temperature was increased at 5°C/min, creating the black powdery product. The TiO2 tubes prepared at 180°C were relatively large, denoted as L-TiO2 nanotubes, while those prepared at 130°C were relatively small, denoted as S-TiO2 nanotubes.
2.2 Material characterization
The surface morphology of each sample was observed and analyzed with an SEM (LEO 1530VP) and a TEM (Tecnai G2 20 S-TWIN). The crystal structure of each sample was examined under an XRD (Bruker D9 ADVANCE). The target source is Cu-Kα, the power is 40kV×50mA, the wavelength is λ=0.15405 nm, the scanning speed is 10°/min, the step length is 0.02°, and the scanning range is 2θ=20-80°.
2.3 Battery preparation and performance test
Each TiO2 nanotube, conductive agent (acetylene black), and binder (polyvinylidene fluoride-PVDF) were mixed into a uniform slurry of moderate consistency at the mass ratio of 8:1:1. Then, the slurry was applied on the washed copper foil. After drying for 12h at 70°C in the vacuum oven, the copper foil was cut into a pole piece with a diameter of 14mm.
Then, the pole piece was assembled into a 2032 button battery under argon atmosphere (O2<1ppm; H2O<1ppm) in a glovebox (Innovative Technology), where the membrane is Celgard 2400, the electrolyte is 1mol/L LiPF6 solution in DMC/EC/DEC=1:1:1 (v/v/v).
The cycle performance and rate performance of the battery were tested on a battery test system (Neware CT-3008; 5V, 10mA), with the voltage range of 0-3V. The cyclic voltammetry (CV) and electrochemical impedance spectrometry (EIS) of the battery were tested on an electrochemical workstation (Shanghai Chenhua CHI760E). During the CV test, the voltage was set to 0-3V, and the scanning speed to 0.1mV/s. During the EIS test, the voltage was set to 3V, and the scanning frequency to 10-2-105Hz.
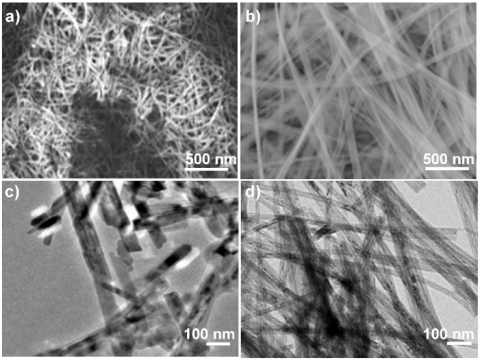
With P25 as the Ti source, TiO2 nanotubes of two different diameters were prepared by controlling the temperature of hydrothermal reaction. The microscopic morphology of these nanotubes is displayed in Figure 1.
Figures 1a and 1b are the SEM images of L-TiO2 nanotubes and S-TiO2 nanotubes, respectively. It can be seen that the L-TiO2 nanotubes were distributed unevenly, and entangled irregularly, while S-TiO2 nanotubes were slender and arranged orderly, instead of entangled irregularly [13].
Figures 1c and 1d are the TEM images of L-TiO2 nanotubes and S-TiO2 nanotubes, respectively. It can be seen that L-TiO2 nanotubes were short and thick, and seriously fragmented. Meanwhile, the morphology of S-TiO2 nanotubes was well preserved; almost every nanotube had a large aspect ratio. It is also learned that the diameter of L-TiO2 nanotubes was about 80-100nm, and that of S-TiO2 nanotubes was about 30-50mm.
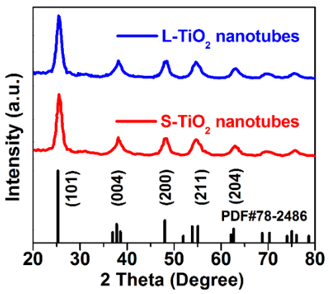
Figure 2 presents the XRD images of L-TiO2 nanotubes and S-TiO2 nanotubes. Both types of nanotubes were found to have strong diffraction peaks near 25.3°, 17.8°, 48.0°, 55.1°, and 62.7°. These peaks respectively belong to the crystal planes (101), (004), (200), (211) and (204) of TiO2 (JCPDS No. 89-2810) [14, 15]. Moreover, the diffraction peaks of the two types of nanotubes had basically the same intensity. This means the two kinds of samples have basically the same composition, and mainly differ in morphology.
To disclose the effects of size on material performance, button batteries were assembled with L-TiO2 nanotubes and S-TiO2 nanotubes as anode material, respectively, and subjected to tests on cycle performance, rate performance, CV and EIS. For convenience, the button batteries assembled from L-TiO2 nanotubes and S-TiO2 nanotubes are denoted as L-battery and S-battery, respectively.
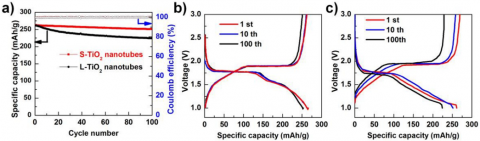
Figure 3a presents the cycle performance and coulombic efficiency of L-battery and S-battery. It can be seen that the initial discharge specific capacities (DSCs) of L-battery and S-battery were basically unchanged, respectively, 224.3mAh/g and 250.5mAh/g. After 100 cycles, the specific discharge capacities (SDCs) of L-battery and S-battery were 224.3mAh/g and 250.5mAh/g, respectively. Obviously, the capacity of S-battery decayed slower than L-battery after 100 cycles.
(a) SEM image of L-TiO2 nanotubes; (b) SEM image of S-TiO2 nanotubes;
(c) TEM image of L-TiO2 nanotubes; (d) TEM image of S-TiO2 nanotubes
Figure 1. SEM and TEM images of L-TiO2 nanotubes and S-TiO2 nanotubes
Figure 2. XRD images of L-TiO2 nanotubes and S-TiO2 nanotubes
It can be calculated that the capacity retention rates of L-battery and S-battery were 85.8% and 95.4%, respectively. On average, the capacity attenuation was 0.140% and 0.046% per cycle for L-battery and S-battery, respectively. Hence, both batteries have relatively high SDCs, but S-battery boasts better capacity retention rate and slower capacity decay. The results are evidenced by the coulombic efficiency (hollow dots in Figure 3a). The coulombic efficiency of S-battery was close to 100%, slightly higher than that of L-battery.
Figures 3b and 3c provide the charging and discharging curves of L-battery and S-battery in the 1st, 10th, and 100th cycles, respectively. It can be seen that, for S-battery, the charging and discharging curves in the 1st cycle almost overlapped with those in the 10th cycle, with a very small decrement; the curves attenuated slightly when it came to the 100th cycle. Meanwhile, the charging and discharging curves of the L-battery show that the battery capacity reduced significantly with the growing cycle number. From the 1st, 10th to 100th cycle, both curves shifted greatly to the left, indicating a marked decline of capacity.
Further observation of the charging and discharging curves shows that, during charging, S-battery had an obvious, long and flat charging platform near 1.9V, while L-battery had a much shorter charging platform with a slightly higher voltage; during discharging, S-battery had an obvious and long discharging platform near 1.75V, while L-battery had a much shorter discharging platform with a lower voltage. As a result, when the current density is the same, S-battery has a much smaller polarization voltage than L-battery, during charging and discharging. This means long and ordered S-TiO2 nanotubes are better at transmitting Li ions and electrons than short and disordered L-TiO2 nanotubes. This is probably the result of the relatively large SSA of S-TiO2 nanotubes: the large contact with electrolyte makes it easy to transport Li ions and electrons [16].
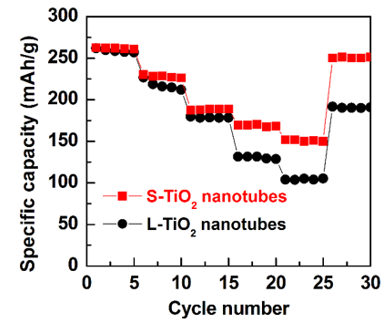
Figure 4 shows the rate performance of L-battery and S-battery observed through cyclic charging and discharging tests as the rate changed from 0.1C, 0.2C, 0.5C, 1C, 2C, to 0.1C. At 0.1C, both L-battery and S-battery had relatively high DSCs. After 5 cycles, the DSC of S-battery did not decrease significantly, while that of L-battery attenuated to a certain extent. With the growth of charging and discharging rate, the DSC of L-battery dropped far greater than that of S-battery, indicating that S-battery has the better rate performance.
As the current density grew (i.e. the change and discharge rate rose from 0.1C to 2C), the DSC of each material plunged deep. For S-battery, the DSC was 262.6mAh/g, 230.0mAh/g, 187.4mAh/g, 169.3mAh/g and 151.8mAh/g under 0.1C, 0.2C, 0.5C, 1C, and 2C, respectively, down by 110.8mAh/g as the rate increased form 0.1C to 2C. For L-battery, the DSC dropped from 261.3mAh/g to 103.9mAh/g, as the change and discharge rate rose from 0.1C to 2C. The capacity decline (157.4mAh/g) of L-battery was much greater than that of S-battery.
After 5 cycles at the large rate of 2C, the charge and discharge rate returned to 0.1C. Then, the DSC of S-battery resumed to 250mAh/g, close to the capacity before the large rate charge and discharge. By contrast, the DSC of L-battery was merely 190mAh/g, far smaller than that (261.3mAh/g) before the large rate charge and discharge. Therefore, the structure of S-TiO2 nanotubes is more stable than that of L-TiO2 nanotubes, and capable of withstanding large current during charging and discharging. On the contrary, L-TiO2 nanotubes are damaged under large current, resulting in a large loss of capacity [17].
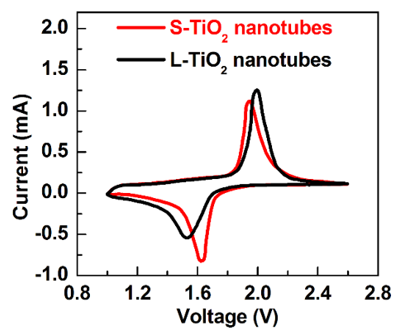
Next, L-battery and S-battery were subjected to electrochemical tests, aiming to reveal the causes of the performance difference between the TiO2 nanotubes of two different sizes. The CV test mainly explores the reversibility of the redox reaction in the battery, which is negatively correlated with the difference between the reduction peak of the discharging process and the oxidation peak of the charging process. The higher the reversibility, the smaller the polarization voltage of the battery [18].
Figure 5 displays the CV curves of L-battery and S-battery. For L-battery, the oxidation peak and reduction peak corresponded to 1.530V and 1.995V, respectively, with a difference of 0.465V. For S-battery, the oxidation peak and reduction peak corresponded to 1.622V and 1.947V, respectively; the difference (0.325V) is far smaller than that of L-battery. This means the redox reaction in S-battery is more reversible than that in L-battery.
(a) Cycle performance (b, c) Charging and discharging curves
Figure 3. Cycle performance and charging and discharging curves of L-battery and S-battery
Figure 4. Rate performance of L-battery and S-battery
Figure 5. CV curves of L-battery and S-battery
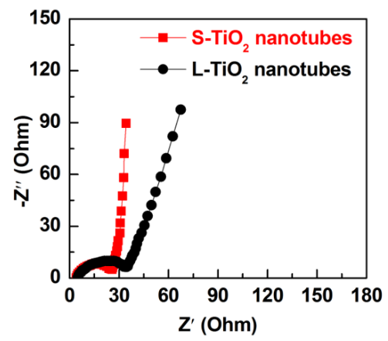
Figure 6. EIS curves of L-battery and S-battery (equivalent circuits of EIS curves)
The above result echoes with that of cycle performance (Figure 3a): S-battery boasts better cycle stability, slower capacity decay, and higher coulombic efficiency. In addition, the voltage difference between reduction and oxidation peaks is positively correlated with the polarization voltage of the battery: the smaller the difference, the lower the polarization voltage. CV test shows that S-battery has the lower polarization voltage, which is consistent with the results in Figures 3b and 3c.
Figure 6 presents the EIS curves of L-battery and S-battery. Each curve consists of two parts, namely, the semicircle in the high-frequency area and the oblique line in the low-frequency area. Note that Re and Rct (related to the semicircle in the high-frequency area) are the resistance and charge transfer impedance of the electrolyte, respectively; W (related to the oblique line in the low-frequency area) is the Warburg resistance of the material; Cdl is the double-layer capacitance used to fit constant phase angular element [19].
The EIS fitting results are given in Table 1. The Re and Rct of S-battery were 4.0 Ω and 25.7 Ω, respectively, both of which were much smaller than the Re (4.7 Ω) and Rct (34.7 Ω), of L-battery. Hence, S-TiO2 nanotubes are superior than L-TiO2 nanotubes in transmitting electrons and Li ions. Moreover, a lower internal resistance usually means a lower polarization voltage [20], which is consistent with the previous results (Figures 3b, 3c and 5).
Table 1. EIS fitting results of L-battery and S-battery
|
Material |
Re (Ω) |
Rct (Ω) |
|
L-TiO2 nanotubes |
4.7 |
34.7 |
|
S-TiO2 nanotubes |
4.0 |
25.7 |
(1) This paper TiO2 nanotubes of two different sizes by hydrothermal method: S-TiO2 nanotubes and L-TiO2 nanotubes. Compared with L-TiO2 nanotubes, S-TiO2 nanotubes has a small diameter (30-50nm), complete and orderly structure, and large aspect ratio.
(2) S-battery has better SDC, cycle stability and rate performance than L-battery. The initial DSC of S-battery was as high as 262.6mAh/g; after 100 cycles, the DSC of that battery was still 250.5mAh/g, down by only 0.046%. Even if the rate increased to 2C, the DSC of the battery was maintained at 151.8mAh/g.
(3) It is easier for electrons and Li ions to diffuse and migrate in S-battery than in L-battery, for the former has better reversibility in redox reaction and lower internal resistance.
Guizhou Mining Equipment Digital Technology Engineering Research Center (KY Word [2017] No. 026); Comprehensive Reform Pilot Project of Mechanical Engineering Major "LPSSYzyzhggsd201802"; Mechanical Engineering Key Training Discipline "LPSSYZDPYXK201705"; Mechanical Equipment Application and R&D Technology Innovation Team "LPSSYKJTD201802".
[1] Abhilash, K.P., Selvin, P.C., Nalini, B., Jose, R., Vijayaraghavan, R., Chowdari, B.V.R., Reddy, M.V. (2017). Investigations on the influence of Sm3+ ion on the nano TiO2 matrix as the anode material for lithium ion batteries. Journal of Alloys and Compounds, 710: 205-215. https://doi.org/10.1016/j.jallcom.2017.03.094
[2] He, B.L., Dong, B., Li, H.L. (2007). Preparation and electrochemical properties of Ag-modified TiO2 nanotube anode material for lithium–ion battery. Electrochemistry Communications, 9(3): 425-430. https://doi.org/10.1016/j.elecom.2006.10.008
[3] Pan, F., Yang, J., Huang, Q., Wang, X., Huang, H., Wang, Q. (2014). Redox Targeting of Anatase TiO2 for Redox Flow Lithium‐Ion Batteries. Advanced Energy Materials, 4(15): 1400567. https://doi.org/10.1002/aenm.201400567
[4] Katuril, R., Gorantla, S. (2018). Performance analysis of hybrid controller for automatic switching between energy sources of hybrid energy storage system. European Journal of Electrical Engineering, 20(5-6): 617-630. https://doi.org/10.3166/ EJEE.20.617-630
[5] Zheng, H., Ncube, N.M., Raju, K., Mphahlele, N., Mathe, M. (2016). The effect of polyaniline on TiO 2 nanoparticles as anode materials for lithium ion batteries. SpringerPlus, 5(1): 630. https://doi.org/10.1186/s40064-016-1908-z
[6] Liu, H., Bi, Z., Sun, X.G., Unocic, R.R., Paranthaman, M.P., Dai, S., Brown, G.M. (2011). Mesoporous TiO2–B microspheres with superior rate performance for lithium ion batteries. Advanced Materials, 23(30): 3450-3454. https://doi.org/10.1002/adma.201100599
[7] Wang, H.E., Jin, J., Cai, Y., Xu, J.M., Chen, D.S., Zheng, X.F., Su, B.L. (2014). Facile and fast synthesis of porous TiO2 spheres for use in lithium ion batteries. Journal of colloid and interface science, 417: 144-151. https://doi.org/10.1016/j.jcis.2013.11.035
[8] Qiao, H., Xiao, L., Zhang, L. (2008). Phosphatization: A promising approach to enhance the performance of mesoporous TiO2 anode for lithium ion batteries. Electrochemistry communications, 10(4): 616-620. https://doi.org/10.1016/j.elecom.2008.02.010
[9] Rahman, M.R.A., Saad, M.R., Idris, A.C., Faizal, H.M. (2018). Heat transfer of the TiO2/water nanofluid in an annulus of the finite rotating cylinders. International Journal of Heat and Technology, 36(1): 353-358. https://doi.org/10.18280/ijht.360147
[10] Park, H., Song, T., Han, H., Devadoss, A., Yuh, J., Choi, C., & Paik, U. (2012). SnO2 encapsulated TiO2 hollow nanofibers as anode material for lithium ion batteries. Electrochemistry communications, 22: 81-84. https://doi.org/10.1016/j.elecom.2012.05.034
[11] Qin, J.X. (2012). Photocatalytic synthesis of TiO 2 and reduced graphene oxide nanocomposite for lithium ion batter. ACS Appl Mater Interfaces, 4: 3636-3642. https://doi.org/10.1021/am300722d
[12] Gao, L., Li, S., Huang, D., Shen, Y., Wang, M. (2015). ZnO decorated TiO2 nanosheet composites for lithium ion battery. Electrochimica Acta, 182: 529-536. https://doi.org/10.1016/j.electacta.2015.09.108
[13] Song, T., Paik, U. (2016). TiO 2 as an active or supplemental material for lithium batteries. Journal of Materials Chemistry A, 4(1): 14-31. https://doi.org/10.1039/c5ta06888f
[14] Xia, T., Zhang, W., Murowchick, J.B., Liu, G., Chen, X. (2013). A facile method to improve the photocatalytic and lithium‐ion rechargeable battery performance of TiO2 nanocrystals. Advanced Energy Materials, 3(11): 1516-1523. https://doi.org/10.1002/aenm.201300294
[15] Tran, T., McCormac, K., Li, J., Bi, Z., Wu, J. (2014). Electrospun SnO2 and TiO2 composite nanofibers for lithium ion batteries. Electrochimica Acta, 117: 68-75. https://doi.org/10.1016/j.electacta.2013.11.101
[16] Yan, X., Wang, Z., He, M., Hou, Z., Xia, T., Liu, G., Chen, X. (2015). TiO2 Nanomaterials as Anode Materials for Lithium‐Ion Rechargeable Batteries. Energy Technology, 3(8): 801-814. https://doi.org/10.1002/ente.201500039
[17] Huang, X., Cui, S., Wieboldt, R.C., Hallac, P.B., Fell, C.R., Metz, B., Chen, J. (2015). Hollow TiO2 as an Anode for Lithium Ion Batteries: Synthesis and In Situ Visualization of State of Charge. Advanced Electronic Materials, 1(12): 1500256. https://doi.org/10.1002/aelm.201570046
[18] Ren, Y., Liu, Z., Pourpoint, F., Armstrong, A.R., Grey, C.P., Bruce, P.G. (2012). Nanoparticulate TiO2 (B): an anode for lithium‐ion batteries. Angewandte Chemie, 124(9): 2206-2209. https://doi.org/10.1002/anie.201108300
[19] Wang, Z., Zhang, Y., Xia, T., Murowchick, J., Liu, G., Chen, X. (2014). Lithium‐Ion Battery Performance of (001)‐Faceted TiO2 Nanosheets vs. Spherical TiO2 Nanoparticles. Energy Technology, 2(4): 376-382. https://doi.org/10.1002/ente.201300140
[20] Yang, Z., Du, G., Meng, Q., Guo, Z., Yu, X., Chen, Z., Zeng, R. (2011). Dispersion of SnO 2 nanocrystals on TiO 2 (B) nanowires as anode material for lithium ion battery applications. RSC advances, 1(9): 1834-1840. https://doi.org/10.1039/c1ra00500f