Yujie He
© 2020 IIETA. This article is published by IIETA and is licensed under the CC BY 4.0 license (http://creativecommons.org/licenses/by/4.0/).
OPEN ACCESS
The intelligent manufacturing (IM) supply chain (SC) involves multiple distributed agents. The mobile supply chain (MSC) technology supports the real-time management of key information resources in the supply chain of IM products. This paper explores the influencing factors and evaluation model of quality risks in IM MSC, trying to make realistic evaluation of the actual quality risks of the enterprise. Firstly, the authors constructed a quality risk identification framework for IM MSC, and a hierarchical evaluation index system (EIS) based on the factors affecting quality risks. Besides, the features and attributes of four dimensions of quality risks were specified, and the corresponding intuitive triangular fuzzy numbers were given. Next, an evaluation model was established for the quality risks of IM MSC based on backpropagation neural network (BPNN). After the evaluation of quality risks, a contract model was designed for the quality risk control in IM MSC. The proposed EIS and models were proved effective through experiments.
intelligent manufacturing (IM), mobile supply chain (MSC), quality risk evaluation, backpropagation neural network (BPNN)
Intelligence is the future trend of manufacturing automation. In modern industry, artificial intelligence (AI) can be applied in almost every link in the manufacturing process. This gives birth to intelligent manufacturing (IM) system and related techniques [1-4]. The IM system is defined by the autonomy of manufacturing units and the self-organization of the system. The supply chain (SC) system is also composed of multiple distributed agents [5-9]. Considering the environment of the Internet-based global manufacturing network, the mobile supply chain (SC) technology, which supports real-time management of key information resources of IM products, could be introduced to the basic framework of the distributed networked information management system of small and medium-sized enterprises (SMEs) [10-13].
According to the definition of SC quality risk by Rishelin, and Ardi [14], it can be inferred that the quality risks of IM SC are the uncertain factors that affect the product quality from parts procurement to the output of finished products. The existing studies on SC quality risks mainly focus on two aspects: risk identification methods, and risk evaluation models [15-17]. Bicer and Hagspiel [18] developed a product quality inspection and visibility evaluation framework for process control stages, such as product development, manufacturing, mass production, logistics, and sales, and associated the quality supervision mechanism and risk control strategy with the identification of SC quality risk factors. Troche-Escobar and Freires [19] analyzed the causes of frequent recalls of smart electronic products, and identified the main quality problems of recalled products: substandard quality of purchased parts, product damage caused by logistics and transportation, omissions in quality inspection in the SC, as well as the proficiency in debugging and trial production techniques in the development of new products.
The popular risk methods include expert investigation, process analysis, causality analysis, and fault tree analysis. Expert investigation predicts risks by summing up expert opinions [20]. Process analysis tends to explore the risk factors of each link in the manufacturing cycle of the product [21]. Casual analysis explores deep into the correlation between causes and results of risk events, and applies to simple production systems of SMEs [22]. Fault tree analysis reasons about the causes of risk events in the form of a tree diagram [23].
After being accurately identified, the SC quality risks can be evaluated reasonably. Klein et al. [24] constructed an evaluation index system (EIS) for the risks in prefabricated buildings based on fuzzy analytic network process (F-ANP), and realized accurate risk evaluation and prediction by combining the entropy weight method with neural network. Mahajan and Diatha [25] integrated correlation analysis with Monte Carlo simulation, set up an EIS for corporate strategic risks, and established a fuzzy comprehensive evaluation (FCE) model, covering such four aspects as innovation capability, corporate culture, external environment, and internal resources. Cockx et al. [26] identified and evaluated the quality chain risks of each link in the production cycle of manufacturing enterprises, and built an evaluation model based on the analytic hierarchy process (AHP) and system factor analysis.
The SC systems of IM enterprises are usually large and complex, involving multiple suppliers. If the quality risk identification framework is not clear enough, it will be very difficult to identify product quality risks. The relevant literature mostly tackles quality risk probability and loss evaluation, and evaluates quality risks by traditional methods like FCE and gray correlation analysis. Therefore, the evaluation and sorting of quality risks are not sufficient accurate.
The sustained cooperation is the prerequisite for long-term benefit sharing among manufacturers, suppliers, and retailers. The products of most IM enterprises often encompass various parts. To effectively improve the SC efficiency of IM enterprises, the supply-demand information from each production line to suppliers at all levels could be shared through the mobile supply chain (MSC).
To evaluate the quality risks of enterprises in a highly operable, suitable, and effective manner, this paper analyzes the factors affecting the quality risks of IM MSC, and establishes the relevant evaluation model. Based on the basic natural environment and resource conditions, Section 2 presents an identification framework for IM MSC quality risks, from the perspective of the quality chain, constructs a hierarchical EIS for quality risks based on the influencing factors, and describes the features of quality risks with intuitive triangular fuzzy numbers. Section 3 creates a quality risk evaluation model for IM MSC based on backpropagation neural network (BPNN). After accurate evaluation of quality risks, Section 4 designs a contract model for quality risk control in IM MSC, according to the contract theory and the features of MSC. Finally, the proposed EIS and models were proved effective through experiments.
2.1 Identification Framework and EIS
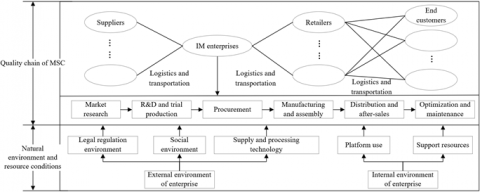
In IM enterprises, the production cycle lasts long, and the manufacturing process has a high complexity, involving many quality formation links. With the development of the Internet and the Internet of Things (IoT), the traditional mode of individual IM production has gradually shifted towards the collaborative production mode of SC. Meanwhile, the focus of its product quality monitoring and management has moved from the internal of the enterprise to the SC parties. In other words, the product quality of an IM enterprise that adopts the MSC depends on the internal quality supervision of the enterprise, as well as the quality supervision by MSC parties. The natural environment and resources are the foundation and support for the operation of IM MSC, which constrain and pressurize MSC parties. Therefore, this paper sets up a quality risk identification framework for IM MSC based on natural environment and resource conditions, from the perspective of quality chain (see Figure 1).
Figure 1. The identification framework for IM MSC quality risks
Note: R&D is short for research and development.
IM MSC quality risks are transferrable, poorly recognizable, and harmful, with a certain time lag. Through the MSC operation, the quality risks of IM enterprise products will be transmitted, transformed, concealed, accumulated, and interactive.
Therefore, it is crucial to identify the factors affecting the quality risks in a scientific and reasonable manner. Otherwise, the quality risks cannot be identified or evaluated accurately. This paper designs a scientific, systematic, comprehensive, and hierarchical EIS for quality risks based on the influencing factors. The EIS divides quality risks into four dimensions: natural environment and resource conditions, SC parties involved in quality formation, quality formation process, and MSC financial risks:
Layer 1 (dimensions of quality risks)
QR={QR1, QR2, QR3, QR4}={natural environment and resource conditions, SC parties involved in quality formation, quality formation process, MSC financial risks}
Specifically, QR1 and QR4 reflect the basic environment and economic background of MSC, respectively; QR2 and QR3 correspond to the quality chain of MSC. The four dimensions jointly characterize how much different enterprises on the quality chain, and different quality formation processes influence the quality risks of final IM products. Under each dimensions, detailed risk items were designed as follows:
Layer 2 (quality risks)
QR1={QR11, QR12, QR13, QR14}={support resources risk, social environment risk, supply and processing technology risk, legal regulation risk}
QR2={QR21, QR22, QR23, QR24}={supplier risk, logistics company risk, retailer risk, final product risk}
QR3={QR31, QR32, QR33, QR34, QR35, QR36}={market research risk, R&D and trial production risk, procurement risk, manufacturing and assembly risk, distribution and after-sales risk, optimization and maintenance risk}
QR4={QR41, QR42, QR43}={MSC platform technology risk, MSC platform payment risk, MSC platform supervision risk}
For each risk item, several driving factors were designed as the metrics of quality risk identification and evaluation:
Layer 3 (influencing factors of quality risks)
QR11={QR111, QR112, QR113, QR114}={talent quality risk, infrastructure risk, working condition risk, natural resource utilization rate}
QR12={QR121, QR122, QR123}={industrial policy adjustment risk, market operation mechanism risk, public opinion risk}
QR13={QR131, QR132, QR133, QR134}={technology introduction risk, technology adaptation and conversion risk, technology maturity risk, technology proficiency risk}
QR14={QR141, QR142, QR143, QR144}={legal supervision risk, quality inspector risk, quality standard level risk, penalty intensity risk}
QR21={QR211, QR212, QR213}={raw materials or parts risk, delayed delivery risk, out of stock risk}
QR22={QR221, QR222}={untimely transportation risk, in-transit damage risk}
QR23={QR231, QR232}={after-sales quality risk, sales strategy risk}
QR24={QR241, QR242}={utilization method risk, user maintenance risk}
QR31={QR311, QR312, QR313, QR314}={survey scope risk, survey information accuracy risk, market analysis accuracy risk, demand analysis accuracy risk}
QR32={QR321, QR322, QR323, QR324}={R&D and trial production planning risk, R&D and trial production input risk, R&D and trial production output risk, R&D and trial production review risk}
QR33={QR331, QR332, QR333, QR334}={procurement plan risk, supplier selection risk, procurement contract formulation risk, product acceptance risk}
QR34={QR341, QR342, QR343, QR344}={manufacturing and assembly preparation risk, manufacturing and assembly capability risk, manufacturing and assembly process risk, manufacturing and assembly environment risk}
QR35={QR351, QR352, QR353}={packaging risk, after-sales risk, after-sales response and feedback risk}
QR36={QR341, QR362, QR363}={product quality control risk, product repair risk and customer relationship maintenance risk, product continuous optimization risk}
QR41={QR411, QR412, QR413}={platform operational capability risk, software and hardware security risk, data transmission security risk}
QR42={QR421, QR422, QR423}={payment information security risk, participating enterprise privacy security risk, payment method security risk}
QR43={QR431, QR432, QR433}={supervision system risk, supervision personnel risk}
2.1 Features of quality risks
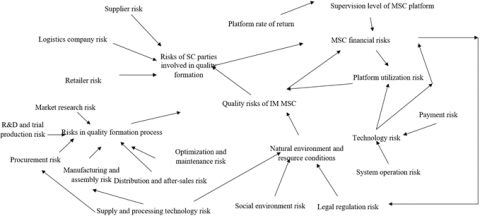
During the identification and evaluation of IM MSC quality risks, it is difficult to quantify the risk features, owing to the multiple dimensions of the influencing factors. Figure 2 presents the causality between multiple dimensions of quality risks. To eliminate the effect of subjectivity of the evaluators, this paper converts the descriptions of risk features into intuitive triangular fuzzy numbers: ITF=([x,y,z];μITF,γITF), where μITF is the membership, and γITF is the non-membership. The membership function and non-membership function can be respectively expressed as:
${{\mu }_{ITF}}\left( i \right)=\left\{ \begin{align} & \frac{i-x}{y-x}{{\mu }_{ITF}},a\le i<y \\ & \frac{z-i}{z-y}{{\mu }_{ITF}},y\le i\le z \\ & 0 , others \\\end{align} \right.$ (1)
${{\gamma }_{ITF}}\left( i \right)=\left\{ \begin{align} & \frac{y-i+v_{p}^{\tilde{\ }}\left( i-x \right)}{y-x},x\le i<y \\ & \frac{i-y+v_{p}^{\tilde{\ }}\left( z-i \right)}{z-y},y\le i\le z \\ & 0 , others \\\end{align} \right.$ (2)
Figure 2. The causality between multiple dimensions of quality risks
Specifically, μITF and γITF mean the evaluator agrees or disagrees with the evaluation result; 1-μITF-γITF reflects the degree of hesitation θITF of the evaluator in giving the evaluation result. The greater the θITF value, the more uncertain the evaluator is about his/her evaluation result. The triangular fuzzy number [x,y,z] that characterizes the eigenvalue of quality risks can be converted from the level of quality risk features. The natural language describing the evaluation level of quality risk features can be transformed into the following triangular fuzzy number [xk,yk,zk]:
$\left\{ \begin{align} & {{x}_{0}}=0 \\ & {{x}_{j}}=\frac{j-1}{k-1} (1\le j\le k-1) \\ & {{y}_{j}}=\frac{j}{k-1} \left( 0\le j\le k-1 \right) \\ & {{z}_{j}}=\frac{j+1}{k-1} \left( 0\le j\le k-2 \right) \\ & {{z}_{j-1}}=1 \\\end{align} \right.$ (3)
When k takes different values, the transformation equation of triangular fuzzy number can be obtained for quality risk features on each evaluation level. Here, the quality risk features of IM MSC were divided into 7 levels. The levels, attributes, and triangular fuzzy numbers of the four dimensions of quality risks are listed in Table 1.
Table 1. The levels and attributes of quality risk features
|
Fuzzy level |
Natural language description |
Risk probability |
Risk loss |
Predictability and controllability |
Triangular fuzzy numbers |
|
1 |
Strongly low risk |
Strongly small |
Strongly small |
Predictable and controllable |
(0,0,0.18) |
|
2 |
Moderately low risk |
Moderately small |
Moderately small |
Easy to predict and control |
(0,0.18,0.34) |
|
3 |
Slightly low risk |
Slightly small |
Slightly small |
Easy to predict and control |
(0.18,0.34,0.5) |
|
4 |
Neutral |
Neutral |
Neutral |
General |
(0.34,0.5,0.68) |
|
5 |
Slightly high risk |
Slightly large |
Slightly large |
Not easy to predict and control |
(0.5,0.68,0.84) |
|
6 |
Moderately high risk |
Moderately large |
Moderately large |
Not easy to predict and control |
(0.68,0.84,1) |
|
7 |
Strongly high risk |
Strongly large |
Strongly large |
Unpredictable, uncontrollable |
(0.84,1,1) |
This paper combines the entropy method and the intuitionistic fuzzy entropy to determine the weight of each quality risk feature. By the entropy method, the evaluation result of quality risk q under influencing factor p, and the corresponding expected triangular fuzzy number can be solved by:
${{e}_{pq}}=\frac{{{x}_{pq}}+2{{y}_{pq}}+{{z}_{pq}}}{4}$ (4)
The entropy of the feature μp of quality risk p can be expressed as:
${{E}_{p}}=-\frac{\sum\limits_{q=1}^{N}{\frac{{{d}_{qp}}}{\sum\limits_{i=1}^{N}{{{d}_{qp}}}}\ln \left( \frac{{{d}_{qp}}}{\sum\limits_{q=1}^{N}{{{d}_{qp}}}} \right)}}{\ln N}$ (5)
The corresponding entropy weight ωp can be expressed as:
${{\omega }_{p}}=\frac{1-{{E}_{p}}}{\sum\limits_{p=1}^{M}{\left( p-{{E}_{p}} \right)}}$ (6)
When the quality risk feature is weighed by intuitionistic fuzzy entropy, the intuitionistic fuzzy entropy of μp can be expressed as:
$E_{p}^{*}=\frac{1}{N}\sum\limits_{p=1}^{N}{\frac{\min \left( {{\mu }_{qp}},\text{ }{{\gamma }_{qp}} \right)+{{\theta }_{qp}}}{\max \left( {{\mu }_{qp}},\text{ }{{\gamma }_{qp}} \right)+{{\theta }_{qp}}}}$ (7)
The larger the Ep*, the greater the fuzziness of the evaluation results on μp under influencing factor p, and the larger the weight of the corresponding quality risk feature. The corresponding entropy weight ωp* can be expressed as:
$\omega _{p}^{*}=\frac{1-E_{p}^{*}}{M-\sum\limits_{p=1}^{M}{E_{p}^{*}}}$ (8)
Combining ωp and ωp* with geometric mean, the final weight can be obtained as:
${{\hat{\omega }}_{p}}=\frac{\sqrt{{{\omega }_{p}}\omega _{p}^{*}}}{\sum\limits_{p=1}^{M}{\sqrt{{{\omega }_{p}}\omega _{p}^{*}}}}$ (9)
Figure 3. The workflow of the comprehensive evaluation process
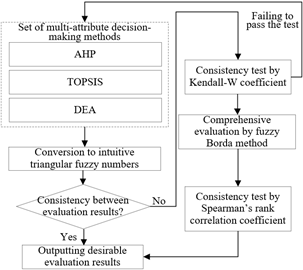
The proposed IM MSC quality risk evaluation model was designed based on three multi-attribute decision-making methods, namely, AHP, technique for order preference by similarity to ideal solution (TOPSIS), and data envelopment analysis (DEA). The quality risk evaluation results obtained by the three methods were converted into intuitive triangular fuzzy numbers. After passing the consistency test of Kendall’s Concordance (W) Coefficient, the three quality risk evaluation results were comprehensively evaluated by fuzzy Borda method. Figure 3 shows the workflow of the comprehensive evaluation process of the proposed model.
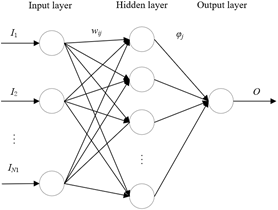
Figure 4. The structure of the BPNN-based evaluation model
This paper constructs a three-layer BPNN-based evaluation model. As shown in Figure 4, the model consists of an input layer, a hidden layer, and an output layer. The number N1 of input layer nodes depends on the number of evaluation indices for IM MSC quality risks. Since there are 55 tertiary indices (influencing factors), the N1 value was set to 55. The number of output layer nodes N3 depends on the form of evaluation results. As mentioned before, the evaluation result on IM MSC quality risks falls on one of the 7 levels. Thus, the output layer only needs to have 1 node. The number N2 of hidden layer nodes should be configured based on learning rate and network complexity, without sacrificing the fitting accuracy. The empirical formula of N2 can be expressed as:
$\left\{ \begin{matrix} {{N}_{2}}=\sqrt{{{N}_{1}}{{N}_{3}}} \\ {{N}_{2}}=\sqrt{{{N}_{1}}+{{N}_{3}}}+\varepsilon \\ {{N}_{2}}=\text{lo}{{\text{g}}_{2}}{{N}_{1}} \\\end{matrix} \right.$ (10)
where, ε is a constant between 0 and 10. The hidden layer adopts the sigmoid function as the activation function:
$\text{sigmoid}\left( x \right)=\frac{1}{1+{{e}^{-x}}}$ (11)
$\begin{align} & \text{sigmoi{d}'}\left( x \right)=\frac{\delta {{e}^{-\delta x}}}{{{\left( 1+{{e}^{-\delta x}} \right)}^{2}}} \\ & \text{ }=\delta \cdot \text{sigmoid}\left( x \right)\cdot \left[ 1-\text{sigmoid}\left( x \right) \right]\text{ } \\\end{align}$ (12)
The linear transfer function purelin was chosen as the connection function between hidden and output layers:
${{h}_{j}}=sigmoid\left( \sum\limits_{i=1}^{{{N}_{1}}}{{{\omega }_{ij}}{{I}_{i}}-{{b}_{j}}} \right)\text{ }$ (13)
where, bj is the hidden layer bias that adjusts the function. The output of the output layer can be expressed as:
$O=\text{purelin}\left( \sum\limits_{j=1}^{{{N}_{2}}}{{{\phi }_{j}}{{h}_{j}}-b} \right)\text{ }$ (14)
where, b is the output layer bias. The network error can be calculated by:
$error=\frac{{{\left( O-{O}' \right)}^{2}}}{2}$ (15)
where, O' is the expected error of quality risk evaluation. Through the iteration of weights, the network error can be minimized to meet the requirement on the desired evaluation result on quality risks. The BPNN was trained iteratively with the trainlim function in the Levenberg-Marquardt (L-M) algorithm, which features fast convergence and few steps. Figure 5 presents the workflow of the proposed BPNN-based evaluation model.
Figure 5. The workflow of the proposed BPNN-based evaluation model
IM MSC quality risks may arise in various links, ranging from the supply of raw materials and parts, manufacturing, transportation, warehousing, mobile marketing to after-sales. The traditional mode, which monitors and manages the quality of a single IM enterprise or marketing platform, cannot control the quality risks of the entire MSC. Drawing on the contract theory, the quality risks were controlled from the angle of MSC after they have been accurately evaluated. The relevant parameters were configured as follows:
In the contract model, variable g represents the quality level of raw materials and parts provided by MSC; UCSC(g) is the unit cost of the MSC to make the quality of raw materials and parts reach a certain level; ζ is the probability of defected products; UCE(ζ) is the cost of the IM enterprise to ensure the level of product quality inspection; z is the level of quality control effort of the IM enterprise; UCE(z) is the unit cost of the IM enterprise to make product quality reach a certain level; cRMi is the unit price of raw materials or parts; cP is the sales price of IM enterprise products; L1 is the internal loss induced by production delay and selection of new supplier; L2 is the additional loss of reputation and claims caused by the sales of defected products; λ is the probability of claims; λ[(1-g)(1-ζ)+g(1-z)] is the probability of additional loss. Then, the revenues functions of MSC supplier and IM enterprise can be respectively established as:
$\left\{ \begin{align} & \prod{_{SC}=\sum\limits_{i=1}^{K}{{{c}_{RMi}}}[1-\zeta (1-g)]-\zeta (1-g)\rho {{L}_{1}}-\lambda [(1-g)(1-\zeta )+g(1-z)]\beta ({{c}_{P}}+{{L}_{2}})-U{{C}_{SC}}(g)} \\ & \prod{_{E}=\sum\limits_{i=1}^{K}{({{c}_{P}}-{{c}_{RMi}})}[1-\zeta (1-g)]-\zeta [(1-g)(1-\zeta ){{L}_{1}}-\lambda [(1-g)(1-\zeta )+g(1-z)](1-\beta )({{c}_{P}}+{{L}_{2}})-U{{C}_{E}}(\zeta )-U{{C}_{E}}(z)} \\\end{align} \right.$ (16)
Considering the possibility of the unilateral moral hazard of MSC supplier, the supplier must ensure its retained revenue under the risk control constraints. To maximize its revenue, the IM enterprise needs to control the product quality inspection at the optimal level. Then, formula (16) can be converted into the Lagrangian form:
$\begin{align} & \Phi =\sum\limits_{i=1}^{K}{({{c}_{P}}-{{c}_{RMi}})}[1-\zeta (1-g)]-\zeta (1-g)(1-\rho ){{L}_{1}}\text{-}\lambda [(1-g)(1-\zeta )+g(1-z)](1-\beta )({{c}_{P}}+{{L}_{2}})-U{{C}_{E}}(\zeta )-U{{C}_{E}}(z) \\ & \text{ }+\tau \{\sum\limits_{i=1}^{K}{{{c}_{RMi}}}[1-\zeta (1-g)]-\zeta (1-g)\rho {{L}_{1}}-\lambda (1-g)(1-\zeta )+g(1-z)]\beta ({{c}_{P}}+{{L}_{2}})-U{{C}_{SC}}(g)-U{{C}_{0}}\} \\ & \text{ }+\upsilon [\sum\limits_{i=1}^{K}{{{c}_{RMi}}}\zeta +\rho {{L}_{1}}\zeta -\beta \lambda (\zeta -z)({{c}_{P}}+{{L}_{2}})-U{{{{C}'}}_{SC}}(g)]=\prod{_{SC}+\tau (}\prod{_{E}-U{{C}_{0}})+\upsilon \frac{\partial \prod{_{SC}}}{\partial g}} \\\end{align}$ (17)
where, τ is the Lagrangian factor for MSC to obey the risk control constraints; υ is the Lagrangian factor for the incentive compatible constraint of the IM enterprise. Taking the partial derivatives of the loss risk sharing ratios β and ρ of the supplier and IM enterprise and making them equal to zero:
$\begin{align} & \frac{\partial \Phi }{\partial \beta }=(1-\tau )\lambda ({{c}_{P}}+{{L}_{2}})[(1-g)(1-\zeta )+g(1-z)] \\ & \text{ }-\upsilon \lambda (\zeta -z)({{c}_{P}}+{{L}_{2}})=0 \\\end{align}$ (18)
$\frac{\partial \Phi }{\partial \rho }=(1-\tau )\zeta (1-g){{L}_{1}}+\upsilon \zeta {{L}_{1}}=0$ (19)
Then, formulas (18) and (19) were solved, and the solutions were substituted into the Lagrangian function. Next, finding the first-order partial derivatives of g, ζ, and z and making them equal to zero:
$\left\{ \begin{align} & \frac{\partial \Phi }{\partial g}=({{c}_{P}}+{{L}_{1}})\zeta -\lambda (\zeta -z)({{c}_{P}}+{{L}_{2}})-U{{{{C}'}}_{SC}}(g)=0 \\ & \frac{\partial \phi }{\partial \zeta }=(1-g)[\lambda ({{c}_{P}}+{{L}_{2}})-({{c}_{P}}+{{L}_{1}})]-U{{{{C}'}}_{E}}(\zeta )=0 \\ & \frac{\partial \phi }{\partial z}=\lambda ({{c}_{P}}+{{L}_{2}})g-U{{{{C}'}}_{E}}(z)=0 \\\end{align} \right.$ (20)
To maximize the overall benefits of MSC, the risk control constraints for the MSC supplier was converted into an equation, and combined with the incentive compatible constraint of the IM enterprise:
$\left\{ \begin{matrix} {{c}_{P}}[1-\zeta (1-g)]\text{-}\zeta (1-g)\rho {{L}_{1}}-\lambda [(1-g)(1-\zeta )+g(1-z)]\beta ({{c}_{P}}+{{L}_{2}})-U{{C}_{SC}}(g)=U{{C}_{0}} \\ {{c}_{P}}\zeta +\rho \zeta {{L}_{1}}\text{-}\beta \lambda (\zeta -z)({{c}_{P}}+{{L}_{2}})-U{{{{C}'}}_{SC}}(g)=0\text{ } \\\end{matrix} \right.$ (21)
Solving ρ, and β:
$\left\{ \begin{matrix} \beta =\frac{{\sum\limits_{i=1}^{K}{{{c}_{RMi}}}}/{K}\;\text{-}U{{{{C}'}}_{SC}}(g)(1-g)-U{{C}_{SC}}(g)-U{{C}_{0}}}{\lambda (1-z)({{c}_{P}}+{{L}_{2}})}\text{ } \\ \rho =\frac{{(\zeta -1)z\sum\limits_{i=1}^{K}{{{c}_{RMi}}}}/{K}\;-[(1-g)(\zeta -z)+(z-1)]U{{{{C}'}}_{SC}}(g)-(\zeta -z)[U{{C}_{SC}}(g)+U{{C}_{0}}]}{\zeta (1-z){{L}_{1}}} \\\end{matrix} \right.$ (22)
Under the risk control contract, the internal and external losses of the MSC are shared by the supplier and the IM enterprise. As long as the β value is reasonable, the overall benefits of the SC will be optimized, and the IM MSC quality risks can be effectively controlled.
To verify its effect in comprehensive evaluation, the proposed quality risk evaluation model for IM MSC was applied to actual enterprises. Table 2 presents the evaluation results by three multi-attribute decision-making methods, namely, AHP, TOPSIS, and DEA. The Spearman’s rank correlation coefficients of the three methods were 0.891, 0.827, and 0.845, respectively. The test statistic was calculated as 5.347, which is greater than that under the preset significance level. Therefore, the evaluation results of comprehensive evaluation method agree with those of single multi-attribute decision-making methods. This validates the effectiveness of the proposed comprehensive evaluation strategy.
Table 2. The quality risk evaluation based on the set of multi-attribute decision-making methods
|
Evaluation of quality risks based on influencing factors |
|||||
|
Dimensions of quality risks |
QR1 |
QR2 |
QR3 |
QR4 |
|
|
AHP |
AHP risk |
0.237 |
0.389 |
0.391 |
0.254 |
|
Accuracy |
0.169 |
0.424 |
0.278 |
0.125 |
|
|
TOPSIS |
Positive ideal risk |
0.422 |
0.228 |
0.239 |
0.365 |
|
Negative ideal risk |
0.116 |
0.257 |
0.319 |
0.270 |
|
|
Hamming distance |
0.219 |
0.552 |
0.548 |
0.441 |
|
|
DEA |
Positive ideal risk |
0.423 |
0.384 |
0.397 |
0.414 |
|
Negative ideal risk |
0.299 |
0.321 |
0.276 |
0.253 |
|
|
Malmquist index |
0.687 |
0.542 |
0.662 |
0.637 |
|
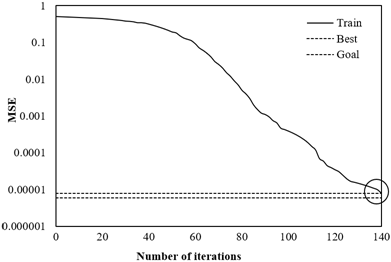
The convergence curve (Figure 6) of the proposed BPNN-based evaluation model was analyzed to verify its ability to process the data on the evaluation indices for IM MSC quality risks. As shown in Figure 6, the network error reached the preset level after the proposed model had been trained for 140 iterations. The model achieved fast convergence, while satisfying the required output accuracy.
Table 3 displays the results of our model on 10 sets of data on evaluation indices, which serve as the test samples for model accuracy and stability. The predicted risk level of each set was compared with the expected level. It can be seen that the predicted level was consistent with the expected level on every set, except for set 6. Then, the evaluated value of quality risks was compared with the predicted value. The mean relative error on the 10 sets was 5.08%, and the absolute error was controlled below 0.01. The results prove that our model has high fitness and reliability in risk evaluation, and can be directly applied to evaluate quality risks of IM MSC.
Figure 6. The convergence curve of the BPNN-based evaluation model
Note: MSE is short for mean squared error
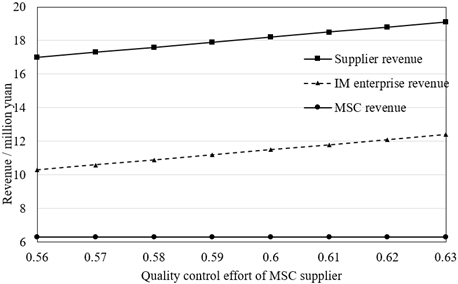
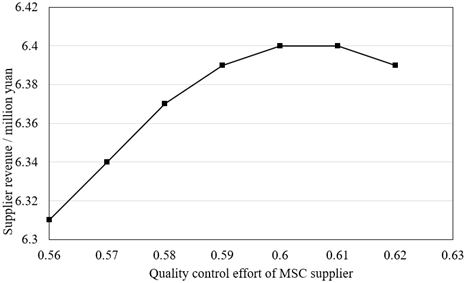
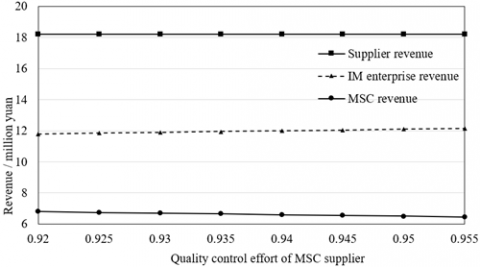
Furthermore, the proposed contract model for IM MSC quality risk control was analyzed on actual examples. The quality control effort of MSC supplier and product quality inspection of IM enterprise were subject to sensitivity analysis. Figures 7 and 8 show the influence of the quality control effort of MSC supplier on the revenues of the supplier, IM enterprise, and the MSC; Figure 9 show the influence of product quality inspection of IM enterprise the revenues.
Table 3. The output results of BPNN
|
Set number |
Expected risk |
Risk level |
Training output |
Predicted level |
Absolute error |
Relative error (%) |
|
1 |
0.5257 |
4 |
0.5225 |
4 |
0.0032 |
6.08% |
|
2 |
0.2444 |
2 |
0.2459 |
2 |
-0.0015 |
-6.13% |
|
3 |
0.3166 |
2 |
0.3147 |
2 |
0.0019 |
6.00% |
|
4 |
0.4672 |
4 |
0.4669 |
4 |
0.0003 |
0.64% |
|
5 |
0.1165 |
1 |
0.1156 |
1 |
0.0090 |
7.70% |
|
6 |
0.7888 |
6 |
0.7840 |
7 |
0.0048 |
6.08% |
|
7 |
0.2792 |
3 |
0.2784 |
3 |
0.0008 |
2.86% |
|
8 |
0.6884 |
6 |
0.6826 |
6 |
0.0058 |
8.42% |
|
9 |
0.2642 |
3 |
0.2650 |
3 |
-0.0008 |
-3.02% |
|
10 |
0.5621 |
5 |
0.5643 |
5 |
-0.0022 |
-3.91% |
Figure 7. The influence of the quality control effort of MSC supplier on revenues
Figure 8. The influence of the quality control effort of MSC supplier on supplier revenue
Figure 9. The influence of product quality inspection of IM enterprise on revenues
As shown in Figures 7 and 8, the revenues of IM enterprise, MSC supplier, and the MSC increased gradually with the growing quality control effort of MSC supplier. The increment of the first two revenues was larger than that of the MSC revenue. The supplier revenue reached the maximum, when its quality control effort fell within 0.6-0.61. Further growth in the effort would gradually suppress the supplier revenue. But in this effort range, the IM enterprise revenue and MSC revenue did not reach the maximum yet. If the MSC supplier reduces its quality control effort, all three revenues will decline. Thus, the MSC supplier must strive to maintain the effort at the level that optimizes the three revenues. These results confirm that the proposed contract model, which require the supplier and the IM enterprise to share the internal and external losses, can effectively control the quality risks of the supplier.
As shown in Figure 9, the revenues of IM enterprise and the MSC gradually increased with the product quality inspection of that enterprise, while the MSC supplier revenue gradually decreased. If the IM enterprise relaxes the product quality inspection, the MSC supplier will make more profit, but the enterprise and the MSC will witness revenue reduction. Thus, the IM enterprise must strive to maintain the inspection at the level that optimizes the three revenues. These results confirm that the proposed contract model can effectively control the quality inspection risk of the IM enterprise.
This paper probes deep into the influencing factors and evaluation model of IM MSC quality risks. Firstly, the authors constructed an identification framework for IM MSC quality risks, and a hierarchical EIS for quality risks based on the influencing factors. Meanwhile, the quality risk features were divided into four dimensions, and the attributes and triangular fuzzy numbers of each dimension were specified. Then, a comprehensive evaluation strategy was designed based on a set of three multi-attribute decision-making methods, and proved valid through experiments. On this basis, a BPNN-based evaluation model was established for IM MSC quality risks. Through experiments, the model was proved to have high fitness and reliability in risk evaluation, and can be directly applied to evaluate quality risks of IM MSC. After completing the evaluation of IM MSC quality risks, the authors designed a contact model to control IM MSC quality risks, which requires MSC supplier and IM enterprise to share the internal and external losses of the MSC. Experimental results show that the contract model can effectively control the risks in supplier’s product quality and the IM enterprise’s quality inspection.
[1] Avinadav, T., Chernonog, T., Perlman, Y. (2015). The effect of risk sensitivity on a supply chain of mobile applications under a consignment contract with revenue sharing and quality investment. International Journal of Production Economics, 168: 31-40. https://doi.org/10.1016/j.ijpe.2015.05.036
[2] Jahani, H., Alavifard, F., Ivanov, D., Ghasemishabankareh, B. (2019). Managing the risk of supply chain bankruptcy in supply chain network redesign. IFAC-PapersOnLine, 52(13): 2431-2436. https://doi.org/10.1016/j.ifacol.2019.11.571
[3] Mahmud, M., Kamarulzaman, N.H. (2020). Seaweed supply chain risk identification in Sabah using fuzzy failure mode and effect analysis. IOP Conference Series: Earth and Environmental Science, 549(1): 012096. https://doi.org/10.1088/1755-1315/549/1/012096
[4] Yoon, J., Talluri, S., Rosales, C. (2020). Procurement decisions and information sharing under multi-tier disruption risk in a supply chain. International Journal of Production Research, 58(5): 1362-1383. https://doi.org/10.1080/00207543.2019.1634296
[5] Prakash, S., Aggarwal, G., Gupta, A., Soni, G. (2019). An empirical analysis of supply chain risk and uncertainty in manufacturing sector to achieve robustness. International Conference on Recent Developments in Science, Engineering and Technology Gurugram, India, pp. 355-364. https://doi.org/10.1007/978-981-15-5827-6_31
[6] Hosseini-Motlagh, S.M., Samani, M.R.G., Homaei, S. (2020). Blood supply chain management: robust optimization, disruption risk, and blood group compatibility (a real-life case). Journal of Ambient Intelligence and Humanized Computing, 11(3): 1085-1104. https://doi.org/10.1007/s12652-019-01315-0
[7] Kuswardhani, N., Yulian, N.F. (2019). Supply chain risk potential of smallholder Robusta coffee farmers in Argopuro mountain area. IOP Conference Series: Earth and Environmental Science, 250(1): 012061. https://doi.org/10.1088/1755-1315/250/1/012061
[8] Challener, C.A. (2018). Managing risk in a complex excipient supply chain. Pharmaceutical Technology, 42(2): 36-41.
[9] Getele, G.K., Li, T., Arrive, J.T. (2019). Risk management in the service supply chain: Evidence from the Healthcare Sector. IEEE Engineering Management Review, 47(4): 143-152. https://doi.org/10.1109/EMR.2019.2933512
[10] Tama, I.P., Yuniarti, R., Eunike, A., Hamdala, I., Azlia, W. (2019). Risk identification in cassava chip supply chain using SCOR (supply chain operation reference). IOP Conference Series: Materials Science and Engineering, 494(1): 012050. https://doi.org/10.1088/1757-899X/494/1/012050
[11] Widodo, K.R. (2018). Risk mitigation for fresh raw-milk in the rural supply chain. 2018 4th International Conference on Science and Technology (ICST), Yogyakarta, pp. 1-4. https://doi.org/1109/ICSTC.2018.8528284
[12] Munir, M., Jajja, M.S.S., Chatha, K.A., Farooq, S. (2020). Supply chain risk management and operational performance: The enabling role of supply chain integration. International Journal of Production Economics, 227: 7667. https://doi.org/10.1016/j.ijpe.2020.107667
[13] Mustaniroh, S.A., Murod, F.A.I.K., Silalahi, R.L.R. (2020). The risk assessment analysis of corn chips supply chain using Fuzzy FMEA. IOP Conference Series: Earth and Environmental Science, 75(1): 012052. https://doi.org/10.1088/1755-1315/475/1/012052
[14] Rishelin, N., Ardi, R. (2020). Halal supply chain risk in Indonesian downstream sector. Proceedings of the 3rd Asia Pacific Conference on Research in Industrial and Systems Engineering 2020, New York, United States, pp. 266-271. https://doi.org/10.1145/3400934.3400983
[15] Esterman, M., Palekar, S., Conway, F., Ehmann, J., Limcharoen, V. (2020). Toward robust concurrent product development across the supply chain: A risk assessment framework. Journal of Engineering Design, 31(3): 150-177. https://doi.org/10.1080/09544828.2019.1685659
[16] Citraresmi, A.D.P., Rahmawati, F. (2020). Risk measurement of supply chain for soy sauce product. IOP Conference Series: Earth and Environmental Science, 475(1): 012058. https://doi.org/10.1088/1755-1315/475/1/012058
[17] Kharisma, S.A., Ardi, R. (2020). A preliminary phase of supply chain risk management: generic medicines in Indonesia. Proceedings of the 3rd Asia Pacific Conference on Research in Industrial and Systems Engineering 2020, Depok, Indonesia, pp. 367-373. https://doi.org/10.1145/3400934.3401001
[18] Bicer, I., Hagspiel, V. (2016). Valuing quantity flexibility under supply chain disintermediation risk. International Journal of Production Economics, 180, 1-15. https://doi.org/10.1016/j.ijpe.2016.06.021
[19] Troche-Escobar, J.A., Freires, F.G.M. (2020). Stakeholders assessment for risk management into the wind power supply chain. International Joint conference on Industrial Engineering and Operations Management, Rio de Janeiro, Brazil, pp. 477-489. https://doi.org/10.1007/978-3-030-56920-4_39
[20] Mohib, A.M., Deif, A.M. (2020). Supply chain multi-state risk assessment using universal generating function. Production Planning & Control, 31(9): 699-708. https://doi.org/10.1080/09537287.2019.1680891
[21] Lee, B.K., Zhou, R., de Souza, R., Park, J. (2016). Data-driven risk measurement of firm-to-firm relationships in a supply chain. International Journal of Production Economics, 180: 148-157. https://doi.org/10.1016/j.ijpe.2016.07.025
[22] Tran, T.T.H., Childerhouse, P., Deakins, E. (2016). Supply chain information sharing: challenges and risk mitigation strategies. Journal of Manufacturing Technology Management, 27(8): 1102-1126. https://doi.org/10.1108/JMTM-03-2016-0033
[23] Mohajeri, A., Fallah, M. (2016). A carbon footprint-based closed-loop supply chain model under uncertainty with risk analysis: A case study. Transportation Research Part D: Transport and Environment, 48: 425-450. https://doi.org/10.1016/j.trd.2015.09.001
[24] Klein, A.Z., Da Costa, E.G., Vieira, L.M., Teixeira, R. (2014). The use of mobile technology in management and risk control in the supply chain: the case of a Brazilian beef chain. Journal of Global Information Management (JGIM), 22(1): 14-33. https://doi.org/10.4018/jgim.2014010102
[25] Mahajan, S., Diatha, K.S. (2019). On supply chain contracts as risk sharing mechanisms. International Journal of Industrial and Systems Engineering, 32(2): 170-183. https://doi.org/10.1504/IJISE.2019.100162
[26] Cockx, R., Armbruster, D., Bendul, J.C. (2019). Resource sharing as supply chain disruption risk management measure. IFAC-PapersOnLine, 52(13): 802-807. https://doi.org/10.1016/j.ifacol.2019.11.228