Mohammad Alfraheed![]()
© 2024 The author. This article is published by IIETA and is licensed under the CC BY 4.0 license (http://creativecommons.org/licenses/by/4.0/).
OPEN ACCESS
Showing the mammogram images in different view enables the radiological to recognize more early details about the cancer tumour. The synthetic view was addressed to find the overlapping among the overlapped structural information of the x-ray breast mammography images. The details of the proposed method to produce a synthetic mammography image using the x-ray breast cancer mammogram images from each CranioCaudual (CC) and MedioLateral-Oblique (MLO) view have been introduced in this article. There are five phases to the proposed method. In the first phase, the cancer tumor has been identified in the full-field x-ray mammography images. The cancerous tumor has been secondly recognized and highlighted as a region of interest. A technique to collect data from the cancer tumor and identify the areas of interest on the cancer mass has been discussed in the third phase. In the fourth phase, formatting the points of interest within the context of advanced features has been implemented. The final phase demonstrates how to execute the synthetic digital process using the supervised learning methodology. Several contributions have been presented based on the proposed method, which are facilitate the computer aided detection application in context of the digital breast Tomosynthesis. Compared with other method, the proposed method has shown its ability to save memory and running time resources. Beside of the digital synthetic view, the proposed method was detected the breast tumour in x-ray breast mammography images.
x-ray mammography images, digital breast tomosynthesis, synthetization view, supervised learning technique, breast cancer
Digital Breast Tomosynthesis (DBT), defined as a mammographic technique, is significant in breast cancer diagnostics due to its potential to raise cancer detection rates [1]. The DBT provides more accurate screening measures than digital mammography [1, 2]. The DBT is made up of a set of tomosynthesis images that are combined together to provide synthetic 2D reconstruction images conforming of the standard MLO and CC views of each breast. Consequently, the goal of the 2D synthetic mammography images is to remove tissue overlaps and maximize lesion conspicuity [3]. However, certain issues have surfaced, including a high radiation exposure, and lengthening the patient's testing period. Utilizing digital breast mammography to generate a digital breast tomosynthesis is one of the techniques recommended.
Applying supervised deep learning algorithms improves the digital mammography breast cancer detection rates [4]. Such limiting challenges have a detrimental impact on the detection rate [5], since the training stage of the deep learning approaches demands a big and variety labeled data for cancer breast mammography images [6]. Synthesizing diverse feature samples based on digital breast mammography images is the recommended solution. In addition to providing a variety of breast masses, the produced digital breast tomography also enhances the scanning reading of these masses [7].
One other application of DBT in conjunction with synthetic digital mammography is in the Mean Glandular Dose (MGD) estimate process. The MGD has been employed as a metric for assessing the radiation risk levels from breast x-ray mammography images [8]. The generated x-ray breast mammography images must be thoroughly studied in order to extract hidden features of soft breast tissues, such as mass-like lesions, due to their low contrast [9]. These features offer an increased performance of the DBT and enhance the estimate stage of the MGD [10].
When compared to the masses captured by 2D mammography [3, 11], the DBT improves the shape of the cancer masses for better visualization [12], but these masses suffer from unclear density due to technical issues and lack of supporting data [13]. Because there is little information on the cancer tumor, using a single view reduces the success rate of the cancer detection process. This kind of deficiency may arise from the tumor regions' ability to visibly disappear due to mammary gland overlap [14]. According to the guidelines of the European Society of Breast Imaging [15] and the European Commission Initiative on Breast Cancer [3], DBT is generally considered as an optional or conditional choice for screening techniques. As a result, current research projects have been developed to employ 2D mammogram images in conjunction with synthetic digital mammography to improve the visualization of the cancer masses [16].
Both the CranioCaudual (CC) and MedioLateral-Oblique (MLO) views have been employed in breast cancer inspection during screening. Additionally, an image of the left and right sides of the breast is shown in every view. A comparison of full-field digital mammography with synthetic mammography was presented in study by Chikarmane et al. [17]. There have been instances where synthetic mammography has been identified by a decreased visibility of mass boundary discontinuities and a higher false-positive detection rate [18]. It is possible to overcome these challenges with the synthetic mammogram images and accurately extract the cancerous tumor from the x-ray mammogram images. Alternatively, before CC or MLO are synthesized in synthetic mammogram images, the cancer tumor in the full-field digital mammography images needs to be highlighted and recognized as a region of interest ROI [19]. The 3D-based models for the synthetic mammogram images for breast cancer are made easier by these alterations to the original mammography images [20]. The use of synthesizing over ROIs has been demonstrated by Jiménez-Gaona et al. [21] to enhance the generative synthesized models, eliminate the need to analyze the entire x-ray images, and accurately reproduce multiple perspectives of the x-ray mammography images for breast cancer [22].
The constraints of the 2-Dimensional viewing of the x-ray breast cancer make changing from a 2-Dimensional to a 3-Dimensional view in mammography an essential modality. The idea of synthesizing for the 2-D mammography images is addressed in the study of Van Schie et al. [23]. In the context of overlapping structures, the 3-D mammography generated via synthesis can lessen the detection limits of breast cancer [24].
Generally, when a high-resolution mammography is obtained, the quality of the diagnoses increases. The high degree of appearance accuracy can provide additional information concerning breast cancer. More radiation doses given to patients can achieve such great accuracy, but doing so has negative repercussions [25]. Consequently, it is urgently important to have a reliable synthesis of 2-D mammography breast mass images in order to provide additional information about the tumor regions detectable in the x-ray mammogram images [26].
As a summary of the problem’s outline is to there is a need to generate a synthetic mammography image from the given full-field digital mammography images for both the standard MLO and CC views of each breast. Utilizing synthesizing on x-ray mammography images provides several feature samples that can be used to maximize the conspicuity of a lesion and identify overlapping cancerous tumors. Additionally, the generated digital breast tomography provides a variety of breast masses and allows for an improvement in scanning visualization. By combining the synthetic digital mammography with the two-dimensional full-field digital mammogram images, it is possible to enhance the advanced visualization of cancer masses and make it easier to identify the region of interest for the advanced three-dimensional computer-aided diagnosis visualization. The significance and limitations of the synthesis approaches have been discussed in the related work. However, the problem at hand is how to synthesize the relevant features while concentrating only on the region where cancerous tumors are found and keeping all pertinent data on them. Following years of intense effort and significant progress, there are still a number of limitations. These include as follows:
-Detecting the cancer tumour is a necessary stage in diagnosis not only because of the need to highlight it from surroundings but also to keep the synthetization focusing on the region of interest.
-Offering various digital forms of the cancer tumour enables the current cancer research to deeply analysis the cancer tissues based on different classification techniques.
-Because the majority of nowadays digital x-ray breast tomography typically lack appropriate color intensity graduation, analysing the features based just on the texture's characterization is not precise enough.
Here, a method to develop a synthetic mammography image using each CC and MLO view's x-ray breast cancer mammogram images has been proposed. Initially, the malignant tumor will be extracted from the full-field x-ray mammography pictures using the developed method. Because the synthetization process needs to be focused on the region of interest, the boundaries of the cancer tumor have been marked in each view once it has been extracted. Applying a moving distance between the boundary's points is necessary to gather information about the cancer tumor because various kinds of data sources must be generated. As a result, regions of interest have been generated and a slicing virtual window has been relocated to the boundary's point. These regions serve as a point of reference whenever features are extracted for deep learning or synthesis purposes. Forming the regions of interest as different aspects has been made achievable by the proposed method of offering digitalization transformation and comprehensive examination. In order to determine the synthesized regions of interest among the reference windows of both screening views, the synthetizations have been implemented based on the non-parametric supervised learning classifiers, and features extracted from the regions of interests. The main contributions of this work are summarized as follows:
-Segmenting and distinguishing the breast region in x-ray mammography images, regardless of the breasts' dimensions or shape.
-Refining the cancerous tumor's characteristics to enhance the tumor's visualization capabilities.
-Defining the cancer tumor as a reference area for further synthetization development
-Formatting the regions of interest according to different visual digital features to enable more complex classification and synthetization tasks.
-Applying the supervised learning methodology-based synthetization techniques for improved visualization in synthetic views.
This paper is organized as follows: the first section serves as an introduction. The related work has been covered in the second section. The third section has addressed and discussed the proposed method. The fourth section highlights the findings and results. Lastly, the final section contains the conclusion.
The idea of synthesizing was first presented when it became necessary to match both CC and MLO in order to overcome the diagnosis of false-positive mammography [27]. Even though matching has made mammography easier, radiologists still need to deal with synthesizing when diagnosing breast cancer. The advantages of synthesizing include time and effort savings, in addition to learning more about clinical lesions [28].
A Collaborative Adversarial Network has been presented in [26] to provide a segmentation method and forward synthesis. They have proposed a method that consists of three stages: the discriminator, the inverter, and the generator. Collectively, these elements have developed into artificially created realistic mass images. The synthesis of realistic X-ray breast mass images still faces a challenge when breast tissue is surrounded by masses because breast masses appear in a variety of shapes and textures.
The Collaborative Adversarial Network has been used and improved by Dhivya et al. [29] to synthesize the conventionally augmented data since it has a great deal of potential in the medical image application. Their efforts have been concentrated on employing the Deep Neural Network and Collaborative Adversarial Network to expand the dataset. For the same reason, several works have been introduced by Fan and Jiao [30]. Even though their work has the potential to be useful, it has been focused on creating enhanced medical images. In this case, processing the provided mammography images is required to generate a synthesized view and provide effective features for deep learning processing.
Deep learning has a revolutionary force for computer-aided diagnosis of mammography images as well as imaging diagnostics. Instead of the conventional two-dimensional mammograms, Bai et al. [31] presented a review and the concept of digital breast tomosynthesis, which forms 3-dimensional mammograms. This work presents a method for creating the synthesized mammography x-ray images with just one hand using a type of synthesized mammography development. On the other side, the advancement can enhance radiologists' ability to screen for breast cancer. The synthesized cancer tumor needs to supply deep characteristics and appearance attributes since the synthesized x-ray mammography images would be used in deep learning techniques.
A study evaluating the performance of two-dimensional synthesized digital mammograms (2DSM) and regular full-field digital mammograms (FFDM) in terms of feature-based cancer detection scheme training was carried out [32]. Their investigation verified that 2DSM worked better than FFDM. In simpler terms, FFDM can provide fewer details about the breast cancer mass than the 2DSM. The King Abdulaziz University Breast Cancer Mammogram Dataset is a publicly available mammography dataset that has been released by Alsolami et al. [33] for use in computer-aided diagnosis. The dataset does not include the 2DSM version, even after being checked and annotated by three separate radiologists.
The synthetic digital mammography concept has addressed the 2DSM version [34]. The primary result of the study [34] was to create SDM utilising a combination image, which mixes two images: one from FFDM and one from digital breast tomosynthesis. This kind of image production has been transformed using deep convolution neural networks. A variety of image characteristics have been employed in evaluations and experiments. The produced synthetic image needs two different kinds of data as input, regardless of how they have enhanced the deep neural network's progressive performance. Occasionally, the breast cancer screening does not involve certain forms.
Employing the 2DSM for evaluating optical characteristics [35] or searching for tiny indications in 3D images of breast cancer [36] validates the significant contribution of these 2DSM to enhance radiologists' diagnostic performance. The use of 2DSM has enhanced the localization and detection of such tiny signals [37] and reduced search mistakes. However, their enhancement has been executed in conjunction with the three-dimensional visualization of breast cancer images. The limitations of creating the 2DSM are increased by such a conditional process.
Here, it is proposed to build the 2DSM by prioritizing the utilization of bilateral mammograms while avoiding the use of the 3D view of the breast cancer images. The detection of bilateral mammography asymmetry anomalies has been discussed by Tzortzis et al. [38]. Bilateral detections between each side for bilateral CC and MLO views are required in order to accomplish the detection-based on bilateral mammography. Each view's left and right sides must be connected to one another using strong references to establish the synthesized view's reference points. A technique for identifying bilateral mammogram abnormalities by randomly synthesizing them has been proposed by Wang et al. [39]. Notably, randomization can be removed after the left and right sides are linked using reliable reference locations [37]. As a result, utilizing the available FFDM, a link between both sides can be established and a strong basement can be prepared for 3D visualization.
Applying supervised or unsupervised learning approaches for clinical detection is typically contingent upon the availability of data, particularly in the case of synthetic mammograms images [19]. Generative adversarial networks are used in study of Park et al. [19] to produce high-quality synthetic mammogram images and perform unsupervised anomaly detection. In the study of Shah et al. [22], the limited data availability was solved by using deep convolutional generative adversarial networks to create synthetic mammography images. Furthermore, various generative adversarial network techniques have been evaluated in the study of Jiménez-Gaona et al. [21] for the purpose of labeling clinical scenarios and enhancing mammography data through the utilization of ultrasound and mammography databases. The absence of anomalous and imbalanced data typically affects unsupervised learning methodologies, regardless of their effective performance and results. An alternate method for generating synthetic mammograms has been suggested here, which is of extracting strong features from the existing mammography images. Consequently, these characteristics allow the supervised learning method to be utilized in breast digital tomography.
Improved performance of synthetic images and mammography analysis with the application of deep learning techniques was introduced by Prodan et al. [4]. Their strategy of using data augmentation to provide sufficient data and steer the outcomes toward good classification performance is a limitation of their work. Deep convolutional neural networks have also been introduced by Rahman et al. [6] to improve computer-aided diagnosis for advanced breast categorization and breast lesion detection [9]. Due to the further FFDM preparation phase, introducing the deep conventional neural network with the augmentation technique necessitates paying greater attention to time and memory complexity. Rather, developing the proposed strategy around the cancer tumor detected during the preparatory phase provides a strong basis for both the DBT and advanced breast diagnosis.
In summary, the proposed method was developed to overcome a number of challenges before producing the artificial mammography images. The cancerous growth has been identified and is being used as a reference region of interest for additional research. The cancer tumor's appear has to be improved by refining its tiny characteristics. By using such appearance improvement, the proposed method can extract the cancer tumor regardless of its texture or shape. Various feature types are defined for the purpose of enhancing the deep learning techniques' efficiency after the detection of the cancerous tumor. By providing new types of mammogram images, these features improve the dataset of mammography screening that is presently accessible. The proposed method integrates both sides in a synthetic view by linking the features on each side of the CC and MLO views. By utilizing the extracted features to create the synthetic digital mammography images, applying the supervised learning algorithms is made effortless. In besides of developing synthetic images, the proposed method identifies the cancerous mass as a solid foundation for further enhanced improvements in computer-assisted classification and three-dimensional synthetic visualization.
The details of the proposed method to produce a synthetic mammography image using the x-ray breast cancer mammogram images from each CC and MLO view have been discussed in this section. There are five phases to the suggested procedure. The malignant tumor has been identified in the full-field x-ray mammography images during the first phase. In the second phase, the cancerous tumor has been identified and designated as a region of interest. A technique to collect data on the cancer tumor and identify the areas of interest on the cancer mass has been suggested in the third phase. In the fourth phase, formatting the points of interest within the context of advanced features has been implemented. The final phase demonstrates how to execute the synthetic digital process using the supervised learning methodology. Establishing the 2-D synthesized mammography images for breast cancer is the primary contribution of the proposed method. With the assistance of synthesized mammograms images, radiologists can derive additional information regarding cancerous growths. Furthermore, for each mammography image (CC and MLO), the cancer tumour region can be observed on both sides (i.e., left and right). Following the establishment of the synthesis, a number of reference points were generated from both sides that might subsequently be utilized for 3D-based visualization or AI-based search. These phases involved in the proposed method have been explained in the sections that follow.
3.1 Segmenting the breast region from the x-ray mammography image of the breast
The x-ray mammography images are often extremely large and have a high resolution. Such visuals require higher memory complexity and relevant time to be processed. Here, the development of the proposed method has been focused on removing unneeded pixels to preserve the memory resources. The primary goal of this procedure is to segment the breast area in x-ray mammography images, regardless of the size or shape of the breasts.
Additionally, it is the radiologist's duty to assess the mammography images for breast cancer, either manually or with the use of a Computer-Aided Diagnosis (CAD) system [40, 41]. Radiologists and the CAD system both emphasize on the form, texture, and other visual aspects of cancerous tumors. In x-ray mammography images, the breast cancer can be precisely highlighted by CAD or any other detection method by extracting the cancer tumor as a region of interest. As such, it is necessary to separate the breast area from the background first.
More information about the breast cancer tumor can be displayed by synthesizing the left and right sides for CC or MLO. To construct a three-dimensional model of the x-ray mammogram images in FFDM, identifying the area of the cancerous breast serves as a fixed point of reference. Because the appearance characteristics of breast cancer can be identified from other pixels in FFDM, these points have been marked as reference points.
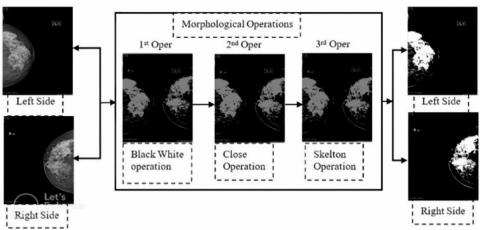
The vision-based method used to isolate the cancerous tumor from the surrounding x-ray images is depicted in Figure 1. First Operation (i.e., 1st Oper) has transformed both the left and right sides into black-and-white images. X-ray image conversion may result in the removal of numerous connected pixel regions and the creation of a few tiny holes in the cancerous tumour. Several linked pixel regions may be removed from x-ray images during conversion, and the cancer tumour might create a few tiny holes as a result.
Figure 1. The flowchart of segmenting the cancer tumour from x-ray mammogram images
With the goal to fill those holes, the close morphological procedures have been conducted on the black-and-white images using the second operation (i.e., the 2nd Oper). The input black-and-white image has been dilated to enable the morphological closing operations [42]. After applying a structural element to perform the dilation, the resulting black-and-white image was closed. The results of the processing of both the left and right sides by the second operation are displayed in Figure 1, which is located below the title of the 2nd Oper.
Closing the tiny holes can keep some connected pixels separated from the cancerous tumor, but they have no meaningful function in radiographic diagnostics or in modifying the tumor's morphology. The black-and-white image produced by the preceding procedure—the second operation—has been subjected to the third operation (i.e., 3rd Oper). The Skelton morphological operation is the third operation. To find the foreground pixel, it has been running by searching for the local connectivity pixels. It removes pixels that have been isolated from the foreground whenever it discovers them [43]. The generated result is displayed in Figure the caption "3rd Oper."
The breast region has been detected from the surrounding area and both the left and right sides have been processed. As shown in Figure 1, they have been coloured white after completing the morphological operations. They are divided into two directions: down for the right side and up for the left. The proposed technique has been notably enhanced by this instance by segmenting the breast area from the entire set of x-ray images provided by FFDM. Furthermore, the breast regions have been refined from the scattered pixels. Since the morphological operation has been smoothly run, the result given here has satisfied the real time constraints and memory complexity.
3.2 Utilizing the 2-D x-ray mammography images to extract the cancer tumor as the region of interest
Following the segmentation of the breast cancer from the x-ray images, the proposed method must focus on the region of interest, which is identified as the cancer tumour in this instance. Regardless of the cancer tumour’s shape, its boundaries must be identified to remove it.
The process of properly determining the characteristics of the cancerous growth makes the extraction of the tumour a crucial step in either CAD or radiology. However, because of the difficulty posed by irregularities and the formation of cancerous tumours, extracting or detecting the x-ray object is not a simple process [44].
Here, the input was the generated 2-D x-ray black-white images. Every white area that is connected has been coloured a distinct coloration. The black-and-white photos for the left and right are displayed in Figure 2. The left side of the CC perspective is displayed in Figure 2(a), whereas Figure 2(b) displays the right side. Notably, blue has coloured the greatest area. The primary cancer tumour has been identified as the biggest part that has been extracted. While some smaller regions have been removed, the morphological operations have combined the majority of the valuable regions with the largest region.
Figure 2. The coloured shape and the border points for the cancer tumour in 2-D x-ray mammogram images
Here, finding the connected pixels that make up the greatest connected regions is the primary goal. Recently, a technique for extracting the burn flame's limits was proposed by Luo and Ba [45]. The Moore-Neighbour Tracing Algorithm was utilized in the development of their technique to extract the boundary of the flame contour in addition to the related regions. In this case, the contribution is to extract the related regions by using the Moore-Neighbor Tracing Algorithm. The input black-and-white image has been improved by the prior step covered in the preceding section to verify that the algorithm ran successfully. Because of this improvement, the Moore-Neighbor Tracing Algorithm is able to overlook the abnormalities regions and scattered pixels caused by the mammography pictures' challenging appearance. Additionally, the greatest region has addressed the target region, which is the cancer tumour.
As a result, the left and right cancer tumour border spots have been identified, and they are displayed on the black side of Figure 2(a) and Figure 2(b) respectively. Moreover, the cancerous tumor's center has been identified and is indicated by a blue star. Later on in advance tasks, the cancer tumor's center point might be employed as a reference point while the tumor is rotated or altered.
3.3 Extracting the regions of interest for the boundary points from 2-D x-ray images of both left and right side
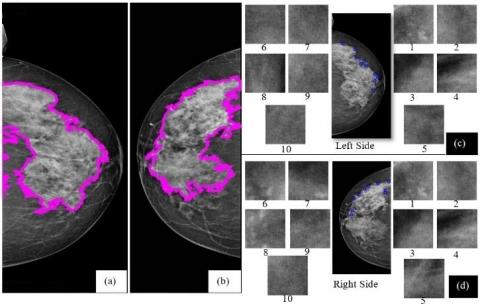
The previous stage involved the detection of the cancerous tumour. However, the necessary accuracy and performance cannot be fulfilled by utilizing the cancer tumour immediately as a connected region for left and right-side synthesizing. Figure 3(a) and Figure 3(b) illustrate the abnormality's appearance and shape, which is the basis for this rule. Rather than employing the entire cancer tumour, the boundary points that have previously been retrieved have been employed here as the cancer tumour’s reference points.
Figure 3. Samples of interesting locations extracted from the border of the cancer tumor. (a) 2-D x-ray mammography images on the left side, (b) 2-D x-ray mammography images on the right side, (c) Samples from the left, (d) Samples from the right
Notably, compared to the surrounding pixels, the cancerous tumour frequently has a higher grey value. However, the internal details of the x-ray mammogram images are misclassified and combined with other pixels of the original mammogram once they have been converted into multiscale images [46]. As a result, the cancerous tumour’s border spots can still be identified from others.
Fixing reference points on the border between the breast region and the cancer tumor in the x-ray mammography images is the primary objective here. Among the suggestions is to cut a 50-pixel-square window across the border. Changing the cancer tumor into multiple scales of either huge or small size and then choosing the strong reference points is an additional method [46]. Because the first option in this case saves memory resources for more advanced processes, it has been chosen. These actions can validate the scaling-friendly strong points.
The process below has been used to accomplish slicing a window over the boundary:
Line 1: Let Am,n is the image.
Wx,y is the slicing window.
Line 2: Let boundary points is $P_K=\left\{P_1, P_2, P_3, \cdots \cdots \cdots, P_K\right\}$.
Line 3: Within Pk, each point is formed by Pi,j.
Line 4: Move the center of the slicing window Wx,y to match Pi,j.
Line 5: Confirm that Wx,y must not ovelap with others extracted Bl,m.
Line 6:Extract the Bl,m from Am,n, where B is formed by $\left\{P_{i-25, j-25}, \cdots \cdots P_{i, j} \cdots \cdots P_{i+25, j+25}\right\}$.
Line 7: Repeat Line 4, Line 5 and Line 6 for all points in PK.
The slicing window Wx,y has been moved over boundary points PK detected in the 2-D x-ray images Am,n as a result of the previously mentioned technique. each point in PK has been coordinated by j and j. The point Pi,j and the center of the slicing window Wx,y have been shifted so that they meet. A prerequisite need to be fulfilled before extracting the matching window Wx,y connected to Wx,y from the 2-D x-ray image. The purpose of this is to verify that the extracted window's coordinates do not overlap any previously extracted windows. This condition is meant to ensure that the pixels surrounding the boundary point only correspond to windows. Every point in PK now has a different slicing window.
Figure 3(c) displays samples of the extracted window for the left side. On the other hand, examples for the right-side extracted window are displayed in Figure 3 (a) through (d). In Figure 3(c) and Figure 3(d), the slicing window samples are identified by numbers ranging from 1 to 10. The corresponding windows are situated next to the right x-ray side in each figure and have been magnified. The margins of the cancer tumour appear so similar to the background, despite the extracted windows' nearly distinct appearance from the surroundings. Here, these windows are designated as boundary point regions of interest.
3.4 Formatting the regions of interest in context of advanced features
It is necessary to alter the view of these regions once the regions of interest have been extracted from the 2-D x-ray image's left and right sides. The appearance of the abnormality is challenging, which is why things are changing. A new deep reading for regions in the context of multi-scale features [47] and 2-D features [48] has been made possible by formatting the region of interest. Furthermore, the increased similarity between those locations has hindered efforts to improve matching accuracy. This step's primary objective is to extract the features connected to the regions of interest.
The main challenge in feature extraction is the FFDM technology itself. The latter often contains two-dimensional grayscale-colored x-ray mammography images, which are frequently single band images. The radiation therapy is essential to the creation of mammography images, where the wavelength and frequency of the radiation produce the quality of the image. These photos in grayscale format have been generated using an unidentified color space. Consequently, no distinct color mapping to such grayscale has been constructed [49].
The suggested approach was created in response to this challenge, using several feature types and shapes to format the regions of interest. The proposed diagram is displayed in Figure 4 to verify that the extracted features have sufficient data and points to accurately characterize the region of interest in terms of feature formatting. The five components that make up the diagram are as follows.
Part A: It contains a stack ST for the regions of interest. It has been developed for performing the following procedure.
Line 1: Let ST is a stack for $\mathrm{ROI}_N$. $S T=\left\{R O I_1, R O I_2, \cdots \cdots \cdots, R O I_N\right\}$.
Line 2: Send a $R O I_i$ for being processed once the obstacle OB is activated.
Line 3: PART A is terminated once Ste has no more ROI.
Part B: It has been developed to check the ROI if has a strong local point which is defined by the following features:
Feature 1: Binary Robust Independent Elementary Feature (BRISK) [50] is a filter to extract the distinguishing features from binary image which is generated by applying a gaussian filter. The strong points of BRISK has been generated by detection function denoted by τ which is defined by Eq. (1):
$\tau\left(P_A, P_B\right)=\left\{\begin{array}{c}1, \text { if } I\left(P_A\right)<I\left(P_B\right) \\ 0, \text { otherwise }\end{array}\right.$ (1)
where, $\left(P_A, P_B\right)$ is a pair of locations.
Both $\left(P_A, P_B\right)$ are defined by a set of nd which contains location pairs and define by the following equation:
$E\left(n_d\right)=\sum_{i \leq i \leq n_d} 2^{i-1} \tau\left(P_A, P_B\right)$ (2)
Feature 2: Features from Accelerated Segment Test (FAST). It is one of the fastest features detectors, which have been developed for high-speed performance. It generates a vector of key points. Each point can have three states (i.e. Darker, Similar and Brighter) which are calculated by Eq. (3) [51]:
$S_{p \rightarrow x}=\left\{\begin{array}{cc}\text { Darker, } & I_{p \rightarrow x} \leq I_{p \rightarrow t} \\ \text { Similiar, } & I_{p \rightarrow t}<I_{p \rightarrow x} \leq I_{p \rightarrow t} \\ \text { brighter, } & I_{p \rightarrow t} \leq I_{p \rightarrow x}\end{array}\right.$ (3)
Feature 3: speeded up robust features (SURF). It has been improved using the Hessian matrix approximation method $H(x, \sigma)$ computing x at scale $\sigma$. Beside of Hessian matrix [52], the integral box filtering is integrated with the gaussian kernels at point $X(x, y)$. The Hessian matrix has been calculated by Eq. (4) [51]:
$H(x, \sigma)=\left[\begin{array}{ll}L_{x x}(x, \sigma) & L_{x y}(x, \sigma) \\ L_{y x}(x, \sigma) & L_{y y}(x, \sigma)\end{array}\right]$ (4)
where,
$L_{x x}(x, \sigma)$ is the Gaussian convolution for second order derivates for the input image at point X.
$L_{y x}(x, \sigma)$ is the similarity with y at x-coordinate.
$L_{y y}(x, \sigma)$ is the similarity with y at y-coordinates.
Feature 4: Harris–Stephen’s algorithm (Harris). It has been used for corner detection. It depends on the intensity value changes in X and Y directions [53].
Feature 5: Minimum Eigenvalue algorithm (MinEigen). It has been developed for extracting the corners points in grayscale images using the covariance matrix [54].
Feature 6: Maximally Stable Extremal Regions (MSER). It is one of the key point detectors for finding the strong corners point [55].
Key strong points have been identified from the regions of interest ROI as a result of Part B. An indication (ø) has been delivered to Part A and the process has been ended after the key points from the input ROI have not been found. Part A then reacts to the OP by sending a second ROI into Part B.
Part C: Extracting key strong points from the ROI is not enough to mark the ROI as a strong ROI. Another test has been applied to extract strong features descriptor as vectors for each feature discussed above. The features descriptors of each feature are as follows:
The first feature is BRISK [50] which has been tested for generating strong features. It uses a saliency criterion to verify the key points. As a result, BRISK feature descriptor has been generated for 3 features. The BRISK feature descriptor includes three characteristics for each feature which Metric, Scale and Orientation. A fixed number of 64 columns for each feature has been generated, which has been converted to the mean of these 64 value columns. The second feature is FAST. Its descriptor includes Metric and a fixed number of 64 value columns which are converted to the mean value. The third feature is SURF which has been formed by four characteristics: Scale, Sign of Laplacian, Orientation and Metric. In addition, the mean value of each 64 value columns of each feature. Both Fourth and Fifth features (Harris and MinEign respectively) have been formed by metric and the mean value of the 64-value column. The last feature is MSER. It has been formed by Metric, scale, Sign of Laplacian, orientation, and the mean value of the 64-value columns.
Part D: In case feature extraction fails to extract strong features, an indication has been sent to process the next feature. Some of ROI have not enough strong grayscale intensity and there are no extracted features can be generated, so such ROI have been eliminated. In such case, another Empty indication has been sent to PART A to activate OP again.
Part E: a stack has been generated to store all the extracted features. Moreover, a 3-D surface of the ROI can be generated and stored for being used later in synthesizing process.
3.5 Implementation of the synthesizing process
Following the definition, 3D volumetric mammography images are used in 3D breast tomosynthesis to generate multiple views of the region of interest [36]. Moving through these three-dimensional views is necessary for the radiologist to identify the region of interest and remove it from its surroundings. Because this method of exploration will impact the appearance of the cancer tumour, peripheral vision, and background noise, the final report given by the radiologist will be less accurate.
Besides contributing to the volumetric data, the mammography screening provided a free two-dimensional image of the breast cancer tumors that developed in the FFDM [38]. For FFDM, creating a visual synthesized image gives a new level of advanced diagnostics and radiography reports. This study considers both x-ray sides of the 2D mammography images for CC or MLO views as input to produce the 2D-synthesized images displayed in 3D view.
The primary contribution in this case is the synthesis of the CC view's left and right sides. By projecting the relevant features onto both sides of the CC view, the synthesizing process has been established. Stated differently, a testing dataset has been created in conjunction with the right-side feature instance in the left-side features.
The data given from the previous step has been formed by many Regions of interest (i.e., $R O I_1, R_2 I_2 \cdots \cdots, R_N$). For each region, features have been extracted based on intensity grayscale level and multiscale level (i.e., $\left.F_1, F_2 \cdots \cdots \cdots, F_M\right)$. These features have been assigned with regions of interest as following equation:
$V e c=\left\{\begin{array}{c}F_1 R O I_1, F_2 R O I_1, \cdots, F_M R O I_1, F_1 R O I_2, F_2 R O I_2, \cdots \cdots, \\ F_M R O I_M, \cdots \cdots, F_M R O I_M\end{array}\right\}$ (5)
Two general vectors have been generated for Left side and right side which are VecLeftSide and VecRigthSide respectively. The features extracted from the left side has been assigned to VecLeftSide and the features of the right side have been passed to VecRigthSide. The classification technique has been here developed for applying the projection mechanism. In the VecLeftSide, each instance represents a one class or label. In contrast, VecRigthSide consists of testing instance where the proposed technique has been developed to find the closest value in the VecLeftSide.
Looking for where the ROI given from right side can be projected in the left side requires the statistical estimation. The latter can be addressed by K-Nearest Neighbour algorithm (KNN) [56] which is one of the supervised learning algorithms. The KNN is one of the supervised learning algorithms which classifies a vector object into the closest class base on distance metric. Here, the KNN has been applied to find the synthesized features by the following steps:
Line 1: Let V is the patter space for $V e c_{\text {LeftSide }}$ and V' is the pattern space of the $V e c_{\text {LeftSide }}$.
Line 2: Form Vi for the set of the features vector of the Left side of the x-ray images. $V_i=\left\{F_i, C_i\right\}$. Fi is the features vector of the ROI. Ci is the ROI number in the left side.
Line 3: Form V'i for the set of the features vector of the Right side of the x-ray images. V'i={F'i,C'i}.
F'i is the features vector of the ROI.
C'i is the ROI number in the left side.
Line 4: Create a test space $F=\left\{F_1, F_2, \cdots \cdots, F_N\right\}$.
It includes all features have been generated for LeftSide and RightSide.
Line 5: Create a Vi and V'i for Features in F.
Line 6: Search about the nearest neighbour in Vi for in the query data V'i using the exhaustive search and the Minkowski distance.
Line 7: Once there are many ROI of V have been matached with the ROI of V', the Closest ROI of V to the center of the ROI associated with V'.
The KNN provides an accurate measurement distance (e.g., Euclidian distance, Manhattan distance, Minkowski distance, Mahalanobis distance) and has been chosen because of its success in classification [56]. In technical terms, the KNN has been used by comparing the ROIs of the right and left sides, respectively, depending on each feature in features vector F (i.e., lines 5 and 6). Typically, a large number of ROIs on the left side have been found to correspond. When computing the distance between the ROI center points on the left and right sides, the conditions listed in Line 7 have been applied. To indicate that two both ROIs are comparable to one another, a minimum distance has been selected.
Here, the proposed method has been implemented in practice using Matlab. Tools for computer vision and image processing had been developed for the proposed method. The experiment in this paper was conducted with x-ray mammography images. A few of these images were taken in the public hospitals run by the Ministry of Health in Jordan. The King Abdulaziz University Breast Cancer Mammogram Dataset (KAU-BCMD), which was published by Alsolami et al. [33], has additional images downloadable.
The findings of this work have been presented as Research Questions (RQs) to clarify and highlights the study’s larger implication based on the generated results. The Research Questions (RQ) have been titled as follows.
RQ1: Does the proposed method segment the breast region in the x-ray mammography images?
RQ2: Does the proposed method enhance the tumor's visualization capabilities for radiologist?
RQ3: Does the proposed method identify the strong points in the cancer tumour for further synthetization development?
RQ4: How does the proposed method format the points of interest in different visual digital features?
RQ5: Does the proposed method apply the supervised learning methodology to implement the synthetization technique?
The proposed method of creating the synthetic x-ray mammography pictures has been effectively implemented. Figure 5 shows an example of how to create the synthesized view for the left and right sides of the CC view. The synthetic view has been implemented based on the reference points of interest indicated by yellow circles on the left and right sides of Figure 5(a) andFigure 5(b), respectively. A red dashed line connects the two regions to show connectivity. To establish a synthetic perspective for the left and right sides of the CC context, Figure 5(c) shows these positions in relation to each other. The synthetic view shown in Figure 5 was created using the Harris feature's metric value. Even with so few reference points, it is possible to create a synthetic vision.
Figure 5. Sample results of combined points based on the Harris features metric. (a) Blue-colored feature points on the left side of the CC view, (b) Red-colored feature points on the right side of the CC view, (c) Combined left and right views in digital synthesis
With reference to RQ3, Figure 5 illustrates some of the strong spots of interest that the proposed method was able to discover, making it easier to build synthetized mammography images. Even though both sides of the CC perspective have divergent view, the proposed method has been successful in establishing the corresponding strong points on each side.
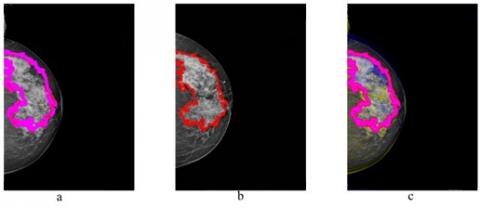
Due to their importance in creating the synthetic view, the reference points of interest have been increased using the MSER feature's metric value. The necessity of determining strong points when trying to establish multiple points of view within a given area of interest has brought attention to its significance. In light of this finding out, Figure 6 is presented to enable the generation of new points of interest for reference through the use of extra characteristics. The proposed method can be used to identify alternative features if a given feature isn't able to generate enough of these reference points. The reference points for the left side of the CC image, shown in Figure 6(a), have been used to identify and color the border of the cancer tumor in blue. Conversely, Figure 6(b) shows the right side of the CC view's reference points. These points have been indicated by the color red. The combined synthetic view is shown in Figure 6(c). The synthetic sight produced by the MSER feature is also more accurate and reliable since it has more reference points than the Harris feature.
Figure 6. Sample results of synthesized points based on the MSER features' attribute metric. (a) Blue-colored feature points on the left side of the CC view, (b) Red-colored feature points on the right side of the CC view, (c) Paired left and right views in digital synthesis
Regarding RQ1, the findings displayed in Figure 6 demonstrate that the proposed method will successfully segment the breast cancer tumor from the x-ray mammography images. The first three phases of the proposed method ended with the implementation of the segmentation. The proposed method can also emphasize the cancer tumor's border on the left and right sides of the CC view because of the segmentation. For RQ4, the proposed method can extract significant features and strong points. These features also differ in terms of their placements and forms. Once the proposed method attempts to produce strong regions of interest for additional synthetization, such diversity offers a large range of options. The blue-colored features points on the left side of the CC view. the left and right combined views in digital synthesizing.
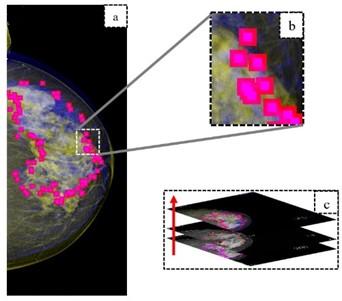
To fully identify the left and right-side reference points, the synthetic view has been enlarged by zooming in as shown in Figure 7. The reference points on the left side are shown as blue, and the reference points on the right side are shown as red. A sample of both reference spots is denoted by a white rectangle, as Figure 7(a) illustrates. Figure 7(b) shows the white rectangle magnified. The proposed method's synthesis procedure can reconstruct the synthetic image through recognizing the matching between the left and right sides at the boundary of the cancer tumor. A three-dimensional histogram representation of the synthetic image is also shown in Figure 7(c). The goal of the 3D synthetic view is to confirm that these reference points can be stacked on top of one another to enable a varied 3D perspective.
Figure 7. Sample results of synthesized points using MSER features' mean value. (a) Merged left and right views of the CC view with a white-bordered sample rectangle, (b) White-bordered sample rectangle in the synthesized view of merged left and right sides of the CC view, (c) Combined left, right, and three-dimensional views in a 3D histogram synthesis, arranged from bottom to top
The 3D histogram view is the result of stacking the generated synthesized images from processing the left and right sides of the CC image. The reference points on the left side of the CC view are at the bottom. The layer on the second level matches the reference points on the CC view's right side. The last level displays the 3D synthetic view. As shown in Figure 7(c), these reference points can thus be positioned over one another.
The study should demonstrate the proposed method's capability to provide the digitally synthesized view for a specific set of x-ray breast mammography images within the RQ5. A synthesized sample for the left side of the CC view is displayed in Figure 7. The result was produced using the proposed method's fifth phase, which utilized the supervised learning technique. A graphical indication for carrying out the synthetization is provided by the magnified view of the synthesized view. An improved visualization has been made possible for both sides by integrating the CC view's left and right sides. Within the context of RQ2, the proposed method provides an improvement that allows radiologists to diagnose the tiny details of the cancerous growth simultaneously and precisely.
The proposed method has also been applied to the MLO view. The generated findings utilizing the MLO view x-ray mammography images are displayed in Figure 8. This contribution demonstrates its proposed methods' efficacy in full-field digital mammography (FFDM) when compared to other views. One of the FFDM forms, the MLO, has been handled; in earlier parts, the MLO was presented.
Besides to the challenge of abnormalities, the MLO also faces the challenge of surrounding items showing up in the x-ray mammography images, such as the upper region of a woman's breast. These objects typically have the same appearance of intensity. The proposed method just generated a synthetic image of the cancerous tumor after evaluating the MLO. Several features have been used to display the 3D synthetic view presented in Figure 8. 3D synthetic view of MLO x-ray images based on MSER features is displayed in Figure 8(a). The proposed method generated Figure 8(b) using the features of SURF. Figure 8(c) displays the 3D histogram of the synthesized images.
Figure 8. Sample results of synthesized points using different features for the MLO view. (a) 3D synthesized view for the merged left and right sides of the MLO view based on MSER feature, (b) 3D synthesized view for the merged left and right sides of the MLO view based on SURF feature, (c) 3D histogram view for the left side, right side, and the 3D view of the merged sides, arranged from bottom to top
As a continuous answer to the RQ5 and RQ4, Figure 8 demonstrates the capability of the proposed method to handle the MLO type of FFDM. Applying the supervised learning process with various characteristics features has produced the synthetization. When there aren't enough features to produce the synthetization, the proposed method offers alternative features. These characteristics make it easier for the proposed methods to produce sophisticated synthesized view visualizations.
To distinguish the proposed method from others, a comparison with different approaches has been taken into consideration, as indicated in Table 1. The comparison was conducted using three parameters. Using neural networks is the first parameter. Its purpose is to demonstrate whether the neural network strategy was used in the development of the given method. Processing the entire x-ray image is the second. Its purpose is to determine whether the established method has been applied to process a particular region of the input image or the entire x-ray mammography image. Identifying the cancerous tumor is the third parameter. This parameter demonstrates the method's ability to identify cancerous tumors in addition to synthetic views.
As indicated in the first column of Table 1, the proposed method has been contrasted with three more contemporary approaches created in synthesizing. In summary, in order to conserve running time and memory, the proposed method was created to locate the visualize synthetic view without the use of neural networks. Despite the proposed method analyzed the entire x-ray image, it conserved processing time and memory by concentrating on the cancer tumor's boundary while preserving the input image's scale level and the characteristics of the cancer tumors. The proposed method can identify and extract the cancer tumor effectively by focusing on its boundaries and formatting several features. On the other hand, the creation of a visual digital synthetic view can support more sophisticated development in the discipline of computer-aided applications and digital breast tomosynthesis.
Table 1. A comparison of the proposed method with current research on synthetic views
|
Ref. No. |
Using Neural Network |
Processing the Whole X-Ray Image |
Detecting the Cancer Tumour |
|
[34] |
yes |
No |
No |
|
[35] |
yes |
No |
No |
|
[36] |
a Foveated Search Model (FSM) |
Yes – using scaling |
Search for specific points with eye tracker |
|
The proposed method |
Without |
Yes – without scaling |
yes |
When the radiological eye is led to tiny details by looking at the full field x-ray mammography images from a synthetic viewpoint, the diagnostic reports are improved. The contribution of this work is to present an alternative view on full-field digital mammograms that require an advanced supervised learning method. Using the x-ray breast cancer mammogram images from each CC and MLO view, a synthetic mammography image is produced using the proposed method. The strong points of interest on each side of the mammography view have been established in an effective manner by addressing the findings of the proposed approach. The advancement of computer-aided medical applications is facilitated by these points. The proposed method was developed as well for segmenting the breast cancer tumor from the x-ray mammography images. Finding the strong points of interest on the cancer tumor's border, where its texture and form differ on both sides of the mammography views, is made possible by extracting the tumor. By integrating both sides of the mammography view, the proposed method provides a visualization indication of the synthetization view. The synthetization view allows radiologists to diagnose tiny features of the cancerous growth accurately and simultaneously. The supervised learning technique has been implemented in the suggested method, which generates a synthetization view based on several features. When there aren't enough features to construct the synthetization, the proposed method allows the computer-aided medical application to select different features.
Furthermore, the digital synthesizing view of the breast cancer will be implemented in future based on the advanced deep learning techniques for improving the visual synthetization and deeply generating the radiological reports.
This study was supported in part by Tafila Technical University grants. The first author was sponsored by a Fulbright scholarship while he was in USA.
[1] Chikarmane, S. (2022). Synthetic mammography: Review of benefits and drawbacks in clinical use. Journal of Breast Imaging, 4(2): 124-134. https://doi.org/10.1093/jbi/wbac008
[2] Kalu, C.K. (2023). Analytical optimization of X-ray mammography for increased benefits and safety; using: Data analytics, electronics engineering and artificial intelligence. Journal of Health Statistics Reports, 2(2): 109. https://doi.org/10.47363/JHSR/2023(2)109
[3] Zhang, M., Mesurolle, B., Theriault, M., Meterissian, S., Morris, E.A. (2023). Imaging of breast cancer–beyond the basics. Current Problems in Cancer, 47(2): 100967. https://doi.org/10.1016/j.currproblcancer.2023.100967
[4] Prodan, M., Paraschiv, E., Stanciu, A. (2023). Applying deep learning methods for mammography analysis and breast cancer detection. Applied Sciences, 13(7): 4272. https://doi.org/10.3390/app13074272
[5] Alyafi, B., Diaz, O., Marti, R. (2020). DCGANs for realistic breast mass augmentation in x-ray mammography. Medical Imaging 2020: Computer-Aided Diagnosis, 11314: 473-480. https://doi.org/10.1117/12.2543506
[6] Rahman, H., Naik Bukht, T.F., Ahmad, R., Almadhor, A., Javed, A.R. (2023). Efficient breast cancer diagnosis from complex mammographic images using deep convolutional neural network. Computational Intelligence and Neuroscience, 2023(1): 7717712. https://doi.org/10.1155/2023/7717712
[7] Cha, K.H., Petrick, N., Pezeshk, A., Graff, C.G., Sharma, D., Badal, A., Sahiner, B. (2020). Evaluation of data augmentation via synthetic images for improved breast mass detection on mammograms using deep learning. Journal of Medical Imaging, 7(1): 012703. https://doi.org/10.1117/1.JMI.7.1.012703
[8] Gadde, S. (2023). Advances in breast imaging and intervention. In Holistic Approach to Breast Disease, pp. 477-488. https://doi.org/10.1007/978-981-99-0035-0_35
[9] Mohammadi, S., Livani, M.A. (2023). A review of CAD systems for breast mass detection in mammography based on deep learning. Preprints. https://doi.org/10.20944/preprints202305.1832.v1
[10] Di Maria, S., Vedantham, S., Vaz, P. (2022). X-ray dosimetry in breast cancer screening: 2D and 3D mammography. European Journal of Radiology, 151: 110278. https://doi.org/10.1016/j.ejrad.2022.110278
[11] Sarno, A., Valero, C., Tucciariello, R.M., Dukov, N., Costa, P.R., Tomal, A. (2023). Physical and digital phantoms for 2D and 3D x-ray breast imaging: Review on the state-of-the-art and future prospects. Radiation Physics and Chemistry, 204: 110715. https://doi.org/10.1016/j.radphyschem.2022.110715
[12] Grigoryants, N.F., Sass, S., Alexander, J. (2023). Novel technologies in breast imaging: A scoping review. Cureus, 15(8): e44061. https://doi.org/10.7759/cureus.44061
[13] Teklić, J., Matijaš, T. (2023). Comparison between breast magnetic resonance imaging and contrast-enhanced mammography. Hrvatski Časopis Zdravstvenih Znanosti, 2(3): 108-119. https://doi.org/10.48188/hczz.3.2.6
[14] Yamazaki, A., Ishida, T. (2022). Two-view mammogram synthesis from single-view data using generative adversarial networks. Applied Sciences, 12(23): 12206. https://doi.org/10.3390/app122312206
[15] Marcon, M., Fuchsjäger, M.H., Clauser, P., Mann, R.M. (2024). ESR Essentials: Screening for breast cancer-general recommendations by EUSOBI. European Radiology. https://doi.org/10.1007/s00330-024-10740-5
[16] Tsarouchi, M.I., Hoxhaj, A., Mann, R.M. (2023). New approaches and recommendations for risk-adapted breast cancer screening. Journal of Magnetic Resonance Imaging, 58(4), 987-1010. https://doi.org/10.1002/jmri.28731
[17] Chikarmane, S.A., Offit, L.R., Giess, C.S. (2023). Synthetic mammography: Benefits, drawbacks, and pitfalls. Radiographics, 43(10): e230018. https://doi.org/10.1148/rg.230018
[18] Abeelh, E.A., AbuAbeileh, Z. (2024). Comparative effectiveness of mammography, ultrasound, and MRI in the detection of breast carcinoma in dense breast tissue: A systematic review. Cureus, 16(4): e59054. https://doi.org/10.7759/cureus.59054
[19] Park, S., Lee, K.H., Ko, B., Kim, N. (2023). Unsupervised anomaly detection with generative adversarial networks in mammography. Scientific Reports, 13(1): 2925. https://doi.org/10.1038/s41598-023-29521-z
[20] Velayuthapandian, K., Karuppiah, G., Vadivel, S.R.S., Joseph, D.R.V. (2024). Mammogram data analysis: Trends, challenges, and future directions. In Computational Intelligence and Modelling Techniques for Disease Detection in Mammogram Images, pp. 1-38. https://doi.org/10.1016/B978-0-443-13999-4.00016-X
[21] Jiménez-Gaona, Y., Carrión-Figueroa, D., Lakshminarayanan, V., Rodríguez-Álvarez, M.J. (2024). Gan-based data augmentation to improve breast ultrasound and mammography mass classification. Biomedical Signal Processing and Control, 94: 106255. https://doi.org/10.1016/j.bspc.2024.106255
[22] Shah, D., Ullah Khan, M.A., Abrar, M. (2024). Reliable breast cancer diagnosis with deep learning: DCGAN-Driven mammogram synthesis and validity assessment. Applied Computational Intelligence and Soft Computing, 2024(1): 1122109. https://doi.org/10.1155/2024/1122109
[23] Van Schie, G., Mann, R., Imhof-Tas, M., Karssemeijer, N. (2013). Generating synthetic mammograms from reconstructed tomosynthesis volumes. IEEE Transactions on Medical Imaging, 32(12): 2322-2331. https://doi.org/10.1109/TMI.2013.2281738
[24] Greer, L.R. (2014). The benefits of using synthesized 2D (C-View™) images in breast tomosynthesis exams. Applied Radiology, 43(11): 11-14.
[25] Zheng, J., Fuentes, O., Leung, M.Y. (2010). Super-resolution of mammograms. In 2010 IEEE Symposium on Computational Intelligence in Bioinformatics and Computational Biology, Montreal, QC, Canada, pp. 1-7. https://doi.org/10.1109/CIBCB.2010.5510384
[26] Shen, T., Gou, C., Wang, J., Wang, F. Y. (2020). Collaborative adversarial networks for joint synthesis and segmentation of x-ray breast mass images. In 2020 Chinese Automation Congress (CAC), Shanghai, China, pp. 1743-1747. https://doi.org/10.1109/CAC51589.2020.9326848
[27] Abdel-Nasser, M., Moreno, A., Abdelwahab, M.A., Saleh, A., Abdulwahab, S., Singh, V.K., Puig, D. (2019). Matching tumour candidate points in multiple mammographic views for breast cancer detection. In 2019 International Conference on Innovative Trends in Computer Engineering (ITCE), Aswan, Egypt, pp. 202-207. https://doi.org/10.1109/ITCE.2019.8646516
[28] Duan, X., Qin, G., Ling, Q., Wang, S.N., Xu, Z.Y., Zeng, H., Li, B., Chen, W.G., Zhou, L.H., Xu, Y. (2019). Matching corresponding regions of interest on cranio-caudal and medio-lateral oblique view mammograms. IEEE Access, 7: 31586-31597. https://doi.org/10.1109/ACCESS.2019.2902854
[29] Dhivya, S., Mohanavalli, S., Karthika, S., Shivani, S., Mageswari, R. (2020). GAN based data augmentation for enhanced tumor classification. In 2020 4th International Conference on Computer, Communication and Signal Processing (ICCCSP), Chennai, India, pp. 1-5. https://doi.org/10.1109/ICCCSP49186.2020.9315189
[30] Fan, Y., Jiao, J. (2021). Mammography Data Augmentation Using ACGAN. In Proceedings of the 2nd International Symposium on Artificial Intelligence for Medicine Sciences, Beijing, China, pp. 431-437. https://doi.org/10.1145/3500931.3501004
[31] Bai, J., Posner, R., Wang, T., Yang, C., Nabavi, S. (2021). Applying deep learning in digital breast tomosynthesis for automatic breast cancer detection: A review. Medical Image Analysis, 71: 102049. https://doi.org/10.1016/j.media.2021.102049
[32] Tan, M., Al-Shabi, M., Chan, W.Y., Thomas, L., Rahmat, K., Ng, K.H. (2021). Comparison of two-dimensional synthesized mammograms versus original digital mammograms: A quantitative assessment. Medical & Biological Engineering & Computing, 59: 355-367. https://doi.org/10.1007/s11517-021-02313-1
[33] Alsolami, A.S., Shalash, W., Alsaggaf, W., Ashoor, S., Refaat, H., Elmogy, M. (2021). King abdulaziz university breast cancer mammogram dataset (kau-bcmd). Data, 6(11): 111. https://doi.org/10.3390/data6110111
[34] Jiang, G., Wei, J., Xu, Y.S., He, Z.L., Zeng, H., Wu, J.F., Qin, G.G., Chen, W.G., Lu, Y. (2021). Synthesis of mammogram from digital breast tomosynthesis using deep convolutional neural network with gradient guided cGANs. IEEE Transactions on Medical Imaging, 40(8): 2080-2091. https://doi.org/10.1109/TMI.2021.3071544
[35] Pardo, A., Streeter, S S., Maloney, B.W., Gutiérrez-Gutiérrez, J.A., McClatchy, D.M., Wells, W.A., Paulsen, K.D., López-Higuera, J.M., Pogue, B.W., Conde, O.M. (2021). Modeling and synthesis of breast cancer optical property signatures with generative models. IEEE Transactions on Medical Imaging, 40(6): 1687-1701. https://doi.org/10.1109/TMI.2021.3064464
[36] Klein, D.S., Lago, M.A., Abbey, C.K., Eckstein, M.P. (2023). A 2D synthesized image improves the 3D search for foveated visual systems. IEEE Transactions on Medical Imaging, 42(8): 2176-2188. https://doi.org/10.1109/TMI.2023.3246005
[37] Zeng, B., Yu, K., Gao, L., Zeng, X., Zhou, Q. (2021). Breast cancer screening using synthesized two-dimensional mammography: a systematic review and meta-analysis. The Breast, 59: 270-278. https://doi.org/10.1016/j.breast.2021.07.016
[38] Tzortzis, I.N., Davradou, A., Rallis, I., Kaselimi, M., Makantasis, K., Doulamis, A., Doulamis, N. (2022). Tensor-based learning for detecting abnormalities on digital mammograms. Diagnostics, 12(10): 2389. https://doi.org/10.3390/diagnostics12102389
[39] Wang, X., Tan, T., Gao, Y., Han, L.Y., Zhang, T.Y., Lu, C.Y., Beets-Tan, R., Su, R.S., Mann, R. (2023). DisAsymNet: Disentanglement of asymmetrical abnormality on bilateral mammograms using self-adversarial learning. In International Conference on Medical Image Computing and Computer-Assisted Intervention, Vancouver, BC, Canada, pp. 57-67. https://doi.org/10.1007/978-3-031-43990-2_6
[40] Manishkumar, S.H., Saranya, P. (2022). Detection and Classification of Breast Cancer from Mammogram Images Using Adaptive Deep Learning Technique. In 2022 6th International Conference on Devices, Circuits and Systems (ICDCS), Coimbatore, India, pp. 327-331. https://doi.org/10.1109/ICDCS54290.2022.9780770
[41] Amethiya, Y., Pipariya, P., Patel, S., Shah, M. (2022). Comparative analysis of breast cancer detection using machine learning and biosensors. Intelligent Medicine, 2(2): 69-81. https://doi.org/10.1016/j.imed.2021.08.004
[42] Zheng, X. (2023). Segmentation for Images of a Single Stem Cell Using Morphological Operations and Statistical Region Merging. In 2023 8th International Conference on Signal and Image Processing (ICSIP), Wuxi, China, pp. 171-175. https://doi.org/10.1109/ICSIP57908.2023.10270995
[43] Villemur, M., Sengupta, J.P., Julian, P., Andreou, A.G. (2022). Morphological, object detection framework for embedded, event-based sensing. In 2022 8th International Conference on Event-Based Control, Communication, and Signal Processing (EBCCSP), Krakow, Poland, pp. 1-7. https://doi.org/10.1109/EBCCSP56922.2022.9845661
[44] Mahoro, E., Akhloufi, M.A. (2023). Breast masses detection on mammograms using recent one-shot deep object detectors. In 2023 5th International Conference on Bio-engineering for Smart Technologies (BioSMART), Paris, France, pp. 1-4. https://doi.org/10.1109/BioSMART58455.2023.10162036
[45] Luo, S., Ba, R. (2020). Image recognition and tracking of flowing sub-flame in downward fire of building insulation materials: A Method based on image morphology, SVM and db-scan algorithm. In 2020 7th International Conference on Information Science and Control Engineering (ICISCE), Changsha, China, pp. 710-713. https://doi.org/10.1109/ICISCE50968.2020.00151
[46] Rajasree, P.M., Jatti, A., Santosh, D., Desai, U., Krishnappa, V.D. (2022). Breast masses detection and segmentation in full-field digital mammograms using unified convolution neural network. In 2022 44th Annual International Conference of the IEEE Engineering in Medicine & Biology Society (EMBC), Glasgow, Scotland, United Kingdom, pp. 1002-1007. https://doi.org/10.1109/EMBC48229.2022.9871866
[47] Harine, M.S., Induja, H., Kumar, A., Sasikala, S. (2023). Improved breast cancer detection using wavelet based image enhancement. In 2023 2nd International Conference on Advancements in Electrical, Electronics, Communication, Computing and Automation (ICAECA), Coimbatore, India, pp. 1-6. https://doi.org/10.1109/ICAECA56562.2023.10200940
[48] Priya, T.S., Ramaprabha, T. (2020). An effective feature extraction based particle swarm optimization with support vector machine for biomedical mammogram image diagnosis. In 2020 International Conference on Inventive Computation Technologies (ICICT), Coimbatore, India, pp. 348-352. https://doi.org/10.1109/ICICT48043.2020.9112486
[49] Razali, N.F., Isa, I.S., Sulaiman, S.N., Karim, N.K.A., Osman, M.K. (2023). Color-assisted multi-input convolutional neural network for cancer classification on mammogram images. In 2023 19th IEEE International Colloquium on Signal Processing & Its Applications (CSPA), Kedah, Malaysia, pp. 30-35. https://doi.org/10.1109/CSPA57446.2023.10087371
[50] Gaikwad, S., Bhatlawande, S., Chavare, R., Joshi, R., Ingale, A., Vaishale, A., Shilaskar, S. (2023). Fusion of vision based features for human activity recognition. In 2023 International Conference on Applied Intelligence and Sustainable Computing (ICAISC), Dharwad, India, pp. 1-7. https://doi.org/10.1109/ICAISC58445.2023.10199987
[51] Tyagi, A., Bansal, S., Kashyap, A. (2020). Comparative analysis of feature detection and extraction techniques for vision-based ISLR system. In 2020 Sixth International Conference on Parallel, Distributed and Grid Computing (PDGC), Waknaghat, India, pp. 515-520. https://doi.org/10.1109/PDGC50313.2020.9315777
[52] Cui, Y., Tang, T., Zhou, X., Ji, K. (2021). SAR image classification algorithm based on improved SIFT features. In 2021 Photonics & Electromagnetics Research Symposium (PIERS), Hangzhou, China, pp. 2024-2033. https://doi.org/10.1109/PIERS53385.2021.9695042
[53] Al-Refai, G., Al-Refai, M., Banitaan, S., Ghasemi, Z. (2020). Shared images in a connected-vehicle network registration system using Harris-Stephens approach. In 2020 IEEE International Conference on Electro Information Technology (EIT), Chicago, IL, USA, pp. 47-52. https://doi.org/10.1109/EIT48999.2020.9208326
[54] Sun, R., Zhang, J., Kang, J. (2022). An covariance spectrum sensing algorithm based on DMM/MME mixture features. In 2022 8th Annual International Conference on Network and Information Systems for Computers (ICNISC), Hangzhou, China, pp. 474-479. https://doi.org/10.1109/ICNISC57059.2022.00100
[55] Osti, M.S., Ortega, J.C.P., Hurtado, E.G., Flores, C.G.R., Licea, M.L.A.S. (2022). Comparison of key point detector methods for microcalcification’s ROI identification on breast images: An alternative to SIFT. In 2022 19th International Conference on Electrical Engineering, Computing Science and Automatic Control (CCE), Mexico City, Mexico, pp. 1-6. https://doi.org/10.1109/CCE56709.2022.9975910
[56] Sonar, P., Bhosle, U., Choudhury, C. (2017). Mammography classification using modified hybrid SVM-KNN. In 2017 International Conference on Signal Processing and Communication (ICSPC), Coimbatore, India, pp. 305-311. https://doi.org/10.1109/CSPC.2017.8305858