Zeyd Saeed*![]() | Ahmed Saleem Abbas
| Ahmed Saleem Abbas![]()
© 2024 The authors. This article is published by IIETA and is licensed under the CC BY 4.0 license (http://creativecommons.org/licenses/by/4.0/).
OPEN ACCESS
In software, competition in producing high-quality products has become a prominent factor for business success. In this regard, identifying and defining software quality metrics (SQM) to discover and continuously enhance current quality systems is very important. However, it is advisable to study and review current studies in this field, so that it is possible to analyze the current situation, and it also enables us to formulate expectations regarding future research areas. This research is concerned with studying and analyzing a large number of articles, focusing on the research literature published over the past decade. 70 research papers, articles, and conference papers were selected and analyzed, published from 2009 to 2023. A detailed description of these researches and their titles SQM was conducted. We used graphics, explanations, and structure design to display the results. The outputs from this research indicate the underlying knowledge in this field and the measurement mechanism and include trends between 2009 and 2023 and the gaps that are supposed to be available for study and development in this field. The study and analysis of articles aim to review studies, direct future studies, and focus on system development. Future studies encourage the adoption of quality metrics. Quality metrics include several areas of development systems, including network performance, and the Cloud of Things, which directs the adoption of more accurate metrics and components reusability, artificial intelligence, model performance, and predictive capacity metrics.
software quality metrics, standard metrics, quality metrics
Software quality has several criteria. The IEEE 1061:1998 metrics present it as a mathematical function. This function deals with data. The function entry data is code data, while the results are numbers. The numbers are defined and interpreted concerning the system whose quality has been approved. The value expresses the property of that system from the designer's point of view and indicates efficiency and robustness [1].
With continuous software development and huge diverse metrics adopted, it is a critical topic to adopt a more efficient software system from among many designed systems. In this regard, studying and determining the SQM will be tested to detect the quality status of the systems, and then maintain the continuity of systems integrity, which has gained great importance in the software industry.
Various programs, the best of which can be used based on the values provided by the metrics. This is what was mentioned in the article by Tom DeMarco. There are a huge number of international standards that can be relied upon to evaluate systems [2].
Tom DeMarco's study in his article seeks to collect many research papers, analyze them, and tie them in a relevant way with SQM, examining these research papers based on their titles, abstracts, proposed methods, and conclusions.
Software quality is measured through the results provided by metrics, which can be analyzed and studied, as they provide details that express the quality and efficiency of the systems [3]. For example, if the result of a metric is a negative value deviating from the threshold, then an emergency alternative plan will be taken to improve the system [4].
These metrics constitute protection for systems and a safety belt for companies. Each system can be evaluated using many different metrics. It is important to choose the appropriate metric for the system. inappropriate metrics if chosen by software designers, will cause the system to deteriorate for clients [5]. In other words, if the selected metrics have not been verified for their efficiency, and are ineffective in achieving the goals, the data is likely to indicate incorrect results. For example, the graphs show the data for a smooth process, but in reality, the systems may be inappropriate for the company, which exposes it to bankruptcy.
In 2005 [6], Global Quality stated in its report that the use of metrics showed 40% of the rate of detecting defects in the system before delivering it to customers, in contrast, the same study showed that user satisfaction with these programs amounted to only about 40%, which indicates conformity validity of metrics with customer opinion. In the same report, it is shown that SQM mapping is an important process for increasing product quality. However, the current quality standards for the product are handled very carefully, to ensure the quality of international standards.
Several prominent studies are interested in studying and analyzing systems. The integration of the capability maturity model is one of the important studies that provides a vision of the project management approach, the extent of the contribution of systems to the labor market, and the development of modern designs for systems. The two studies: Capability Maturity Model Integration, presented a prominent abstract work for systems analysis, and the study, Project Management Body of Knowledge, presented a comprehensive vision for systems measurement analysis [7] and is characterized by fast performance and continuous enhancement. However, in the study of Casale et al. [8], where Casale confirmed that programs, systems, and projects must be subject to a continuous development process, accompanied by monitoring of metrics and the extent of evaluation of the quality of the developed systems. Through the study and analysis of ISO 25010 [9], the prediction of the quality of system products through the analysis of software quality models and standards. Since, in reviewing and analyzing the studies mentioned earlier, we find that the article has a methodology. It is a statistical study that shows the mechanism of the metrics and classifies them according to modernity. The aim of this study is the possibility of using modern metrics and harnessing them in the fields of trendy development systems. The study by Garousi et al. [10] describes an experience that states it provides research skills that can be able to reuse by other researchers. In addition, this study takes empirical data and applies methodological and objective metrics to it, to benefit from the research questions, the answer is to some research questions that have been identified [11]. When the SQM-related articles were studied and analyzed, only a few studies were found regarding the systems of object-oriented programs. No comprehensive detailed study was found regarding SQM-related metrics, this methodology has been developed to be useful to researchers and developers. However, it has been observed in most previous studies in this field that metrics are studied in a specific and insufficient field of SQM. Casale et al. [8] emphasized the growing study of metrics in this area.
To achieve these goals, the main objective is to study how to develop metrics for SQM over the past decade, and to identify gaps and patterns in this direction.
SQA will be useful and important for researchers in the field of quality assurance of systems and product quality for companies. In this article, we will extract SQM data from the years 2009 to 2023, and spot and define metrics, patterns, and gaps in this field [10]. Many methods and approaches have enabled many researchers and practitioners to study and diagnose the considered metrics that determine software quality. The mechanisms followed to draw a complete map aim to study and design the interconnected relationships of systems and link them in a structural form that helps researchers study the characteristics of that structure, and study the features and characteristics of structures and improve them.
The rest parts of the paper are arranged as follows: the second part offers information about models of software quality, some background information for software quality metrics, and research-related papers on SQM. The third part is the research method, research questions (RQs), criteria for selecting the papers, and an outline of the criteria, and includes quality evaluation and the data extracted from the studies, part relates to evaluating the responses to the research questions. The fourth includes conceptual maps of the quality of measures and quality SQM and includes a comparison with other research papers. The fifth part includes a discussion of the validity of the result. The sixth part includes conclusions and suggestions.
How can the system's quality, programs, and applications be defined? It is defined as a grade attachment to the system, this grade reflects a certain degree of the features and characteristics of that system, which requires designers CMMI v2.0 to redesign or improve the system to solve a specific issue [4]. Software feature is well-defined by the International Software Testing Qualification Board (ISTQB) as the sum of topographies and functional features of a particular creation that affect fulfilling the declared and implicit requirements of the overall product [12]. IEEE 1061:1998, Metrics are defined as a function, the output of this function expresses the degree of system quality, and the resulting value declares the system characteristics, in several stages if it is in an intermediate stage during the development of the program, or in its final stage of development [1].
The ISO/IEC 25000 standard, is distinct as a “quality archetypal”, and deals with several related characteristics, and the interrelationship between them, and provides specific mechanisms to meet quality requirements [13]. Each model consists of characteristics to determine quality, and other sub-characteristics such as reusability, reliability, etc. To contribute effectively to improving product quality, it will be through the use of standards that fit and affect the quality characteristics.
The ISO 9126 standard, which represents product quality standards for software engineering systems, has been analyzed and revised by ISO 25010: 2005 [14]. The ISO 25010:2005 standard provides a comparison of the following three newly classified quality models, namely Quality in Use (QinU), which is one of the standards for measuring the quality of web applications, represents the user’s point of view, and is defined as the degree of measuring the efficiency and performance of the system, and contains measures including system analysis and risk analysis. Software Product Quality (SPQ), is one of the widely used quality standards, such as ISO 25000 Square and ISO 9001, which provide several standards for measuring the quality of systems and the quality management system. In addition, several institutions have developed their quality management systems, such as OMC S.p.A. and EHSQ quality management system, Data Quality (DQ), is a measure that indicates the state of qualitative or quantitative information, and if the DQ score is high, it indicates that the system is “suitable for its intended uses in operations, decision-making, and planning.” DQ provides other metrics to measure data management integrity, accuracy, consistency, timeliness, and validity. It provides mechanisms to protect data from changes and exceptions through quality control to ensure the reliability and usefulness of the data [15]. The quality of any application is defined as the degree of characteristics related to the application, and each characteristic has a degree of correlation. Calculate the correlation characteristics of each model of the application with other models in ISO 25010 [15] and ISO 25012 [16]. In a previous analysis, the definition of SQM was mentioned as providing several measurement metrics, including IEEE 1061:1998, as it represents the degree of measurement of the designers’ orientation towards several characteristics related to the documents related to the project, as well as the codes on which the project is based [1]. Metrics are usually classified by designers on several levels. These levels represent the application life cycle. Requirements are the first stage of system design, as metrics designers have included these metrics at the first stage, in the early stages of the system life cycle, user requirements are divided into functional and non-functional requirements, so metrics have been created to measure functional and non-functional requirements. The second stage of the application life cycle is coding in object-oriented programming is divided into classes, subclasses, methods, and access fields, and metrics have been created to measure the coupling and cohesion between classes and subclasses. The third stage is design; several metrics have been created at the highest code level of design. The last stage is the testing level, at this level there are many proposed metrics and they are general and are used to measure the degree of generality of the system.
In SQM management, we have some paradigms specific to the code level [16]: Which can be defined as the lack of coherence in method (LCOM) as the number of classes in which a local relationship is relative to the non-intersected relationship with the global method's classes, the local instance variable is considered to be related to the degree of local methods correlation. If we want to measure the number of classes with ancestors that reflect the depth of the inheritance tree (DIT), which can be affected by this measurement. The tree consists of the nodes and the path between the nodes, where the node represents the class, and the distance of any track between any two bumps is the maximum depth, representing the DIT scale from the root of the tree to the leaves. The following two are class-level standards, LCOM and DIT. Another important measure is the detection of Defect Density (DD) in SQM, and its task is to detect the defect generated during program execution during its life cycle. When calculating the amount of flaws and dividing by the volume of the produce, Defective Density Delivered” (DDD) is extracted. These two metrics are project-level test DD and DDD metrics.
Examples of SQM, which provide several attributes of quality presented in ISO 25010 and ISO 25012, can be mentioned: The first one is to measure the system failures based on the mean time between system failures (mean time between failures metric (MTBF)), is a measure established for application maintenance and represents the average execution time for a system or component to operate without failure. It is a significant degree and represents the amount of reliability of the system. The MTBF formula is designed by distributing the entire operating phase by the number of failures that occur during that period.
At the same time, MTBF be able to be classified as many quality features at the application level and its relation to SQP. The client's opinion and opinion are a prominent indication of the use of the system and knowledge of the quality metrics of the Qin [4]. Data quality often depends on quality aspects such as refactoring, and compatibility; on the other hand, integrity, recoverability, traceability, and portability are to the originality of the data in the program [3]. Another attribute is measuring portability which is defined as the transfer of source code from one software to the detached atmosphere, the ER metric is a tool to quantity system source code and create an environment target compatibility.
2.1 Related work
The literature review and the study related to SQM were discussed. Table 1 contains the reviews and literature of the studies within the scope and content of their differences. Table 1 covers the studies of the articles related to the software system quality metrics and measures. Otherwise, the literature review in this article differs from the one mentioned in the table. Table 1 offers a comparison made to include the previous works extracted based on papers titles and abstracts of research, methods used, and practical implications. In addition, our work focused mainly on measures that were applied at all levels of development that aim to increase the product quality of the program for the types of software and various applications. In the study of Fenton and Bieman [17] identified the most used metrics and measurable properties in OO software. Highlighted most used statistical techniques/models for quality evaluation. Ultimately, for systematic mapping, the aim of which is to identify the metrics of systems, applications, and statistical features, in this study 79 manuscripts out of a total of 8231 were analyzed.
The study presented in Table 1 shows that the only study similar to ours is by Santos et al. [18], which focuses on metrics related to object-oriented programs for the years 2004-2013. Through the study by Erdem et al. [19], we noticed that it is relevant to our current study. In the study, the analysis is conducted by selecting a set of system patterns that support the architectures. In the same study, research questions related to publishing and a different number of types of research were examined. Where the RQs were taken for the same work, principles related to the research, and various published articles, defined the descriptive models, taking into account the common elements in system quality models and software engineering supporting quality models. Also, there is not enough data and information available about SQM, as we referred to in this article. Then, the RQs are different within the scope and method of our current study. The years between 2009 and 2023 were chosen for detailed study and analysis because SQM contains diverse and wide-ranging content. Therefore, this study expands the scope of research questions RQs on SQM and accuracy.
In this paper by Santos et al. [18], quality measures of importance in agile software development were reviewed and discussed, as well as their applicability and challenges in assessing productivity and quality in an agile environment. Maintainability prediction by using machine learning approaches has been reviewed related to object-oriented software in the study by Erdem et al. [19], the study from 1991 to 2018 points out little indicates in the maintainability prediction area, in contrast, many other software quality metrics. In the study by Olorunshola et al. [20], machine learning is one of the useful techniques for quality metrics, used by AI designers in combination with software quality metrics, defect detection, and prediction of efficient system models. The goal of this research is to judge and analyze software quality measurement, helping developers identify weaknesses in the software. The study of Aguileta and Gómez [21] used global information and communication technology (ICT) that performs estimation in quality practice software and the output indicates enhanced capacity and product metrics quality. The empirical and mixed approaches used (repository analysis, interviews for consultations, and overview article) induced the benefits of ICT enterprise for optimizing measuring structure. In the study of Keele [22], Human-computer interaction (HCI) is adapted to correlate between the e-commerce website and the survey article and compared by using heuristic approaches to reveal the maximum serviceable website (amazon, daraz, Flipkart, Alibaba). The goal paper refers to designing and developing software quality metrics and providing good use to the application related to e-commerce with the best experience.
Table 1. List of the most important studies
|
Year |
Ref. |
Article Title |
Work Domain |
|
2022 |
[23] |
How deadline orientation and architectural modularity influence software quality and job satisfaction. |
This paper includes a study of higher directives and their positive interaction in combination with the deadline, product modularity, and its impact on product quality and customer satisfaction. The study lies in the correlation between the technical characteristics of the quality product and the time required and preferred by the developers. |
|
2021 |
[24] |
A reference measurement framework of software security product quality (SPQNFSR). |
It includes a metric to measure the size of security requirements within the level of functional and non-functional security, and by using international standards, as is the case in the study of the automatic teller machine, which includes measuring security requirements to give the user a high safety rate and a reliable judgment. |
|
2020 |
[25] |
A survey on software defect prediction using deep learning. |
This study describes a survey study on the use of deep learning techniques, and a study on predicting program defects, gives a detailed analysis of future works, and discusses system problems, codes, and offered trends in this field. |
|
2019 |
[26] |
Co-occurrence of design patterns and bad smells in software systems: An exploratory study. |
- It is not necessary to get rid of the smell class in software by relying on building pattern design. - Dealing with some design patterns is good for designing high-level quality systems, while other patterns require care out implementation. |
|
2019 |
[27] |
Longitudinal evaluation of software quality metrics in open-source applications. |
The study in this article proposes metrics to estimate values for longitudinal evaluation systems, and the relationship of these values evaluates them on three open-source applications and contributes to identifying appropriate characteristics of software quality. |
|
2018 |
[28] |
A suite of object oriented cognitive complexity metrics. |
This article proposes several metrics to quantify method complexity, message complexity, feature complexity, and object-oriented (OO) class through cognitive metrics. The complexity results from the deep inheritance of the system. |
|
2018 |
[29] |
Prediction of software defects using object-oriented metrics. |
This article describes metrics as a proposed technique based on the CK metric, which is a technique that can be applied to all features for object-oriented inclusively and for all classes. |
|
2017 |
[30] |
Metric-based software reliability prediction approach and its application. |
The article proposed an approach to the use of a set of metrics for systems in various stages of the software life cycle, and the results show development in the software life cycle and a good indicator of the quality of the software product. |
|
2016 |
[31] |
Deriving thresholds of software metrics to predict faults on open source software: Replicated case studies. |
Using a threshold in a set of data and different programming languages, where it can be analyzed with a wide scope of data or the use of multiple different programming languages. |
|
2015 |
[32] |
Improving software quality based on the relationship between the change proneness and object-oriented metrics. |
This work shows that some of the effects on programs are confusing in change predicting, and also other factors have a high effect such as class size and system environment. Also, we have many open source systems with a large size that can be applied to this work and produce good results and are more acceptable if we use an optimization algorithm such as the algorithm genetics and colonies. |
|
2014 |
[33] |
A new metric for predicting software change using gene expression programming. |
This paper examines Chidamber and Kemerer's metrics and validates the construction of a model that can adapt programs subject to change and improve product quality for them, as well as suggests using a new metric that predicts change in the early stages of the system life cycle during development. |
|
2013 |
[34] |
A mapping study to investigate component-based software system metrics. |
This article presents a conceptual study mapping several proposed criteria and metrics to measure the quality of CBSS. Also, 17 proposals for the quality of a CBSS implementation are to be tested, and on the other hand, 14 proposals for heterogeneous implementations to assess individual components individually. |
|
2012 |
[35] |
A critical survey of security indicator approaches. |
This article reviewed the current systems in security measurement in quantitative and qualitative types, describing the available measurement techniques and the effective thresholds, or the obstacles that were studied and their impact on preventing progress in the research field. |
This method is adopted by a paper that is approved, as suggested by Kohl et al. [36]. Accordingly, the revision in this article includes a set of main steps: processing the research and its development method, quality standard and evaluation of the goals after they are identified, the appropriate method for selecting papers and organizing the research, dealing with data and the method of extracting it, then collecting it and the method of obtaining results, discussions, validating the results, Inferences, and conclusions.
3.1 Study Methods Evaluation
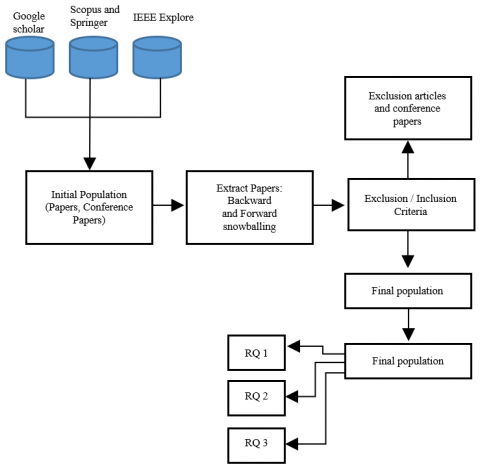
The study is presented in Figure 1. We select the article or paper based on search words and for the rest of the papers, the Containment/exception criteria are adopted. The next step is to arrange the papers and classify them into several groups relative to several criteria taken from the answer RQs. Then we rely on the data after classification to form the study appropriately. We used several search engines, as shown in Figure 1, search engines are highlighted in dark color.
Initially, when studying the research, preliminary research based on the infrastructure was taken and analyzed carefully to ensure that results were obtained in terms of validity and accuracy. Several studies and comparison tools were examined [37], and the CADIMA tool (version 2.1.3) [38] was used. This gives a simplified mechanism for eliminating duplicate papers and neglecting incomplete texts.
3.2 Research questions
Three groups of research questions were adopted in this study, the first of which is bibliometric for analytical and demographic questions, the second is the technical evaluation questions, and the third is the study of gaps by analyzing the papers and highlighting future guidelines boundaries, and holes. Table 2 lists the RQs along.
Figure 1. The overview research method
Table 2. Represent related research questions
|
RQ |
Attribute |
Answer |
|
RQ 1.1 |
What papers were cited throughout 2009-2022? |
Citation count, Normalize citation count. |
|
RQ 1.2 |
what are the accepted and preferred publishing repositories? |
The objective of the papers. |
|
RQ 2.1 |
What is the method type that is applied in the articles? |
Data-Analytical, methods-empirical. |
|
RQ 2.2 |
What are the common types of research methods adopted in papers? |
Qoal Question Measures, Novel, Practical Software Metrics, Fuzzy. |
|
RQ 2.3 |
What is the SQM that appears in papers? |
Coupling, Cohesion. |
|
RQ 3.1 |
What are the metric levels that are often applied in the papers? |
The first level of the system life cycle is requirements. Requirements are divided into functional requirements and non-functional requirements. The second level is the class level, and the third level is the test level. |
|
RQ 3.2 |
What metrics level can be applicable, and in which domain? |
Web-side applications, phone applications, AI, Robot, historical, and others. |
|
RQ 2.4 |
What statistical data process is adapted to support new metrics? |
Machine learning, adjectival analysis, correlation trial, variable length genetic algorithm, swarm algorithm. |
|
RQ 2.5 |
Which of the patterns has been adopted in the papers: standard pattern, practical pattern, and what is the measure of product quality? |
ISO 15504, ISO /IEC 1220, IEEE 1061, CMMI, and others. |
|
RQ 2.6 |
What kind of product quality models were used in the articles? |
McCall, FURPS, ISO 916, ISO 25012. |
|
RQ 2.7 |
Which quality attribute of SQM in ISO 25010 was measured in the papers? |
Suitability, performance efficiency, reliability, compatibility. |
|
RQ 2.8 |
Which model is QinU related to quality attribute and ISO 25010 product quality measure? |
Effectiveness, efficiency, satisfaction. |
|
RQ 2.9 |
Which DQ model is an ISO 25012 quality model? |
Accessibility, consistency, completeness, accuracy, portability, precision, and others. |
|
RQ 2.10 |
Which stage of the system development life cycle is most commonly used and covered in the majority of papers? |
Planning, requirement, design, code. |
|
RQ 2.11 |
What types of programming languages have been included in SQM in the article? |
Object-oriented programming (OOP), scripting programming, basic programming language, and others. |
|
RQ 2.12 |
Is there any SQM related to the SDLS model? |
Waterfall, iterative, agile, product line, other. |
|
RQ 2.13 |
What are the threshold values for production quality measures, and were they mentioned in the articles, or not? |
Yes, no. |
|
RQ 2.14 |
Do product quality metrics attributes have fundamental information in our study of software product quality management? |
Metrics tool support data. |
|
RQ 3 |
Does our study have a future trend for research and does it have studied research limits? |
Enhancement of a new tool, Develop the approaches, and Establish a good technique. |
Table 3. PICO picks indicators and keywords
|
Keywords |
Limitation |
Indicators |
|
Population |
Which research category is the pick out for the study? |
Software measures, and product quality metrics. |
|
Intervention |
Which features of general research are used in research on interference in populations? |
Metric measurement tool. |
|
Comparator |
Is there any comparison to the intervention? |
Examining the software quality measures. |
|
Outcome |
Representing the outcome based on the intervention. |
Quality metrics for software applications and business systems. |
Table 4. Containment/exception indicators
|
Indicators Description |
Indicators |
Containment-Exception |
Search-Level |
|
Publishing and its languages |
English |
Containment |
Initial field: article's heading. Next field: abstract. Next field: overall manuscript. |
|
Publishing and its languages |
Other than English |
Exception |
Initial field: article's heading. Next field: abstract. Next field: overall manuscript. |
|
Publication kind |
The article, assay, and conference papers |
Containment |
Initial field: article's heading. |
|
Publication kind |
Books, privileged documents, basic letters, and educational papers |
Exception |
Initial field: article's heading. |
|
Related topics |
Yes-No assignment |
Containment- Exception |
Initial field: article's heading. Next field: abstract. |
|
Research related questions |
Yes-No assignment |
Containment- Exception |
Initial field: article's heading. Next field: abstract. |
|
Electronic accessibility |
Yes-No assignment |
Containment- Exception |
Initial field: article's heading. |
|
date of publication |
2009-2022 |
Containment- Exception |
Initial field: article's heading. Next field: abstract. |
|
The citation is attached to the publication |
through 2009 – 2022, if the count of citations is greater than zero, include. through 2009-2022, if the count of citations is equal to zero, exclude. |
Containment- Exception |
Initial field: article's heading. |
3.3 Software quality criteria
By using the keywords in the search and approving them by selecting the papers, and later choosing the appropriate quality metrics, these metrics are applied sequentially with each research paper. Tahir and MacDonell used a query methodology, where all accumulated questions about the study are queried and confirmed [39].
Q1. Is the study included in the paper within the scope and characterized by clarity?
Q2. Have all the questions raised in the paper been answered?
Q3. Does the paper contain data sources that can be described, and can appropriate future conclusions be obtained?
For the questions to be evaluated based on the quality criteria, each question will be answered with yes=1, 0.5 if it is Somewhat, and zero if it is not. This is according to the suggestions [40]. Each paper will be evaluated on quality question assessments using the CADIMA tool in this context. After that, the questions and the accompanying grades are collected, and the quality is calculated accordingly. When conflicting scores are obtained, a session involving peers and consultation is held to reach the degree of a joint decision.
3.4 Inducting search
The keywords in the paper by Rehman [38] are determined using population selection, intervention, comparison, and outcome (PICO) criteria. PICO gives several good methods that fall within the research fields. The main search words were generated using the PICO application, as shown in Table 3. In Table 4, the use of the application, the achievement of the Containment-exception indicators, and the Containment of research at the level of each indicator for the papers in the group are briefly illustrated. The CADIMA tool has good characteristics and criteria that allow the achievement of Containment-exception according to the classification of papers and the researchers' vote. Where numbers showing the voting scale are adopted to sort the indicator for Containment-exception, the numbers 0-3. Where the number 0 indicates the researcher’s opinion, the exception of the research or paper, articles, and conferences, and the number 3 indicates the Containment of the research paper and articles in a stronger opinion.
3.5 Data extraction
There are several prevailing methods through which data is extracted in both quantitative and qualitative forms in software engineering systems. Among these methods are qualitative comparison analysis, data case survey, document content analysis, narrative synthesis, and meta-analysis [39]. As we work on this article, statistical methods can be used to gather then study information. However, we faced difficulty using arithmetical methods, because the primary studies are diverse and heterogeneous. Statistical methods are not appropriate in heterogeneous primary research studies, because the statistical analysis is structured to follow a specific graphical distribution. On the other hand, our study indicates that there is heterogeneity in the data and that it is not defined by uniform standards, which makes it difficult to apply. Also, the study in this field does not contain independent and homogeneous data. When this data is not met, the results of statistical analysis may be misleading. Statistical methods have a specific ability to detect differences and correlations between heterogeneous data. After using and applying the methods available for this study, the synthesis method was adopted, as it is the most acceptable method for objective analysis.
The thematic examination method was adopting in this revision, for data gathering, as described in the literature review articles for thematic synthesis [40, 41].
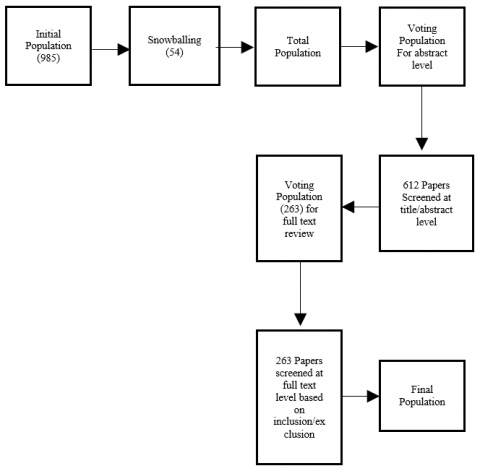
Figure 2 shows the comprehensive study to select papers relevant to this research area, supported in several phases. The first phase is to create a community of relevant research papers as well as databases that have been adopted for research and exploration. Table 5, demonstrations the whole number of revisions extracted.
After that, it was found that the total number of manuscripts and articles published in international scientific journals that fall under this study is 985, after using the forward snowball technique [42] to preserve relevant papers and ensure that they are not lost, as shown in the second stage of the figure. Another 54 papers were found, bringing our number to 1,039 papers and articles, the third stage of the figure. After voting on several papers and relying on their abstracts in the fourth stage of the figure, and after excluding a large number of papers for the following reasons: papers written in a language, not English and repeated, where 28 written research papers were monitored. In Korean, Chinese, and Spanish, some papers were written in English for the title and abstracts only, and some papers were excluded because their topic did not fit with the topic of our research area. There were 612 community articles in the fifth stage of the figure. These papers were studied and classified based on the PICO criteria mentioned in Table 3. PICO is a concept that is used in several steps. The first, population (P) determines the category on which the community is built. In the second intervention (I), When defining a community, the question is which aspect of the community is appropriate for study and analysis. The third step, Comparator (C), if there is any possibility of making a comparison between the components of the community. The last, outcome (O), What are the outputs and results of the intervention.
After analyzing and studying the papers based on the suitability of the research field in terms of title and abstracts, 263 papers remained in the sixth stage of the form, and after that, the documents were studied based on the suitability of the topic. Using the full- document method, adopting exception and Containment criteria, and after deleting papers from the population in the seventh stage, the final stage of the format, the final population became 70 papers.
3.6 Structure coupling and cohesion of the microservice metrics
In the context of studying metrics related to system quality, we must focus on modern applications that are relevant to this field of study, while the programming orientation is toward programs with microservices. Several metrics refer to measuring “coupling”, which means the degree of the inner connection between program components. While the “cohesion” measure expresses the degree of intra-connection of the sub-elements within a single component. Coupling and cohesion contribute greatly to determining the maintenance and reuse of programs. Structural coupling is a concept related to microservices, and it includes several metrics that give the degree of strength of interconnection between software functions within a single component. Evaluating the design and architecture of microservices is important. In this study, many articles and research papers were found, and within the textual content, researchers touched on the importance of low coupling and high cohesion in microservices. Using several metrics helps us detect low coupling, which helps developers reduce the interconnection between services, which makes the program more efficient and perform better. Other papers included metrics related to high cohesion, which refers to grouping-related functions, that help developers simplify thinking and limit the impact of changes.
Figure 2. Outline of the search results
Table 5. Library search results
|
# |
Search String |
Database Name |
Result |
|
1 |
“We take the full research paper title: Global Systems and Applications Metrics” OR “We take the full title of the manuscript: Full Text and Document metrics” And “We take the full title of the research paper: Writing Quality of Business Products” OR “We take the full title of the research paper: Tools Prepared for Research”. |
IEEE_Explore |
64 |
|
2 |
“We take the full research paper title: Global software and application grade” OR “Abstract: Global software and application grade” OR “Abstract: Global software and application” AND “Abstract: quality degree metric(s)” AND “Abstract: quality degree metric” AND “Abstract: Tools Prepared for Research”. |
IEEE_Explore |
224 |
|
3 |
“We take the full research paper title: Global Software and application” AND “We take the full research paper title: Quality degree metric(s)” AND “Abstract: Quality degree metric(s)” OR “Abstract: Tools Prepared for Research”. |
IEEE_Explore |
75 |
|
4 |
“We take the full research paper title: Global software and application” AND “Quality degree metric(s)” OR “We take the full research paper title: Global software and application” AND “Quality degree metric(s)” AND “We take the full research paper title (quality)” OR “Tools Prepared for Research” AND “Article type AND Publisher year > 2008”. |
Scopus and Springer, Google_ Scholar, Web_of Science |
90,104,12 |
|
5 |
“We take the full research paper title: Global software and application” AND “Quality degree metric(s)” OR “We take the full research paper title: Global software and application” AND measurement” AND “Global software and application AND quality AND product” AND “Quality degree metric(s)” OR “Global software and application AND quality degree metric” OR “Product and quality degree metric” AND publisher year > 2008. |
SCOPUS, Springer |
319 |
|
6 |
“+Global software and application + quality degree metric(s) + Global software and application + measure(ment)” AND Abstract: “Software product quality metric(s), quality degree metric(s), Tools Prepared for Research”. |
ACM |
57 |
|
7 |
“We take the full research paper title” + “Global software and application + quality degree metric(s) + Global software and application + measure(ment)” AND Abstract: “Quality degree metric(s), Global software and application product measure(ment)” We take the full research paper title AND Abstract: “+ Global software and application + quality degree metric(s) + metric(s) / measurement +Tools Prepared for Research”. |
OpenAIRE |
68 |
|
8 |
“We take the full research paper title” and “Global software and application or measurement” “We take the full research paper title” and “Tools Prepared for Research measure” We take the full research paper title and “Quality metrics or measureent Tools Prepared for Research”. |
EBSCOO |
16 |
The survey was completed, and the results were obtained and presented as follows:
RQ1: What are references and research publications?
RQ1.1 What are the most cited scientific research and manuscripts between 2009 and 2023?
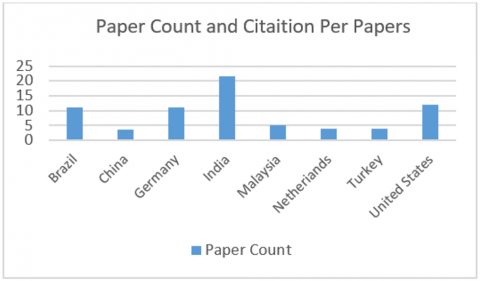
Research papers were taken from the Scopus database, and each paper's citations were calculated from 2009 until 2023. The citation percentage is calculated within the database, and it is the entire amount of papers indexed in the database. These documents cite another document or many documents within the repository or refer to researchers, and exclude the researchers’ self-citations.
The following law calculates the rate for normalized citation count (NCC), where 2.62 of the citations were normalized, leaving 12 papers within the average scale. For the remainder, we calculated the NCC for each archived search belonging to the country via the formulation:
for normalized citation count per paper =$\frac{sum\ of\ (N C C)\ for\ all \ papers\ per\ country }{ number\ of \ papers\ for\ country }$ (1)
These papers [1, 19, 43] received the most citations, The results obtained from the previous mathematical equation, when choosing 245 citations, the NCC = 30.63, when choosing 137 citations, the results were NCC = 17.13, and finally with choosing 106, the result becomes NCC = 13.25, we notice country India contributes the most contributes of the quantitative standards, meanwhile, the United States of America appears as a prominent country contributing to product quality standards as in Figure 3. Figure 3 clearly shows the comparison between countries. As for Brazil, Germany, and China, we find that Germany and Brazil have the largest number of research that is characterized by quantitative standards, and China has the quality aspect of the standard.
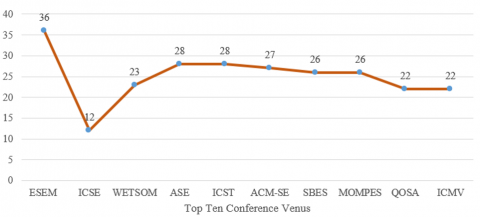
RQ 1.2 Which are the highest publishing sites?
The top ten papers were identified, by counting the total number of citations for the paper, besides the entire amount of documents, as shown in Figure 4.
in this study, it was found that there are no articles offered in EUROPI2, MetriKon, and MetriSecAnd, according to the indicators of Containment and exception that were adopted in a group of our papers. The papers published through the years 2009-2023 do not contain studies published in EUROSPI2. MetriKon, MetriSec, and SAM. Keyword test "measures the quality of the program product'' within the main title and abstract parts. However, with the availability of many software standards in these conference papers, Through the analysis of the previous data, it was found that there is no close relationship between these criteria on the one hand and the quality metrics of the systems on the other hand.
RQ2: Mind mapping questions related to technical trends.
RQ2.1 What type of technique and methods/criteria are used in the articles?
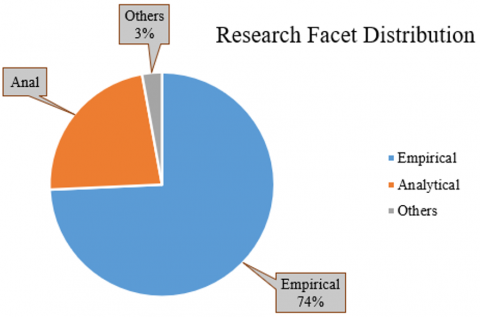
In 2011, utmost of the research documents in the field of computer science were published by empirical research. Also, in 2010, analytical methods were adopted to publish research papers within the same category, as shown in Figure 5. According to the study by Riccio et al. [43]. Research papers were selected and then classified built on the results of the study process according to the revision by Yan et al. [44]. The results of this mechanism show that 67% of the total 42 research papers used experimental research to develop and adopt them in our study.
Figure 3. Countries with cited scientific articles
Figure 4. List of top 10 conferences
Figure 5. Research facets distribution
RQ2.2 What are the methods observed and used in the research papers?
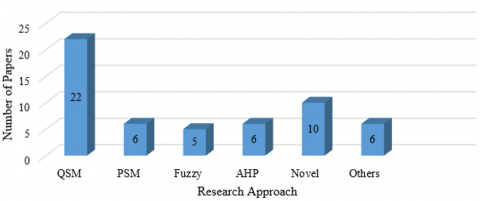
In this revision, we will employ the Goal Question Metric (GQM), the most popular method [45]. Thus, the classification of 19 papers was isolated because it does not contain detailed research methods, and this was done using (evaluation papers or surveys). Parts of these papers, 6 papers, were marked because they contain a hidden Markov model as a statistical model.
19 of these papers were marked N/A as in Figure 6 and according to the version of GQM. Developmental research methods have been used, which are AHP (Analytical Hierarchical Process), and it is considered a modern approach [46]; AHP was used with another obscure [47], GQM with PSM (Practical Software Measurement) [48]. Moreover, most papers consider GQM to be an inappropriate old method but in SQM, the common and dominant method expression.
Figure 6. The research method's classification of articles
RQ2.3 What type of SQM was presented in the papers?
First, SQM data is taken and analyzed in detail, and then these data are documented for each of the 70 research papers and articles and organized in measurement details.
RQ2.3.1 What are the common metrics used and levels generally presented in the papers?
The following are the most important fixed criteria for quality metrics:
$ Extendibility =0.5(abstraction - coupling + inheritance + polymorphism) $ (2)
$\begin{gathered}Effectiveness =0.2 \times(abstraction + encapsulation + composition + inheritance + polymorphism )\end{gathered}$ (3)
$Flexibility=0.25 (encapsulation - coupling + composition + polymorphism) $ (4)
$\begin{gathered} Understandability =0.33(- abstraction + encapsulation - coupling + cohesion - polymorphism- complexity - design )\end{gathered}$ (5)
$\begin{aligned} Functionality =(0.12 \times cohesion )+(polymorphism + messaging + design size + hierarchies )\end{aligned}$ (6)
One of the simplest measures is Easy Education rate period for education the custom of the component, Interface Density is a design level metric, Index for Interface Packet Usage Transformation (IIPUT), Error Message Clarity, Interface Packet Extension Index (IPEI), and another metric for Compatibility Count Interface benchmarks, Packet Change Effect Index (PCEI), Design Patterns for Four Aggregates, Interface Packet Usage Index (IPUI).
RQ2.3.2 In the field of systems application, what are the required metric levels that can be applied?
Seventy research papers were selected, and it was found that 10 of them are subject to the quality of an application using the web, and four types of research related to safety were extracted, which are among the necessary applications, and from the mobile applications are three applications, the embedded applications were extracted two papers, one paper is related with modernity and technology, where artistic tools are used. Among the metrics captured in our paper pool are the number of connections and comments in different domains of web applications within our database, Weighted Methods per Category (WMC), and LCOM [50].
In the applications scope of directory levels and classes, a number of the following measures have been applied:
Physical LOC measures directory-level systems, counts statements in the source code, and spaces in the code, which are blank lines, and counts comments in programs.
LCOM, RFC, and Coupling Between Objects (CBO) Metrics for class-level source code. Message Complexity (MC), DIT, Coupling Weight for a Class (CWC), Class Complexity (CLC), and Average Method Complexity for each Class (AMCC).
RQ2.4 Which statistical approach are adopted to validate or build new metrics?
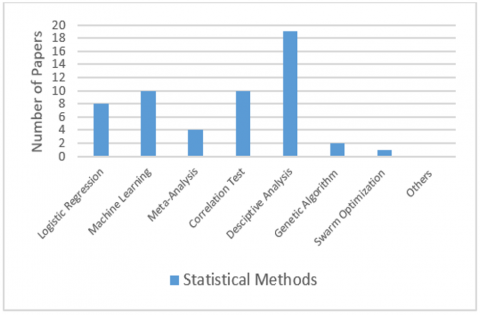
A genetic algorithm was used [12, 22] as shown in Figure 7. The swarm algorithm was used as a type of optimization [50]. One research paper relied on historical data and used statistical methods to predict future events [47], one of which is statistical extrapolation. One of the most important methods used in the field of statistics and the most common is descriptive analysis. When comparing statistical methods, it was found that machine learning methods give good predictions and better results when compared with other statistical methods.
Some authors suggested studying a new set of larger data than the previous one but using less exploratory learning methods, and that was in the years 2014 and 2015, where the genetic algorithm and another algorithm, the optimization colonies, were used to obtain more appropriate results [51]. When searching using keywords, it was found that no answer was found. This indicates that neither the genetic algorithm nor the swarm algorithm has been adopted for optimization and has not been mentioned in the past five years; however, to obtain papers that use statistical algorithms and the SQM type [52], by directly writing keywords that contain the name of the approach and specifying the direction used by the algorithm. It was necessary to find a statistical method or algorithm that is suitable for work and able to reach predictions of errors in the early stages of the project or system, as mentioned by Moser et al. [53], which matches with quality attributes.
Figure 7. Statistical methods and the number of papers affiliated with it
Table 6. Different domains of research references
|
Quality Features |
Implementation Environment |
|
Maintainability, Robust, Reliability. |
Embedded Application System. |
|
Freeing from trouble, Functional Suitableness, and Reusability. |
Web Application. |
|
Security, performance competence. |
Mobile System Application. |
|
Usability, Functional Convenience. |
Artificial Intelligence. |
Figure 8. Standards and distribution of relevant papers
Figure 9. Distribution of quality features for the SQM standard
Figure 10. Qualitative characteristics and their distribution within the QinU sample
Figure 11. Quality attributes and their distribution in DQ sample
RQ2.5 What are the patterns and metrics approved in articles that are used to measure the quality of systems?
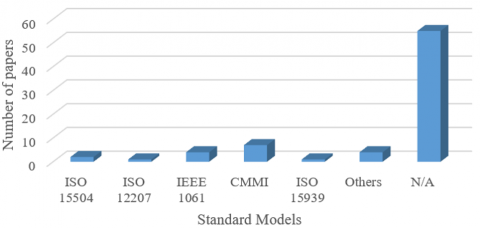
It was found that a large ratio of the papers does not refer to metrics, which is 74% of the papers, as well as models that do not contain measures of product quality. When looking at the papers, on the other hand, it was found that a more common model was used, which is CMMI. ITIL (Information Technique Infrastructure Library) is referenced in 4 papers as Figure 8, ISO/IEC 1458. By analyzing the feature requirements and integrating them with other traditional quality models, the study by Wahyuningrum and Mustofa [54] was established, which represents the Component Quality features (CQF) model. The resulting model contains six characteristics related to quality features and 23 sub-features related to quality as well, including reliability, maintainability, portability, functionality, and efficiency.
RQ2.6 Determine the software quality measure based on the quality metrics used in the papers.
ISO 9126 [48] is the most popular and used model, and in 2011 the ISO 25010 metrics were used, but the ISO 9126 model is the most present, the most quality, and the most widely used. Where two of the papers noted the use of the Mc Call and FURPS model. As for the others, the Design Quality Model (DQM) was used, and object-oriented programs also used the Quality Design Model (QMOOD).
The previously asked questions (RQ2.7-RQ2.9) aim to determine the quality attributes and their contribution to the quality models (SPQ, and QinU Quality Model).
RQ2.7 Can SPQ's quality metrics and attributes be used in ISO 25010?
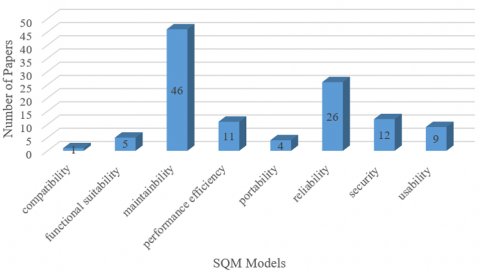
The SQM methodology has the characteristics of quality of maintenance and is associated with reliability, as in Figure 9. We also noticed when reviewing the features in the papers published in 2015 that the same features are used mostly, and this was shown when we compared the analysis of our time with the results of the article [17]. Search and inference can be made by searching for keywords and through the Internet repository according to each quality attribute [22].
RQ2.8 What are the QinU quality standards in the ISO 25010 standard quality models that are used in the majority of papers?
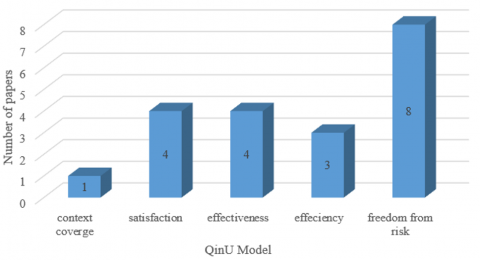
From Figure 10, it can be seen that the maximum number of research and metrics in QinU are risk safety and user satisfaction.
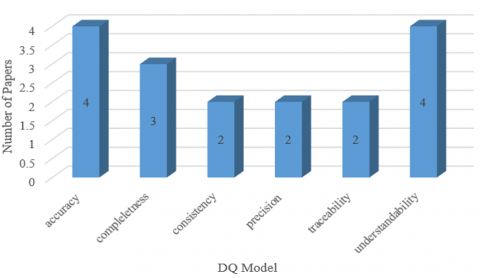
RQ2.9 How can the use of DQ quality attributes in ISO 25012 be consistent with the quality model applicable to most papers? The information mentioned in Figure 11 shows that it does not contain papers associated with the use of quality standards such as reliability, effectiveness, validity, accessibility, compliance, recovery, and portability. The most widely used metrics are understandability and accuracy, used to assess data quality. Several sub-features will be addressed and are considered among the promised quality metrics:
(1) Coherence and coupling are prominent measures of maintainability quality attributes, and mostly comprehensibility and reusability quality measures.
(2) The measure of inheritance is often used in terms of complexity and is adopted as a measure of the attributes of flexibility, reusability, understanding, and error tolerance.
(3) An innovative metric for predicting change during software implementation to reduce testing cost, Harrison et al. [37] offers WMC, LOC, and RFC metric combinations.
(4) A data-intensive software maintainability check metric provided by [50] shows a strong relationship between NODBC and CCR metrics.
(5) Some quality metrics are not suitable for measuring quality because the coupling factor is not suitable, and MOOD confirms this [55].
(6) In the study by Otero et al. [56], the measure of maintainability of programs and systems was used by focusing on varying weights for each attribute of quality in terms of the source code's ability to analyze, change, testability, and stability.
(7) In Figure 7, four new measurements were presented within the study for this paper.
RQ2.10 At what phase of the software life cycle (SDLC) is the majority of papers adopted?
In Figure 12, most of the models of SQM are shown. These models are built on several stages, including the code writing stage, the system design stage, and then the model building stage, the ability to predict errors and process these errors. Processing is done proactively, not retroactively.
In Chart 12, more of the SQM models concentrate on the code and design phase of the program life cycle that adopts errors and tries to overcome them proactively.
RQ2.11 Has SQM been subject to any type of program, and what are the most important types of programming adopted by the articles?
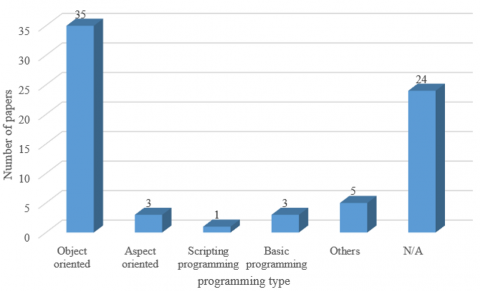
One of the stages of SDLC is the code, and 43 of the 70 research papers analyzed were identified at the code level. In object-oriented programming, 35 papers were revealed out of 43 research papers that were used to increase the class of object-oriented programming (OOP) metrics, as shown in Figure 13. Another type of object-oriented programming (OOP) is aspect-oriented programming (AOO). Three articles related to aspect-oriented programming metrics were discovered, as well as three related research papers on basic programming and one article on code-phase scripting. And the rest of the research papers, five of the articles were distinguished as related to other programs that depend in their work on Compound-Based Programming or independent programs.
RQ2.12 Can SQMs be used with SDLC models?
Only two articles mentioned the correlation between metrics and the Agile sample [8, 55]. In the SDLC stage, the measurement was not used as a basic parameter and within steps in the majority of papers. Other articles used advanced measures instead of the previous ones, and they were re-analyzed and evaluated relative to the activities of the agile methods. Moreover, in agile methods, some studies consider dealing with quality. When we use the development measures in [8, 43], they must be evaluated for validation and re-estimated using the 3C model (continued integration, continued measurement, and continued improvement) of the actions of the agile prototypical.
RQ 2.13 Is it possible to specify a metric threshold limit in the paper warehouse or not?
As it is known, the deviation of the values from the purpose of product quality is of great importance in adapting the threshold in the metrics data. Therefore, the minimum amount of metric data must be specified for consideration. If the system has exceeded the metrics data, the application will respond by sending a caution to execute an emergency plan. In this study, the focus was on researching data related to the threshold value of the data.
The study confirms that 22 articles from 70 research papers evaluated the threshold within their studies. Threshold values are mostly suggested values based on experience and other criteria [57]. For the threshold values to be chosen, they should be more down or more heightened values relative to the design of the source code. To define general thresholds that can be used for various types of measurements, the RTT tool (Relative Threshold Tool) [55] was executed. The Qualities Corpus data set was used to validate the tool, which is an open-source systems tool, and for practical studies [58]. The RT tool [8] calculation method is used to define the relative threshold weight for the programs used according to the code structure. When the penalty rate exceeds the given rate, the system proposes a starting point for a new threshold value that contributes to improving the design.
Figure 12. Distribution of SDLC stages in articles
Figure 13. Number of articles for programming kind
Figure 14. Plans offered by the papers
RQ2.14 What information is available about product quality measures, what are the measurement management tools, and are there any details regarding product quality measures for programs?
Despite the availability of abundant measurement tools, there is a lack of metrics management tools, as well as a loss of integrated quality metrics. Most articles gather and analyze data to estimate different quality features, and the analysis is carried out on several available scales of various kinds, as listed [58, 59].
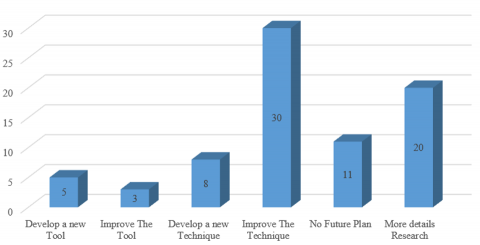
RQ3: What are the future opinions and current trends of the current articles?
Our current study is employed for the next step and provides a proposal for improving the technique (39%), and we seek to increase the detailed scientific research (26%) by increasing the study of new existing articles in Scheme 14 as shown in Figure 14. In this regard, about 39% of the articles and research can improve standards and techniques through the application of systems, and Prefigure No. 1 lists the search engines that include the databases, and thus the levels, trends, and constraints are classified into three groups.
4.1 Measurement/Models
Most of the research papers studied refer to low values as well as models with low levels, such as ISO 2010 and ISO 916. To raise the quality measures and enhance the usability of each product quality measures through the preparation of additional research articles to address the low values of the measures in the different fields of research. From a practical point of view, the new researchers should work on implementing the quality features by integrating several aspects of the quality models [60].
It can also be noted that there is an essential contrast between metric and value prototype criteria. This opposes the use of familiar criteria in research papers and articles. We have seen the variance in prototypes as one of the significant obstacles to the continued advancement of the standards. Despite this, the abundance of papers and articles presented in conferences and workshops for discussion may be good for noting the contradiction between standards on the one hand and academic articles on the other hand.
Wahyuningrum and Mustofa [54] proposes new quality measures with marketing characteristics as well as sub-characteristics, which are related to cost, time to market, development time, target users, and target affordability. In the article [61], the authors proposed new criteria for quality attributes with a developmental feature depending on the parameters of consumer culture, user perspective, and behavior. After all that has been found, the new quality attributes and characteristics can be approved and included in ISO 25010.
Machine learning has a history in this field, and artificial intelligence can be used through designing programs and subsequent development processes and by using quality models for programmers and developers. After including the modern features resulting from the use of the smart model and related to quality, it will be formed in the scheme automatically. Researchers and developers can be guided by the new model and help them with the activities, and by using the resulting model, we have reduced the error rate for the testers [59].
4.2 Metrics/Techniques
There is a pure application for each field of research that has a specific application context, and therefore there is a need to choose the best set of criteria and standards. Accordingly, different techniques combine instrument-based metrics and predictive functions [62].
By looking at COSMIC (Common Software Measurement International Consortium), more research has been highlighted to identify the drawbacks of size metrics used within different software application domains and by applying other, more quality metrics that belong to more evolutionary applications.
Where more diverse and complex measures have been adopted and depend on solid information such as dependence on program cost, time consumption, effort, and data diversity.
With the existence of new technologies and applications of new technology trends such as artificial intelligence, therefore, we need new product quality measures that as the Internet of Things (IoT), machine learning, artificial intelligence (AI), and Robert [58].
Security measure has much literature, and we can say that the application or system must be fully secured by analyzing the criteria and standards for any type of security attack for one or more. Accordingly, it is necessary to build more quality and reliable security measures to enable us to identify several aspects of different security and to enable us to monitor unintended threats [63]. There is a technology that contains security weaknesses, so it is necessary to provide a product quality assurance measure that increases safety as much as it relates [10].
In the papers, CMM v3.0 [4] and PMBK [64] emphasize the use of agile metrics and processes. These two papers only track metrics connected to Agile. Our study confirms the adoption of developmental processes with the contribution of DevOps with measures that contribute to increasing the speed of development and launching the product to customers. It is necessary to increase the quality of measures for agile projects. Here is what is related to metric thresholds, and because of a lack of relative knowledge about them, the program becomes negatively affected by the performance of measurements [60]. It was necessary to produce new metric threshold values, and unfortunately, our paper repository has little about metric thresholds, new metric thresholds have to fit modern application domains with different programming languages and varying project sizes and SDLC methods.
The paper [27] used standards and measures that help organizations calculate performance and presented EFQM standards, which often systematically compare curricula with other relevant organizations. In the same context, operating software companies should encourage their customers to use standards that agree with similar companies, thus enabling us to improve their operations.
4.3 Tools
One of the very difficult things is calculating measures that have been collected to calculate another measure, and at the same time, it takes a long time. There are several types of measuring metrics to evaluate the metrics for measuring product quality. The question here is whether it is possible to use one general tool to evaluate metrics and be multi-use for various applications instead of using many and multiple tools, and that would add credibility and reliability to the metric data and increase the possibility of its analysis and completeness. The answer is that there is a possibility of integrated general measures that calculate automatically and at different levels and within relative metric thresholds that support machine and statistical learning [64]. In this context, the metric thresholds need time to calculate, as the time can be reduced more effectively by analyzing and identifying the root cause and giving appropriate solutions to values that exceed the metric threshold values. Researchers and laboratory workers can access the scales to calibrate the systems at any time [65].
4.4 Discussion
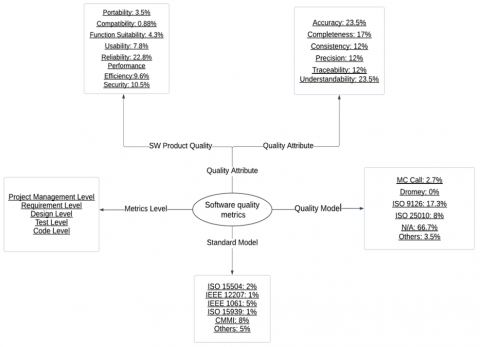
After studying the papers and articles related to SQM, the results are presented for the period from 2009 to 2023, and the results are represented in the form of detailed maps. A large picture was formed, which allows us to quickly understand the process of diagnosing gaps. Using this technique, greatly helped us in the analysis of the current study and allowed us to improve the issues associated with SQM. The graphical structure is drawn in Figure 15, and looking at this figure will give researchers an idea of the information they can benefit from about TQM trends in the literature. The standards and trends for each section are represented by a percentage. The percentage output was computed with the subsequent equation:
$\begin{aligned}
&\text { Dispersal of courses per RQs (x\%) = }\left(\frac{ sum\ of\ category\ (x)}{sum\ of\ category\ (x, y, z)}\right) \times 100
\end{aligned}$ (7)
Taking maintainability characteristics as an example.
RQ 2.7= [Quantity of maintainability metrics associated to manuscript (46)]/[Calculation of other groups (1+4+26+5+12+9+46+11+)] $\times$ 100,(46 / 114) $\times $100= 41.45%.
Questions, considerations, and issues related to SQM trends over the past ten years are examined and shown in Figure 15.
When we match the outcomes of our study with the results presented by Wahyuningrum and Mustofa [54], we notice that the results match the quality models. The ISO 9126 standard is still general compared to the ISO 25010 standard, among 2006 and 2019. From this, it is clear that published papers and articles did not shed light on the use of the new standard during this period, as shown in Figure 15. It is also obvious, that the ISO 25010 value module issued in 2011 is static in use, while ISO 9126 is still more common. For the novel description of the feature module to be used increasingly, the guidelines can be adjusted to be very clear and easy to diagnose some problems.
It has been shown that the most commonly used quality standards are reliability, safety, and reusability of the system. The most common criteria for measuring QinU are effective system performance, customer satisfaction, and freedom from risk. The last standard is DQ. The most common quality standards are accuracy, ease of understanding, and continuous integration. It was also noted that compatibility, reliability, and robustness were the most frequently used in studies after examining articles in 2007 and 2014. The reliability standard is still a very important factor for measuring product quality to meet customer satisfaction. There remain criteria that are necessary to measure the data quality of systems, which are: accessibility, efficiency, portability, availability, and confidentiality of compliance. Through our study, we noticed that there are no attributes within the standards related to quality models to measure the culture, attributes, attitudes, and points of view of developers, managers, and process models.
In our study, while analyzing quality standards, it was found that the maximum popular ordinary is IEEE 1061:1998, and the module adopted is CMMI. A large number of countries have received certificates from CMMI, and our study has made a significant contribution to SQM. The effective contribution to the use of these metrics, standards, and modules will encourage researchers to pay to the literature related to comprehensive quality product management. The textbook proposed a set of metrics: “Software Engineering, Modern Curriculum” [3] and CMMI [4], and these metrics: Mass metrics to measure the mass of the software code, effort, production cost, variation between software producers, the number of defects according to their harshness, extracting defects and calculating The percentage of defects per hour during program execution, the reuse rate of the application, customer and developer satisfaction requirements, average failure time, maintainability, and testing rate.
Figure 15. Metrics chart of software quality
Although the software industry was popular in the 1990s, quality management remained a major contributor to the software field, and despite all that, the shift to new methods remained relatively small.
As we can see in Figure 15, there are a small number of non-functional requirements, and the standards associated with them to measure the quality of the systems are inefficient and could negatively affect the efficiency of the product. For example, safety metrics that measure non-functional requirements have a very important impact on the medical field. Therefore, it is very necessary to build quality metrics that predict errors during the program's run and be able to eliminate them through a proactive process. Cohesion and coupling, are metrics used to predict errors in the early software design stages. The prevalence metrics relevant to software quality are related to object-oriented programs and medium-sized systems. As for large systems and small-sized applications, we need new metrics, and other metrics for different types of programming languages. Oriented software is moving towards continuous development, so it is necessary to conduct research that provides metrics that are compatible with the architecture, development, and quality of the systems.
Most research has proposed metrics used for medium and large data. To do this, we need a lot of software data across open source sites, and for diversity in data and programs. NASA MDP data has been processed, applied in many diverse projects, and developed by researchers. However, we do not have information indicating the number of researchers and developers, so the defects in the data cannot be predicted based on the developers’ data. Therefore, there is a need to create data from open-source databases, which can be accessed freely, to test the validity of the new metrics. Accordingly, there is also a need for data related to the developer and the laboratories, aiming to quantity their usefulness, based on the amount of designers, measuring culture, viewpoints, and standards. Several departments can be linked together to enhance research, namely the Mathematics, Statistics, and Statistical Methods departments to enhance models. These models are used to produce new metrics and metrics that can predict errors from one stage of the system.
Validity in the threat. The assessment of value criteria is investigated through a comprehensive study that examines paper titles, keywords, abstracts, full-text articles, and conference papers, and analyzes them to identify suitable papers with SQM. If we did not find a sufficient and useful amount of information, parts of the papers containing valuable information and tables of contents were found.
5.1 Internal validity
To preserve the SQM data, and prevent it from being lost, alternatives were used, keyword searching for alternatives, and a group of the most useful search engines. Containment and exception methods were used in the repository of papers. To eliminate the subjectivity of selecting articles, the authors emphasized organizing the articles and comparing the outcomes. If writers use varying nicks, then the authors meet and make an agreement decision. The authors agreed on a voting scale for the subject Containment/exception technique, with numbers ranging from 0-3. The number 0 indicates that articles and papers with high opinions were removed, and the number 3 indicates that articles and conference papers with high opinions were included.
5.2 Construct validity
After collecting the papers, the facts were methodically organized subject to the GQM study questions. The method taken in formulating the GQM helps us to reduce risks and adopt reliable validity through the tracking methodology between the objective and the questions. Each search request is classified based on a study of the literature related to quality management, and by mapping several iterative improvement processes. In addition, we took the help of peers in terms of cross-checking with them, holding meetings, and exporting evidence-based results, which greatly helped the reliability and validity of this study.
5.3 Conclusion validity
Structural charts, graphs, and analyses were created directly from the raw data, and the integrity and validity of the results were ensured. The study can be prepared in different ways. As mentioned previously, the selected papers may have skewed their results by small values, while the authors consider the results in their final form without significantly changing.
This research will hopefully task and serve as a starting stage for several studies related to SQM. In addition, by discussing the results of the research, the results of the survey can be used in manufacturing for many applications, and the metrics of measurement quality and identifying the most quality metrics, as well as threshold values, can be used to analyze and compare the results. With the use of the threshold, could apply the comparison with the results, and will gain the corrections that had been taken to reduce the threats to which projects are exposed. The topics of SaaS and QoS have not been covered in this article. future studies could highlight these topics to assess the performance network. Moreover, future work can identify and quantify the gaps by monitoring the trends from modern SQM. Moreover, several measures are related to safety, and it cannot be said that any project will be safe through studying and analyzing one type of security. Therefore, future work can be highlighted on more robust and reliable safety measures against several different aspects, including unintended threats, and it can be said which the want for safety superiority measures may growth in the coming and pay the way for new revisions.
[1] Schneidewind, N.F. (2002). Body of knowledge for software quality measurement. Computer, 35(2): 77-83. https://doi.org/10.1109/2.982919
[2] Ebert, C. (1999). Technical controlling in software development. International Journal of Project Management, 17(1): 17-28. https://doi.org/10.1016/S0263-7863(97)00065-3
[3] Kumar, G., Bhatia, P.K. (2014). Comparative analysis of software engineering models from traditional to modern methodologies. International Conference on Advanced Computing and Communication Technologies, ACCT, pp.189-196. https://doi.org/10.1109/ACCT.2014.73
[4] Alfaro, F., Silva, C., Dávila, A. (2022). CMMI adoption and retention factors: A systematic literature review. In New Perspectives in Software Engineering: Proceedings of the 10th International Conference on Software Process Improvement (CIMPS 2021), pp. 15-28. https://doi.org/10.1007/978-3-030-89909-7_2
[5] Johnson, K., Kulpa, M. (2008). Measurement within the cmmi. Interpreting the CMMI (R), pp. 209-214 https://doi.org/10.1201/9781420060539.ch16
[6] Focacci, L., Mockler, R.J., Gartenfeld, M.E., Dologite, D.G. (2005). Best practices guidelines for successfully managing application service providers (ASPs). Global Business Review, 6(2): 169-188. https://doi.org/10.1177/097215090500600201
[7] Takagi, N., Varajão, J. (2020). Success management and the project management body of knowledge (PMBOK): An integrated perspective. International Research Workshop on IT Project Management, 6. https://aisel.aisnet.org/irwitpm2020/6.
[8] Casale, G., Chesta, C., Deussen, P., Di Nitto, E., Gouvas, P., Koussouris, S., Stankovski, V., Symeonidis, A., Vlassiou, V., Zafeiropoulos, A., Zhao, Z. (2016). Current and future challenges of software engineering for services and applications. Procedia Computer Science, 97: 34-42. https://doi.org/10.1016/j.procs.2016.08.278
[9] Hall, T., Beecham, S., Bowes, D., Gray, D., Counsell, S. (2012). A systematic literature review on fault prediction performance in software engineering. IEEE Transactions on Software Engineering, 38(6): 1276-1304. https://doi.org/10.1109/TSE.2011.103
[10] Garousi, V., Rainer, A., Lauvås, P., Arcuri, A. (2020). Software-testing education: A systematic literature mapping. Journal of Systems and Software, 165: 110570. https://doi.org/10.1016/j.jss.2020.110570
[11] Kitchenham, B., Brereton, P. (2013). A systematic review of systematic review process research in software engineering. Information and Software Technology, 55(12): 2049-2075. https://doi.org/10.1016/j.infsof.2013.07.010
[12] Elgrably, I.S., Oliveira, S.R.B. (2022). A quasi-experimental evaluation of teaching software testing in software quality assurance subject during a post-graduate computer science course. International Journal of Emerging Technologies in Learning, 17(5): 57-86. https://doi.org/10.3991/ijet.v17i05.25673
[13] Ali, M.A., Yap, N.K., Ghani, A.A.A., Zulzalil, H., Admodisastro, N.I., Najafabadi, A.A. (2022). A systematic mapping of quality models for AI systems, software and components. Applied Sciences, 12(17): 8700. https://doi.org/10.3390/app12178700
[14] Al-Kilidar, H., Cox, K., Kitchenham, B. (2005). The use and usefulness of the ISO/IEC 9126 quality standard. 2005 International Symposium on Empirical Software Engineering, ISESE 2005, pp. 126-132. https://doi.org/10.1109/ISESE.2005.1541821
[15] Briand, L.C., Wüst, J., Daly, J.W., Victor Porter, D. (2000). Exploring the relationships between design measures and software quality in object-oriented systems. Journal of Systems and Software, 51(3): 245-273. https://doi.org/10.1016/S0164-1212(99)00102-8
[16] Gong, J., Lu, J., Cai, L. (2016). An induction to the development of software quality model standards. In 2016 3rd International Conference on Trustworthy Systems and Their Applications, TSA 2016, 9126: 117-122. https://doi.org/10.1109/TSA.2016.28
[17] Fenton, N., Bieman, J. (2014). Software metrics: a rigorous and practical approach. CRC Press. https://doi.org/10.1201/b17461
[18] Santos, M., Afonso, P., Bermejo, P.H., Costa, H. (2016). Metrics and statistical techniques used to evaluate internal quality of object-oriented software: A systematic mapping. In International Conference of the Chilean Computer Science Society, Valparaiso, Chile, pp. 1-11. https://doi.org/10.1109/SCCC.2016.7836021
[19] Erdem, S., Demirörs, O., Rabhi, F. (2018). Systematic mapping study on process mining in agile software development. Communications in Computer and Information Science, 918: 289-299. https://doi.org/10.1007/978-3-030-00623-5_20
[20] Olorunshola, O.E., Irhebhude, M.E., Evwiekpaefe, A.E., Ogwueleka, F.N. (2020). Evaluation of machine learning classification techniques in predicting software defects. Transactions on Machine Learning and Artificial Intelligence, 8(5): 1-15. https://doi.org/10.14738/ tmlai.85.8733
[21] Aguileta, A.A., Gómez, O.S. (2016). Software engineering research in Mexico: A systematic mapping study. International Journal of Software Engineering and its Applications, 10(12): 75-92. https://doi.org/10.14257/ijseia.2016.10.12.07
[22] Keele, S. (2007). Guidelines for performing systematic literature reviews in software engineering. Technical Report. https://www.researchgate.net/profile/Barbara-Kitchenham/publication/302924724_Guidelines_for_performing_Systematic_Literature_Reviews_in_Software_Engineering/links/61712932766c4a211c03a6f7/Guidelines-for-performing-Systematic-Literature-Reviews-in-Software-Engineering.pdf.
[23] Kude, T., Foerderer, J., Mithas, S., Heinzl, A. (2023). How deadline orientation and architectural modularity influence software quality and job satisfaction. Journal of Operations Management, 69(6): 941-964. https://doi.org/10.1002/joom.1230
[24] Al-Sarayreh, K.T., Alenezi, M., Zarour, M., Meridji, K. (2021). A reference measurement framework of software security product quality (SPQnfsr). IET Information Security, 15(1): 23-37. https://doi.org/10.1049/ise2.12002
[25] Akimova, E.N., Bersenev, A.Y., Deikov, A.A., Kobylkin, K.S., Konygin, A.V., Mezentsev, I.P., Misilov, V.E. (2021). A survey on software defect prediction using deep learning. Mathematics, 9(11): 1180. https://doi.org/10.3390/math9111180
[26] Cardoso, B., Figueiredo, E. (2015). Co-occurrence of design patterns and bad smells in software systems: An exploratory study. In SBSI 2015 - Proceedings of the Annual Conference on Brazilian Symposium on Information Systems, Information Systems: A Computer Socio-Technical Perspective, 49(7): 347-354. https://doi.org/10.5753/sbsi.2015.5836
[27] Molnar, A.J., Neamţu, A., Motogna, S. (2019). Longitudinal evaluation of software quality metrics in open-source applications. In ENASE 2019 - Proceedings of the 14th International Conference on Evaluation of Novel Approaches to Software Engineering, pp. 80-91. https://doi.org/10.5220/0007725600800091
[28] Misra, S., Adewumi, A., Fernandez-Sanz, L., Damasevicius, R. (2018). A suite of object oriented cognitive complexity metrics. IEEE Access, 6: 8782-8796. https://doi.org/10.1109/ACCESS.2018.2791344
[29] Pooja, U., Nizar Banu, P.K. (2018). Prediction of software defects using object-oriented metrics. International Journal of Civil Engineering and Technology, 9(1): 889-899.
[30] Shi, Y., Li, M., Arndt, S., Smidts, C. (2017). Metric-based software reliability prediction approach and its application. Empirical Software Engineering, 22(4): 1579-1633. https://doi.org/10.1007/s10664-016-9425-9
[31] Arar, Ö.F., Ayan, K. (2016). Deriving thresholds of software metrics to predict faults on open source software: Replicated case studies. Expert Systems with Applications, 61: 106-121. https://doi.org/10.1016/j.eswa.2016.05.018
[32] Tripathi, A., Sharma, K. (2015). Improving software quality based on relationship among the change proneness and object oriented metrics. 2015 International Conference on Computing for Sustainable Global Development, INDIACom 2015, pp. 1633-1636
[33] Malhotra, R., Khanna, M. (2014). A new metric for predicting software change using gene expression programming. In 5th International Workshop on Emerging Trends in Software Metrics, WETSoM 2014 - Proceedings, pp. 8-14. https://doi.org/10.1145/2593868.2593870
[34] Abdellatief, M., Sultan, A.B.M., Ghani, A.A.A., Jabar, M.A. (2013). A mapping study to investigate component-based software system metrics. Journal of Systems and Software, 86(3): 587-603. https://doi.org/10.1016/j.jss.2012.10.001
[35] Rudolph, M., Schwarz, R. (2012). A critical survey of security indicator approaches. In 2012 7th International Conference on Availability, Reliability and Security, ARES 2012, pp. 291-300. https://doi.org/10.1109/ARES.2012.10
[36] Kohl, C., McIntosh, E.J., Unger, S., Haddaway, N.R., Kecke, S., Schiemann, J., Wilhelm, R. (2018). Online tools supporting the conduct and reporting of systematic reviews and systematic maps: A case study on cadima and review of existing tools. Environmental Evidence, 7(1): 1-17. https://doi.org/10.1186/s13750-018-0115-5
[37] Harrison, H., Griffin, S.J., Kuhn, I., Usher-Smith, J.A. (2020). Software tools to support title and abstract screening for systematic reviews in healthcare: An evaluation. BMC Medical Research Methodology, 20(1): 1-12. https://doi.org/10.1186/s12874-020-0897-3
[38] Rehman, S. (2012). Swot analysis of software quality metrics for global software development: A systematic literature review protocol. IOSR Journal of Computer Engineering, 2(1): 1-7. https://doi.org/10.9790/0661-0210107
[39] Tahir, A., MacDonell, S.G. (2012). A systematic mapping study on dynamic metrics and software quality. IEEE International Conference on Software Maintenance, ICSM, Trento, Italy, pp. 326-335 https://doi.org/10.1109/ICSM.2012.6405289
[40] Nwandu, I.C., Odii, J.N., Nwokorie, E.C., Okolie, S.A. (2022). Choice of metrics in achieving software quality assurance. Researchgate Net, 7(2).
[41] Titang, S., Dur, A. (2015). The visualization of software quality metrics bachelor of science thesis in software engineering and management dur abuzaid.
[42] Kitchenham, B. (2010). What’s up with software metrics? - A preliminary mapping study. Journal of Systems and Software, 83(1): 37-51. https://doi.org/10.1016/j.jss.2009.06.041
[43] Riccio, V., Jahangirova, G., Stocco, A., Humbatova, N., Weiss, M., Tonella, P. (2020). Testing machine learning based systems: A systematic mapping. Empirical Software Engineering, 25(6): 5193-5254. https://doi.org/10.1007/s10664-020-09881-0
[44] Yan, M., Xia, X., Shihab, E., Lo, D., Yin, J., Yang, X. (2019). Automating change-level self-admitted technical debt determination. IEEE Transactions on Software Engineering, 45(12): 1211-1229. https://doi.org/10.1109/TSE.2018.2831232
[45] Tiwari, S., Rathore, S.S. (2018). Coupling and cohesion metrics for object-oriented software: A systematic mapping study. ACM International Conference Proceeding Series, pp. 1-11 https://doi.org/10.1145/3172871.3172878
[46] Suali, A.J., Fauzi, S.S.M., Nasir, M.H.N.M., Sobri, W.A.W.M., Raharjana, I.K. (2019). Software quality measurement in software engineering project: A systematic literature review. Journal of Theoretical and Applied Information Technology, 97(3): 918-929.
[47] Kitchenham, B., Pretorius, R., Budgen, D., Brereton, O.P., Turner, M., Niazi, M., Linkman, S. (2010). Systematic literature reviews in software engineering-A tertiary study. Information and Software Technology, 52(8): 792-805. https://doi.org/10.1016/j.infsof.2010.03.006
[48] Castro, V. de S., Oliveira, S.R.B. (2023). Diversity in software design and construction teaching: A systematic literature review. Education Sciences, 13(3): 303. https://doi.org/10.3390/educsci13030303
[49] Kitchenham, B.A., Budgen, D., Brereton, O.P. (2011). Using mapping studies as the basis for further research - A participant-observer case study. Information and Software Technology, 53(6): 638-651. https://doi.org/10.1016/j.infsof.2010.12.011
[50] Cruzes, D.S., Dybå, T. (2011). Recommended steps for thematic synthesis in software engineering. International Symposium on Empirical Software Engineering and Measurement, pp. 275-284 https://doi.org/10.1109/esem.2011.36
[51] Braun, V., Clarke, V. (2006). Using thematic analysis in psychology. Qualitative Research in Psychology, 3(2): 77-101. https://doi.org/10.1191/1478088706qp063oa
[52] Wohlin, C. (2014). Guidelines for snowballing in systematic literature studies and a replication in software engineering. ACM International Conference Proceeding Series, pp. 1-10. https://doi.org/10.1145/2601248.2601268
[53] Moser, R., Pedrycz, W., Succi, G. (2008). A comparative analysis of the efficiency of change metrics and static code attributes for defect prediction. In International Conference on Software Engineering, pp. 181-190. https://doi.org/10.1145/1368088.1368114
[54] Wahyuningrum, T., Mustofa, K. (2017). A systematic mapping review of software quality measurement: Research trends, model, and method. International Journal of Electrical and Computer Engineering, 7(5): 2847-2854. https://doi.org/10.11591/ijece.v7i5.pp2847-2854
[55] Palij, M. (2014). Numbers, words, and things: Reviewing a statistics and methods dictionary. PsycCRITIQUES, 59(25). https://doi.org/10.1037/a0036614
[56] Otero, C.E., Dell, E., Qureshi, A., Otero, L.D. (2010). A quality-based requirement prioritization framework using binary inputs. In AMS2010: Asia Modelling Symposium 2010 - 4th International Conference on Mathematical Modelling and Computer Simulation, pp. 187-192. https://doi.org/10.1109/AMS.2010.48
[57] Chen, J., Liu, X. (2009). Software maintainability metrics based on the index system and fuzzy method. In 2009 1st International Conference on Information Science and Engineering, ICISE 2009, pp. 5117-5120. https://doi.org/10.1109/ICISE.2009.1073
[58] Pereira Moreira, G.D.S., Mellado, R.P., Montini, D.Á., Dias, L.A.V., Da Cunha, A.M. (2010). Software product measurement and analysis in a continuous integration environment. ITNG2010 - 7th International Conference on Information Technology: New Generations, pp. 1177-1182. https://doi.org/10.1109/ITNG.2010.85
[59] Keser, B., Iyidogan, T., Ozkan, B. (2013). ASSIST: An integrated measurement tool. In Joint Conference of the 23rd International Workshop on Software Measurement and the 8th International Conference on Software Process and Product Measurement, IWSM-MENSURA 2013, pp. 237-242. https://doi.org/10.1109/IWSM-Mensura.2013.41
[60] Meirelles, P., Santos, C., Miranda, J., Kon, F., Terceiro, A., Chavez, C. (2010). A study of the relationships between source code metrics and attractiveness in free software projects. In 24th Brazilian Symposium on Software Engineering, SBES 2010, pp. 11-20. https://doi.org/10.1109/SBES.2010.27
[61] Cardoso, B., Figueiredo, E. (2015). Co-occurrence of design patterns and bad smells in software systems: an exploratory study. In SBSI 2015-Proceedings of the Annual Conference on Brazilian Symposium on Information Systems, Information Systems: A Computer Socio-Technical Perspective, 49(7): 347-354. https://doi.org/10.5753/sbsi.2015.5836
[62] De Souza, L.B.L., De Almeida Maia, M. (2013). Do software categories impact coupling metrics? In 2013 10th Working Conference on Mining Software Repositories (MSR), San Francisco, CA, USA, pp. 217-220. https://doi.org/10.1109/MSR.2013.6624030
[63] Plösch, R., Bräuer, J., Körner, C., Saft, M. (2016). MUSE: A framework for measuring object-oriented design quality. Journal of Object Technology, 15(4): 1-2. https://doi.org/10.5381/jot.2016.15.4.a2
[64] Oliveira, P., Lima, F.P., Valente, M.T., Serebrenik, A. (2014). RTTool: A tool for extracting relative thresholds for source code metrics. In 30th International Conference on Software Maintenance and Evolution, ICSME 2014, pp. 629-632. https://doi.org/10.1109/ICSME.2014.112
[65] Gao, K., Khoshgoftaar, T.M., Wang, H., Seliya, N. (2011). Choosing software metrics for defect prediction: An investigation on feature selection techniques. Software - Practice and Experience, 41(5): 579-606. https://doi.org/10.1002/spe.1043