Amrendra Tripathi*![]() | Tanupriya Choudhury
| Tanupriya Choudhury![]() | Hitesh Kumar Sharma
| Hitesh Kumar Sharma![]()
© 2024 The authors. This article is published by IIETA and is licensed under the CC BY 4.0 license (http://creativecommons.org/licenses/by/4.0/).
OPEN ACCESS
In recent years, the rapid development of computer applications for automatic classification of human emotions-based Electroencephalography (EEG) has significant attention from researchers. However, existing techniques have not adequately addressed the context-information inherent in EEG signals. To address the issue, this research utilized an automated model for enhancing EEG-based emotion recognition. The Modified Tunicate Swarm Optimization Algorithm (MTSOA) improves EEG-based emotion recognition by enhancing context information management. It improves signal processing, resulting in more accurate emotional state detection. This overcomes fundamental difficulties and improves the algorithm efficacy in extracting relevant emotional data from EEG signals for more robust emotion detection systems. MTSOA is used for feature selection in emotion detection because of its capacity to navigate complex search spaces effectively. Because of its capacity to effectively explore parameter spaces, the Rat Swarm Optimization Algorithm (RSOA) is used in emotion recognition to choose hyperparameters. According to the results the suggested method better outcomes for arousal of 89.58%, and valence of 92.29% which was significantly higher than the ensemble median empirical mode decomposition (MEEMD), CNN with SVM, and Kernel matrix+DNN methods.
emotion recognition, empirical mode decomposition, long short-term memory network, rat swarm optimization algorithm, variational mode decomposition
Emotions play a crucial role in human life, impacting cognitive function, mental well-being, and decision-making [1]. They are deeply personal and influenced by numerous factors, including external stimuli, memories, experiences, personality, and mood [2]. Positive emotions can improve human behaviour, while negative emotions can undermine and diminish it. Particularly, intense negative emotions like depression can have deep detrimental effects on both physical and mental health [3]. Accurate identification and understanding of emotions hold immense potential and practical significance across various domains [4]. Emotion recognition has useful applications in psychology, healthcare, and human-computer interaction. Emotional states are analyzed in psychology to help understand and treat mental health disorders. It allows healthcare providers to monitor patient health and emotional responses. In human-computer interaction, it improves user experience by modifying interfaces to emotional inputs. Overall, emotion identification contributes to individualized therapies, enhanced mental health care, and more instinctive human-computer interactions, encouraging developments in various fields. While behavioural signals like facial expressions and speech are commonly utilized for affective computing, physiological signals offer incomparable advantages due to their spontaneity [5]. EEG signals characterize underlying brain activity by detecting the electrical patterns created by neurons. Emotional emotions alter brain activity, resulting in different EEG patterns while increasing beta and gamma frequencies are associated with higher emotional arousal, whereas enhanced alpha and theta rhythms are associated with decreased arousal. Analyzing these frequency shifts helps identify emotional states, making EEG a helpful tool for understanding and interpreting emotional experiences by recording the dynamic interplay of brain activity associated with distinct feelings. Its high temporal resolution allows for the study of cross-frequency and neuronal oscillations coupling, which involves connections among diverse frequency bands [6]. Due to these capabilities, many affective computing researches approaches have shifted their focus towards analysing physiological signals [7]. Emotion recognition faces the challenge of accurately determining the true emotional context of stimuli during experiments through annotation or interpretation. Defining emotions precisely poses difficulties, making it complex to establish a clear ground truth for emotions. However, subjective ratings or self-reporting by test subjects during emotional trials have emerged as the most effective method to ascertain and interpret emotions in experiments [8, 9]. While EEG-based recognition systems have made advances in recognizing emotions, limited efforts have been dedicated to artificially eliciting emotional states for improved accuracy in emotion recognition. By adopting a novel approach based on central nervous system signals, this method addresses the limitations of previous emotion recognition techniques, as these signals remain minimally influenced by the previously identified factors. By employing wavelet-based and statistical-based analyses of EEG signals, the technique extracts feature and, when integrated with classification methods, has shown moderate success in identifying up to three, four, and five distinct emotions. Nevertheless, despite EEG's potential for emotion recognition, additional research was required to improve recognition rates of emotion mechanisms [10]. The contribution of this research is listed as follows:
· In this research, Modified Tunicate Swarm Optimization Algorithm (MTSOA) is suggested for feature selection to improve emotion recognition accuracy. MTSOA optimizes the feature subset by adaptively selecting the relevant features, which increases the model's discriminatory strength. This increases the accuracy of emotion identification by evaluating the most informative components of the input data.
· The DEAP database is the source of the collected EEG signals, then EMD and VMD filters was used to decompose the signal. These filters effectively remove noise and artifacts, ensuring that the EEG signals for further processing and classification.
· A Bi-LSTM network was developed to classify human emotions as valence and arousal to enhance computational effectiveness and save time, for optimal hyper-parameters.
The remainder of the article is organized as follows: Section 2 presented the related research articles, while Section 3 showed an example of how the suggested methodology of the study could be applied. The findings and conclusion of this thorough study are presented in Sections 4 and 5.
Samal and Hashmi [11] proposed a feature extraction method in emotion recognition based on Ensemble Median Empirical Mode Decomposition for EEG signal decoding. In the study, EEG signals from 32 subjects sourced in the DEAP database were used to test the proposed approach. The EEG-MEEMD technique indicated better accuracy in distinguishing between the low and high values of arousal and valence with the aid of an ensemble classifier with time, nonlinear characteristics, and frequency. The performance was poor, however, in situations of multiclass categorization.
Pusarla et al. [12] proposed a novel Local Mean Decomposition (LMD) algorithm that efficiently decomposed EEG signals into product functions (PFs), allowing for the capturing of important nonlinear characteristics. Then, these PFs were parameterized by parameters of the Normal Inverse Gaussian distribution. The LMD-domain NIG pdf features extracted hold the emotion class-specific information from the raw EEG signals. The optimized Adaboost classifier further boosted the performance in classification by tuning its hyperparameters. This study contributes to a valuable and robust framework for emotion classification from EEG data, and hence enormously benefits the field.
Ramzan and Dawn [13] constructed a hybrid neural network that integrated with temporal and spatial appearances of input signals to satisfactorily classify different emotions. Emotions such as HVLV, HALA, dominance, familiarity, and liking were represented through visualized data from the DEAP dataset, while emotions were classified as positive or negative in degree using the SEED dataset. Fusion of deep learning methods, LSTM-RNN and CNN, returned the best performance in emotion analysis using EEG signals. The results provided an exciting development in emotion classification and analysis using deep learning techniques for processing EEG signals in real time.
Gao et al. [14] generated a feature extraction process using PSD, differential entropy, sample entropy, GoogleNet and Hjorth feature. Extracted features consisted of contextual and spatial information, which were further used to classify the human emotion through SVM. The performance of this model has been tested on the DEAP dataset; the results demonstrated better performance as compared to other classifiers. However, the suggested method requires further enhance by incorporating fuzzy logic techniques and optimization approaches into the ML models.
Zali-Vargahan et al. [15] proposed an efficient method for emotion recognition across different subjects using multi-channel EEG signals. The model used three fusion schemes to merge the information from various channels. Among these, the FaDFR scheme proved to be most accurate. The proposed approach combines time-frequency features of EEG channels with feature extraction by Inception-V3 CNN and SVM-based organization. The results show the potential of the approach to extract, with very high accuracy, emotional information from EEG signals, and thus it is applied to affective computing, human-computer interaction, and neuromarketing.
The integration of a kernel matrix with DNNs was employed by Zhang et al. [16] for emotion recognition, effectively capturing the interrelation between multi-modal physiological EEG signals and achieving improved recognition results. The proposed fusion method demonstrated efficient capturing of relationships between these signals through the kernel function representation, leading to enhanced fusion performance. However, the assumption of strong independence posed challenges in capturing complementary relationships between different data types.
Zong et al. [17] introduced FCAN-XGBoost, a novel EEG-based emotion recognition method that enhances classification performance. This method incorporates FANet, which uses a channel attention mechanism to variably weigh features based on their importance, improving model accuracy. The approach achieves higher accuracy in emotion recognition while requiring fewer computational resources, as evidenced by reduced computation time and lower memory usage. However, the method's accuracy on the DREAMER dataset was comparatively lower than on the DEAP dataset, likely due to data availability issues.
The TSOA improves multiclass classification performance by optimizing hyperparameter and model selection. Tunicate Swarm's adaptive search method allows it to efficiently traverse the hyperparameter space, improving the model's ability to handle multiclass scenarios. Its better exploration and exploitation balance results in enhanced classification accuracy, minimizing the constraints identified in existing approaches and demonstrates superior performance in complicated multiclass emotion recognition tasks.
Increasing the accuracy of EEG signals based on emotion recognition is the aim of the proposed ITSOA.The process involved in various stages of classifying the emotions that are data collection, pre-processing, feature extraction, feature selection, Hyper parameter optimization and classification. The initial step involves acquiring data from a publicly available dataset, followed by a pre-processing phase to eliminate irrelevant or inappropriate features. Subsequently, a feature selection process is applied to choose relevant and non-redundant features. Furthermore, optimal hyper-parameters are selected by utilizing IRSOA. Finally, an efficient classification is conducted using a Bi-LSTM to achieve accurate predictions. The Flow diagram of the suggested method is illustrated in Figure 1.
Figure 1. Flow diagram of the suggested method
3.1 Data collection
In this research, the raw data is obtained from publicly available dataset namely DEAP dataset [18]. The description of the mentioned dataset is mentioned as follows:
The DEAP database comprises 40-channel EEG data collected from 32 individuals. It includes four emotional variables: arousal, valence, dominance, and liking, for this study, 40 EEG trials featuring 40 films were utilized, with scores ranging from 0 to 9. Each trial had a duration of 60 seconds, and specifically, the second-half EEG trials were selected for analysis. The DEAP database contains EEG data from 32 channels during emotional stimulations for 32 varience, with each session lasting 42 seconds. Emotional dimensions with rating scores in the range of 0-5 are considered low, while those in the range of 5-9 are considered high. It is a four-class classification problem because the emotions in the DEAP database are divided into four quadrants: low arousal high valence (LAHV) to relaxation, High Arousal Low Valence (HALV) to anger, High Arousal High Valence (HAHV) to happiness, and Low Arousal Low Valence (LALV) to sadness.
Figure 2 shows an example of the obtained EEG signals.
Figure 2. Sample acquired EEG signals
3.2 Data Pre-processing
After the stage of data collection, the pre-processing was utilized to transform the data into a processed format without complexities. Prior to applying decomposition filters, EEG signals undergo pre-processing that includes noise filtering, re-referencing, and artefact removal. Empirical mode decomposition and variational mode decomposition are two preprocessing processes. These techniques improve the quality of EEG data, resulting in more accurate findings when utilizing decomposition filters for feature extraction in emotion detection algorithms. It involves EMD [19] and VMD [20] filters, the process of the proposed method is briefly outlined as follows.
•Empirical mode decomposition
After obtaining EEG signals from the DEAP database, researchers employ the EMD technique to effectively decompose the non-linear and non-static signals, thereby eliminating undesired noise and artifacts. The initial phase involves categorizing the collected EEG signals into multiple IMFs using the EMD method. Each IMF then functions as a sub-band gesture, facilitating the subsequent decomposition of the sub-strip signal. Eqs. (1) and (2) the mean value of both the lower and upper envelopes.
$x(t)=\sum_{m=1}^M D_m(t)+r_M(t)$ (1)
where, $D_m(t)$ corresponds to the IMFs obtained through the EMD of the time-series EEG signal $x(t)$. Where, $x(t)$ can be expressed as the sum of all the decomposed IMFs along with the residue.
$m(t)=\frac{e_m(t)+e_l(t)}{2}$ (2)
where, $e_m(t)$ represents the lower envelope and $e_l(t)$ represents the upper envelope, then $m(t)$ represents lower envelope. Two crucial criteria must be satisfied during the decomposition process. Two main conditions are followed during each iteration of decomposition. The EMD model for sample-decomposed signal is depicted in Figure 3.
•Variational mode decomposition
VMD is a method of time-frequency decomposition.Its basic idea is to break down the original signal into individual modulations (IMFs) with different centre frequencies and bandwidths by iteratively solving the variational equation.
VMD is particularly well-suited for processing nonlinear and non-stationary signals, offering clear advantages over EMD. It effectively addresses the mode aliasing issue encountered in EMD. The mathematical representation of the variational problem with constraints is depicted in Eq. (3):
$\begin{gathered}\left\{v_k\right\}^{\min, } \\ \left\{\omega_k\right\}\left\{\sum_k\left\|\partial_t\left[\left(\delta(t)+\frac{j}{\pi t}\right) * v_k(t)\right] e^{-j w_k t}\right\|_2^2\right\} \\ \text { s.t. } \sum_k v_k=f\end{gathered}$ (3)
$v_k=\left\{v_1, \ldots . v_k\right\} \quad$ represents IMFs after VMD decomposition, $K$ represents the number of IMFs, $\left\{\omega_k\right\}=$ $\left\{\omega_1, \ldots . \omega_k\right\}$ represents the centre frequency of each component. $f$ is original input signal, $j$ is an imaginary unit, $\partial_t$ is the partial derivative of $t, *$ represents the convolution, $\delta(\mathrm{t})$ is the impact signal, $\lambda(\mathrm{t})$ are introduced into Eq. (3) to convert the constrained issue. $\left(\sum_{k:} \sum_{k=1}^k\right)$ represents the sum of all modes $\alpha$ is the balance stricture of data fidelity constraint, then the function expression in Eq. (4).
$\begin{gathered}\left(\left\{v_k\right\},\left\{\omega_k\right\}, \lambda\right) \\ =\alpha \sum_k\left\|\partial_t\left[\left(\delta(t)+\frac{j}{\pi t}\right) * v_k(t)\right] e^{-j w_k t}\right\|_2^2 \\ +\left\|f(t)-\sum_k v_k(t)\right\|_2^2+\left\langle\lambda(t) \sum_k v_k(t)\right\rangle\end{gathered}$ (4)
To achieve the optimal solution of Eq. (4), is employed, enabling continuous informs $v_k^{n+1}, \omega_k^{n+1}, \lambda_k^{n+1}$ Through iterative processes, the irregular direction multiplier process is used to attain the "saddle point" of Eq. (5) $v_k^{n+1}$ is:
$\begin{aligned} v_k^{n+1}= & \arg \min \left\{\alpha \| \partial_t\left[\left(\delta(t)+\frac{j}{\pi t}\right)\right.\right. \\ & \left.* v_k(t)\right] e^{-j w_k t} \|_2^2 \\ & \left.+\left\|f(t)-\sum_i v_i(t)+\frac{\lambda(t)}{2}\right\|_2^2\right\}\end{aligned}$ (5)
where, $\omega_k=\omega_k^{n+1}, \sum_i v_i(t)=\sum_{i \neq k} v_i(t)^{n+1}$.
Eq. (6) is subjected to Fourier transform to derive the frequency domain expressions of the IMF and the centre frequency, respectively.
$\hat{v}_k^{n+1}(\omega)=\frac{\hat{f}(\omega)-\sum_{i \neq k} \hat{v}_i(\omega)+\frac{\hat{\lambda}(\omega)}{2}}{1+2 \alpha\left(\omega-\omega_k\right)^2}$ (6)
$\omega_k^{n+1}=\frac{\int_0^{\infty} \omega\left|\hat{v}_k(\omega)\right|^2 d \omega}{\int_0^{\infty}\left|\hat{v}_k(\omega)\right|^2 d \omega}$ (7)
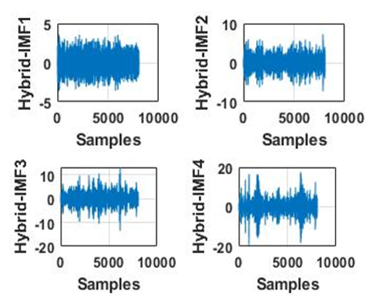
In each iteration $v_k^{n+1}$ is obtained through Wiener filtering of $\hat{f}(\omega)$ minus the sum of all other $\hat{f}(\omega)-\sum_{i \neq k} \hat{v}_i(\omega)$, where $i$ is not equal to k . The term $\omega_k^{n+1}$ represents the centre frequency, and $\hat{v}_k(\omega)$ denotes the inverse Fourier transform. The real part of the result is represented as $v_k(t)$. EEG signals exhibit evident nonlinear and non-stationary characteristics, and the application of VMD proves beneficial in reducing their non-stationarity. The hybrid model for sample-decomposed signal was illustrated in Figure 4.
3.3 Feature extraction
The first pre-processing step yields the pre-processed output, which is subsequently used as input for the feature extraction stage that follows. The goal of extracted features is to help with analysis and learning algorithms in a variety of applications, including machine learning and pattern recognition, by identifying and selecting the most relevant and useful properties from raw data. The hybrid feature extraction method encompasses a diverse set of statistical techniques for extracting feature values from the processed signals. These techniques include, sample entropy, zero-cross rate, Hjorth activity, mean-curve-length, standard deviation, variance, Shannon entropy, normalized first difference, Hjorth complexity, auto-regressive model, mean Teager energy, Hjorth mobility and various band power measurements such as delta, beta, alpha and gamma. Additionally, the feature extraction involves the ratio of band power between alpha and beta frequencies, as well as minimum and maximum computations [21]. This hybrid feature extraction produces a significant feature length of 2676 in the context of two-dimensional emotion prediction. It is further optimized to 1204 useful features for both valence and arousal classes.
The operation of this hybrid approach offers several advantages, including improved accuracy, reduced risk of overfitting, enhanced data visualization, and accelerated training process when integrated with Bi-LSTM networks.
3.4 Feature selection
The step of suggested feature selection receives the pre-processed output, which is obtained from the feature extraction stage and fed as input. Because of its adaptive feature space exploration, TSOA performs better when it comes to feature selection for emotion categorization. In order to identify the most crucial attributes, TSOA carefully looks over feature subsets, striking a balance between exploration and exploitation. Its adaptability to alter the search approach guarantees the inclusion of discriminative features, enhancing the model's capacity to identify complex emotional patterns. By assessing the extraction of critical information from the input data, the dynamic nature of TSOA improves feature selection over prior methods, leading to more reliable and efficient models. It also demonstrated higher accuracy in emotion categorization. Below is a brief description of the feature selecting approaches procedure.
3.4.1 Tunicate swarm optimization algorithm
Because it finds better optimal solutions than competing techniques, the new meta-heuristic optimization algorithm TSA is used in this work. TSA shows to be especially useful in solving practical engineering design issues. When living in aquatic settings, tunicates use two methods to find food: they use swarm intelligence, and they determine the best state to locate food in.
(1) Search agents for avoiding conflicts
Eqs. (8)-(10) establishes the role of a search agent, which incorporates the $\vec{A}, \vec{G}$, and $\vec{M}$ vectors in order to prevent disagreements between tunicates.
$\vec{A}=\frac{\vec{G}}{\vec{M}}$ (8)
$\vec{G}=c_2+c_3-\vec{F}$ (9)
$\vec{F}=2 . c_1$ (10)
Advection of water flow in the deep ocean is denoted by $\vec{F}$, whereas $\vec{G}$ stands for gravity and $\vec{M}$ for social interactions. $C_1$, $C_2$, and $C_3$ are random variables that fall inside the interval [0 , 1]. The estimation of $\vec{M}$ can be obtained using Eq. (11).
$\vec{M}=\left[P_{\min }+c_1 \cdot\left(P_{\max }-P_{\min }\right)\right]$ (11)
where, Pmin and Pmax are the minimum and maximum speeds correspondingly for social interface. It is essential to note that these values for Pmin and Pmaxhave been set at 1 and 4 respectively.
(2) Move to the best neighbor direction
The motion of the tunicates according to Eq. (12) is in the direction of their best neighbour.
$\vec{P} D=\left|\vec{F} S-r_{\text {and }} \cdot \vec{P}_p(x)\right|$ (12)
Here, rand is a random volume within the interval $[0,1]$, distance refers to the food source, tunicate is represented as $\vec{P} D$, x is the optimum food source which is determined by $\vec{F} S$, and the location of the tunicate is expressed as $\vec{P}_p(x)$ transmitting towards best search agent. Eq. (13) gives the optimal position of the tunicate with respect to the food location.
$\vec{P}_p(x)=\left[\begin{array}{l}\vec{F} S+\vec{A} \cdot \vec{P} D ; \text { if }: r_{\text {and }} \geq 0.5 \\ \vec{F} S-\vec{A} \cdot \vec{P} D ; \text { if }: r_{\text {and }}<0.5\end{array}\right]$ (13)
Finding the optimal solutions between the first two optima is the first step towards simulating tunicate features. The locations of additional search agents are then effective, accounting for the best tunicate's location. Eq. (14) can be utilized to estimate the tunicates' swarm characteristics.
$\vec{P}_p(\vec{x}+1)=\frac{\vec{P}_p(x)+\vec{P}_p(\vec{x}+1)}{2+c_1}$ (14)
3.4.2 Modified tunicate swarm optimization algorithm
An MTSOA is incorporated in the original $\vec{A}, \vec{G}$, and $\vec{M}$ vectors to improve the global and local search capabilities of the standard TSA. By using these vectors, search agents can traverse the search space at random and facilitate conflict-free exploration. By modifying these vectors, it is possible to achieve better phases for exploration and exploitation. The reason MTSOA is used for feature selection in emotion detection is because it can navigate complex search spaces with ease.
Through feature subset optimization, MTSOA chooses the most pertinent EEG signal elements to enhance model performance. Its efficiency and adaptability contribute to increased accuracy in emotion identification systems. However, because some differences become caught in local optima, finding the global optimum may be challenging, particularly in higher-dimensional and complex situations. This study enhances TSA's exploring capability in the ways that follow:
(1) Improved exploration ability
The study's initial values for the numerator and denominator are set to be low and high, respectively. This modification allows search agents to cover a wider area of the search field by allowing them to travel at a slower pace.
Because the targets of this enhanced approach are local searches, striking a balance between exploration and exploitation is important. As the number of iterations increases, the values gradually decline to lower levels. By implementing these adjustments, the exploitation phase is enhanced and leads to more effective local explorations.
The improved form of vector $\vec{A}$ can be represented by Eq. (15).
$\vec{A}=\frac{2-4\left(t / t_{\max }\right)}{4-3\left(t / t_{\max }\right)}$ (15)
where, the values for the current iteration and the maximum number of iterations are represented by t and tmax.
Therefore, the result of the recommended feature selection is subjected to hyperparameter optimisation in order to enhance the accuracy of emotion recognition, as briefly described in the stage below.
3.5 Hyper parameter optimization
In order to increase the accuracy of emotion identification, the hyper parameter optimisation was improved utilising the RSOA after the suggested feature selection step. The RSOA is used in emotion recognition to choose hyperparameters due to its ability to efficiently search parameter spaces. Better accuracy and robustness are attained by the model's optimal configuration for emotion detection tasks, which is ensured by its adaptive nature and ability to find global optima.
Hyperparameters regulate how machine learning models behave, affecting both their effectiveness and generalization. The parameter includes learning rate of 0.001 to 1, hidden units of 10 to 500, regularization strength of 0.01 to 0.1, batch size of 32 to 512, and activation functions of ReLU, sigmoid, respectively. A powerful metaheuristic optimisation method called RSOA was developed by observing how attacking and following rats behave. This method conducts hyperparameter optimisation by modelling the aggressive and follow-the-rat behaviour, which ultimately leads to improved performance [22]. Eq. (16) scientifically indicates that the search space is initialised by the RSOA.
$x_i=x_{i \text { min }}+\operatorname{rand} \times\left(x_{i \text { max }}-x_{i \text { min }}\right), i=1,2, \ldots N$ (16)
In Eq. (17), $x_{i \text { max }}$ and $x_{i \text { min }}$ represent the upper and lower bounds respectively, of the ith variable, while N stands for the total number of agents. Through this aggressive process, therefore, the rat is scientifically shown in Eq. (17) to create updated positions of the rat.
$\vec{P}_i(x+1)=\left|\vec{P}_r(x)-\vec{P}\right|$ (17)
In this context, $\vec{P}_i(x+1)$ signifies the efficient locations of the $i^{\text {th }}$ rats, and $\vec{P}_r(x)$ denotes the best optimum resolution. The computation of the time $\vec{P}$ is carried out using Eq. (18).
$\vec{P}=A \times \vec{P}_i(x)+C \times\left(\vec{P}_r(x)-\vec{P}_i(x)\right)$ (18)
In this instance, $\vec{P}_i(x)$ denotes the position of the ith rat, whereas the matrices A and C are found by consuming Eqs. (19) and (20), respectively.
$A=R-x \times\left(\frac{R}{\text { Iter}_{\max }}\right), x=1,2,3, \ldots$. Iter $_{\max }$ (19)
$C=2 \times$ rand (20)
In the RSOA, Iter$_{\text {max }}$ described the maximum volume of iterations, $x$ denotes the current iteration, $R$ represents a random amount within the range [1,5], and $C$ indicates a random amounts within the range [0,2]. N-dimensional vector $X$ is scientifically represented in Eq. (21).
$X=\left(x_1, x_2, \ldots . x_N\right)$ (21)
where, $x_i \in\left[x i_{\text {min }}, x_{\text {imax }}\right]$, and the opposed point of $x_i$ is characterized as $\bar{x}_i$ and it is revealed in Eq. (22).
$\bar{x}_i=\left(x_{\text {imax }}, x_{\text {imin }}\right)-x_i, i=1,2, \ldots, N$ (22)
Conversely, to enhance the search exploration in the ITSOA at each iteration, the best resolution is substituted with a new resolution based on Eq. (23).
$x_{\text {worst }}=\left\{\begin{array}{cc}\operatorname{rand}_1 \times \vec{P}_r(x), & \text { if rand}{ }_3 \leq 0.5 \\ \left(x_{\text {imax }}-x_{\text {imin }}\right)-x_i, & \text { if rand}{ }_3>0.5\end{array}\right.$ (23)
In this context, rand $_1$, rand $_2$, and rand $_3$ represent random records within the range of 0 to 1 , and $x_{\text {worst }}$ indicates the resolution with a high value by applying these concepts, the hyper parameter optimization outcomes are improved as the vector locations of the least hierarchical rats are exchanged with the finest results attained distant, denoted as $\vec{P}_r(x)$, in each group.
3.6 Classification using Bi-LSTM
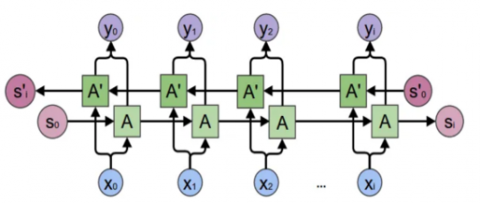
Using the DEAP dataset, the Bi-LSTM is run after the hyper parameter optimisation stage to increase the accuracy of emotion categorization. Because it can identify temporal correlations in emotional sequences and both past and future contextual information, the Bi-LSTM is crucial for classifying emotions. One of its advantages is that it can manage bidirectional dependencies, which makes it possible to understand emotional expression more accurately. Bi-LSTM is selected because of its ability to describe intricate temporal patterns. It performs better than alternative techniques by effectively capturing long-range relationships, enhancing the precision of emotion classification models for a more complex and contextually sensitive emotional content interpretation. An effective deep learning model for classifying emotions is called Bi-LSTM [23]. The bidirectional feature improves the model's comprehension of context by allowing it to take into account information from the past as well as the future. Bi-LSTM uses text inputs to represent the emotional context of the text in classifying the emotions. This is a popular choice for classifying tasks related to emotion in natural language processing, due to the ability to gather context and sequence information that furthers our understanding of a multitude of applications of human emotions and sentiment.
The structure of a Bi-LSTM is shown in Figure 5.
Figure 3. Sample-decomposed EEG signal of EMD model [24]
Figure 4. EMD+VMD technique for sample-decomposed EEG signal [24]
Figure 5. Structure of a Bi-LSTM architecture
A forward calculation with an RNN in positive direction, notationally represented by $\mathrm{A}_1 \rightarrow \mathrm{A}_2 \cdots \rightarrow \mathrm{A}_t$, proceeds. At time $t$, the input is the sequential data $x_t$, and the output is the A$_{(t-1)}$ of the time before. In other parts, a reverse calculation that runs in the opposite way has a direct RNN in positive direction, symbolically noted again as $\mathrm{A}_1 \rightarrow \mathrm{A}_2 \cdots \rightarrow \mathrm{A}_{\mathrm{t}}$. The input at time $t$ is again sequential data $x_t$, and the output is now the A$_{(t+1)}$.
This section evaluates the proposal's outcomes in order to provide conclusions based on the emotion classification. The outcome section has subsections for performance analysis and comparison analysis.
Performance analysis Also presented is the evaluation of the efficiency of the suggested strategy using the DEAP dataset. The effectiveness of the suggested strategy is compared with other approaches documented in the literature for a comparative study.
The estimation metrics include accuracy, precision, sensitivity, specificity, and f-measure, which are obtained by utilizing Eqs. (24)-(28) given below:
$Accuracy =\frac{T P+T N}{T P+T N+F P+F N} \times 100$ (24)
$Precision=\frac{T P}{F P+T P} \times 100$ (25)
$Sensitivity =\frac{T P}{T P+F N} \times 100$ (26)
$Specificity =\frac{T N}{T N+F P} \times 100$ (27)
$F 1-score=\frac{2 T P}{2 T P+F P+F N} \times 100$ (28)
where, TP, FP, TN, and FN represent False Positive, True Positive, False Negative, and True Negative respectively.
4.1 Experimental setup
In this research, an Intel Core i7 processor and 16 GB of RAM are configured in MATLAB R2020b to simulate the performance of the proposed ITSOA network. In this paper, different measures, like specificity, sensitivity, f1-score, precision, and classificatory accuracy, have been used to analyze the performance of the suggested ITSOA network.
4.2 Performance analysis of actual features for DEAP dataset
The performance of the suggested ITSOA on the DEAP dataset is assessed in this section. As indicated in Tables 1 and 2, the results are compared with a variety of classifiers, such as random forest, Deep Neural Network (DNN), Multi-Support Vector Machines (MSVM), and Generative Adversarial Network (GAN). The DEAP dataset is used to assess the trial results for many classifications, including arousal and valence.
Table 1. Performance analysis of actual features for arousal
|
Method |
Sensitivity (%) |
Accuracy (%) |
F1_score (%) |
Specificity (%) |
Precision (%) |
|
RF |
84.67 |
80.13 |
83.76 |
83.92 |
82.86 |
|
GAN |
80.87 |
82.76 |
80.86 |
79.28 |
80.84 |
|
DNN |
81.97 |
80.00 |
80.05 |
83.99 |
90.00 |
|
MSVM |
69.74 |
68.44 |
69.29 |
69.07 |
68.85 |
|
Bi-LSTM |
86.99 |
83.54 |
84.45 |
84.10 |
82.05 |
Table 2. Performance analysis of actual features for valence
|
Classifiers |
Accuracy (%) |
Sensitivity (%) |
Specificity (%) |
F1_score (%) |
Precision (%) |
|
RF |
82.81 |
80.01 |
79.60 |
81.56 |
83.16 |
|
GAN |
81.67 |
80.24 |
81.49 |
81.31 |
82.40 |
|
DNN |
79.45 |
79.78 |
78.11 |
79.25 |
78.73 |
|
MSVM |
82.29 |
79.37 |
80.68 |
79.88 |
80.38 |
|
Bi-LSTM |
86.25 |
86.92 |
87.91 |
86.11 |
85.31 |
Table 3. Performance analysis of optimized features for arousal
|
Classifiers |
Accuracy (%) |
Sensitivity (%) |
Specificity (%) |
F1_score (%) |
Precision (%) |
|
RF |
82.71 |
80.83 |
85.63 |
82.17 |
83.54 |
|
GAN |
82.80 |
81.62 |
85.71 |
82.20 |
82.79 |
|
DNN |
81.80 |
81.62 |
82.71 |
82.20 |
82.79 |
|
MSVM |
76.87 |
72.50 |
72.50 |
75.99 |
79.83 |
|
Bi-LSTM |
89.58 |
88.83 |
86.25 |
89.10 |
89.38 |
Table 4. Performance analysis of optimized features for valence
|
Classifiers |
Accuracy (%) |
Sensitivity (%) |
Specificity (%) |
F1_score (%) |
Precision (%) |
|
RF |
85.54 |
83.58 |
84.58 |
83.37 |
83.16 |
|
GAN |
90.83 |
90.96 |
90.58 |
92.06 |
93.20 |
|
DNN |
86.67 |
85.11 |
84.11 |
85.52 |
85.95 |
|
MSVM |
82.29 |
81.37 |
80.68 |
80.88 |
80.38 |
|
Bi-LSTM |
92.29 |
92.07 |
93.41 |
93.49 |
94.95 |
According to the Tables 1 and 2, it showed when compared to existing methods the suggested method achieved better outcomes accuracy of 83.54% in arousal and 86.25% in valence respectively. Extensive experimental outcomes demonstrate that the suggested ITSOA network efficiently minimizes data loss and achieves high recognition accuracy in two-level emotion classification.
4.3 Performance analysis of optimized features for DEAP dataset
Selected traits or qualities of a system or procedure that have been enhanced or adjusted to attain optimal effectiveness and performance are referred to be optimized features. Additionally, Tables 3 and 4 present the experimental results for various classes, including arousal and valence, utilizing the DEAP dataset.
From the Tables 3 and 4, it showed when compared to existing methods the suggested method achieved better outcomes accuracy of 89.58% in arousal and 92.29% in valence respectively. The experimental outcomes described the efficiency of the suggested ITSOA network in minimizing information loss and analysing recognition accuracy in two-level emotion classification.
4.4 Performance analysis of feature selection techniques for DEAP dataset
The outcomes are compared with various feature selection optimization methods, including Manta Ray Foraging Optimization (MRFO), Multi-parameter Optimization (MPO), and Whale Optimization Algorithm (WOA), as presented in Table 5 and Table 6. The experiment results are computed for different categories, such as valence and arousal, within the DEAP dataset.
Table 5. Performance analysis of feature selection methods for arousal
|
Methods |
Accuracy (%) |
Sensitivity (%) |
Specificity (%) |
F1_score (%) |
Precision (%) |
|
MRFO |
81.75 |
82.77 |
84.81 |
82.13 |
81.51 |
|
MPO |
82.39 |
83.30 |
84.33 |
83.15 |
83.00 |
|
WOA |
73.53 |
74.95 |
72.60 |
73.28 |
71.68 |
|
Proposed |
89.58 |
88.83 |
86.25 |
89.10 |
89.38 |
Table 6. Performance analysis of feature selection optimization for valence
|
Methods |
Accuracy (%) |
Sensitivity (%) |
Specificity (%) |
F1_score (%) |
Precision (%) |
|
MRFO |
84.21 |
84.07 |
85.01 |
84.93 |
85.81 |
|
MPO |
80.58 |
79.94 |
81.12 |
79.78 |
79.63 |
|
WOA |
81.83 |
83.03 |
81.89 |
83.36 |
83.68 |
|
Proposed |
92.29 |
92.07 |
93.41 |
93.49 |
94.95 |
Figure 6. Graphical representation of suggested method for arousal
Figure 7. Graphical representation of suggested method for valence
Table 7. Performance analysis of optimization techniques for arousal
|
Methods |
Sensitivity (%) |
F1_score (%) |
Accuracy (%) |
Specificity (%) |
Precision (%) |
|
PSO |
82.28 |
81.18 |
80.57 |
84.01 |
80.12 |
|
SSA |
75.30 |
74.37 |
77.39 |
74.33 |
73.45 |
|
FOA |
74.86 |
73.12 |
73.45 |
72.55 |
71.47 |
|
Proposed |
88.83 |
89.10 |
89.58 |
86.25 |
89.38 |
Table 8. Performance analysis of hyper parameter optimization for valence
|
Methods |
Sensitivity (%) |
F1_score (%) |
Accuracy (%) |
Specificity (%) |
Precision (%) |
|
PSO |
82.50 |
83.92 |
82.32 |
85.93 |
85.38 |
|
SSA |
80.69 |
80.07 |
81.54 |
81.31 |
79.46 |
|
FOA |
84.60 |
84.51 |
81.18 |
80.44 |
84.43 |
|
Proposed |
92.07 |
93.49 |
92.29 |
93.41 |
94.95 |
According to the Table 5 and 6, it showed when compared to existing methods the suggested method achieved better outcomes accuracy of 89.58% in arousal and 92.29% in valence respectively. The graphical representation of the suggested feature selection optimization method was illustrated in the Figure 6 and Figure 7 respectively.
4.5 Performance analysis of different optimization techniques for DEAP dataset
In this section, the simulation outcomes of the suggested ITSOA are tested on the DEAP dataset. By viewing Table 7 and Table 8, the suggested method was compared with various hyper parameter optimizations like, Particle Swarm Optimization (PSO), Salp Swarm Algorithm (SSA) and Forest Optimization Algorithm (FOA). Here, the experimental outcomes are assessed for distinct classes such as arousal and valence using DEAP dataset was demonstrated in Table 7 and Table 8.
From the outcomes presented in Table 7 and Table 8, the suggested method outperformed existing approaches, achieving an accuracy of 89.58% in arousal and 92.29% in valence. The extensive experimental results highlight the effectiveness of the suggested ITSOA network in minimizing information loss and analysing recognition accuracy in two-level emotion classification.
4.6 Comparative analysis
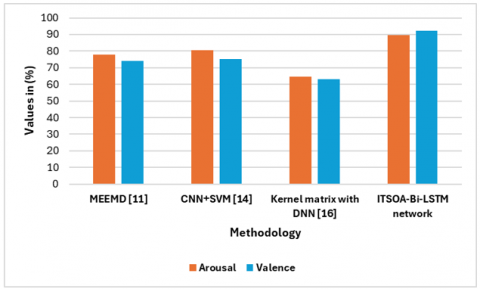
Comparing data to find patterns and distinctions for insightful analysis or decision-making is known as comparative analysis. This subsection evaluates the performance of the categorization strategy against the existing approaches indicated in related studies. Table 9 presents the findings from the assessment of the suggested methodology for the DEAP dataset. The graphical representation of the suggested method with various algorithms is showed in Figure 5.
Table 9. Comparative analysis with various algorithms for the proposed approach
|
Models |
Classification Accuracy (%) |
|
|
Arousal |
Valence |
|
|
MEEMD [11] |
78.00 |
74.03 |
|
CNN with SVM [14] |
80.52 |
75.22 |
|
Kernel matrix + DNN [16] |
64.50 |
63.10 |
|
ITSOA-Bi-LSTM network |
89.58 |
92.29 |
In terms of arousal and valence prediction, MTSOA fared better than MEEMD, CNN+SVM, and Kernel matrix with DNN. Outperforming alternative methods, MTSOA's adaptive feature selection and effective parameter adjustment contributed to improved performance. This indicates that it can effectively capture the emotional states, which suggests that it could be used as an optimisation method for emotion classification issues. Because of its adaptive feature selection and ideal parameter tuning, MTSOA outperforms MEEMD, CNN with SVM, and Kernel matrix+DNN in the emotion classification domain, producing a more accurate representation of emotional patterns. MEEMD may lack adaptability, CNN with SVM was struggle with dynamic feature selection, and Kernel matrix with DNN have difficulty capturing complex emotional aspects. However, MTSOA's effectiveness to initial fields and dataset characteristics has limitations. In the near future, ITSOA network will be tested on other datasets, e-learner emotion classification, and enhancing recognition tasks. Table 9 and Figure 8 demonstrate that the proposed classification approach outperformed other methods in overall performance metrics. The accuracy achieved by the proposed approach for arousal is 89.58%, and valence is 92.29% significantly higher than the Ensemble Median Empirical Mode Decomposition (MEEMD) of 78.00% and 74.03%, CNN with SVM of 80.52% and 75.22%, and Kernel matrix +DNN of 64.50% and 63.10% respectively.
Figure 8. A graphical representation of the suggested ITSOA-Bi-LSTM network with existing models
This research presents a novel ITSOA network for efficient EEG-based emotion classification, aiming to address the challenging task of classifying emotions based on EEG signals in recent decades. The DEAP dataset is utilized to locate and classify human emotions. Then, for pre-processing EMD and VMD, are employed to remove noise from EEG signals, allowing for the retrieval of the most informative details. According to the results, this research demonstrates the efficiency of MTSOA in emotion classification, exceeding conventional approaches. Key findings include adaptive feature selection and optimal parameter tuning, which contribute to improved accuracy. The significance in TSOA's potential impact on emotion categorization, which offers a robust and reliable optimization strategy. Consequently, the model's performance is enhanced by this research, offering important insights for numerous applications. The results showed that the recommended technique outperformed the MEEMD, CNN with SVM, and Kernel matrix with DNN methods in terms of arousal (89.58%) and valence (92.29%), respectively. The proposed ITSOA network will be tested for e-learner's emotion classification on other datasets in subsequent research.
[1] Iyer, A., Das, S.S., Teotia, R., Maheshwari, S., Sharma, R.R. (2023). CNN and LSTM based ensemble learning for human emotion recognition using EEG recordings. Multimedia Tools and Applications, 82(4): 4883-4896. https://doi.org/10.1007/s11042-022-12310-7
[2] Hosseini, M.S.K., Firoozabadi, S.M., Badie, K., Azadfallah, P. (2023). Personality-based emotion recognition using EEG signals with a CNN-LSTM network. Brain Sciences, 13(6): 947. https://doi.org/10.3390/brainsci13060947
[3] Gupta, H., Sharma, O., Bhardwaj, D., Yadav, J., Singh, I. (2023). EEG signal based multi class emotion recognition using hybrid 1D-CNN and GRU. Research Square. http://doi.org/10.21203/rs.3.rs-2939343/v1
[4] Liu, S., Wang, X., Zhao, L., Li, B., Hu, W., Yu, J., Zhang, Y.D. (2021). 3DCANN: A spatio-temporal convolution attention neural network for EEG emotion recognition. IEEE Journal of Biomedical and Health Informatics, 26(11): 5321-5331. https://doi.org/10.1109/jbhi.2021.3083525
[5] Song, T., Zheng, W., Liu, S., Zong, Y., Cui, Z., Li, Y. (2021). Graph-embedded convolutional neural network for image-based EEG emotion recognition. IEEE Transactions on Emerging Topics in Computing, 10(3): 1399-1413. https://doi.org/10.1109/TETC.2021.3087174
[6] Cui, G., Li, X., Touyama, H. (2023). Emotion recognition based on group phase locking value using convolutional neural network. Scientific Reports, 13(1): 3769. https://doi.org/10.1038/s41598-023-30458-6
[7] García-Hernández, R.A., Celaya-Padilla, J.M., Luna-García, H., García-Hernández, A., Galván-Tejada, C.E., Galván-Tejada, J.I., Gamboa-Rosales, H., Rondon, D., Villalba-Condori, K.O. (2023). Emotional state detection using electroencephalogram signals: A genetic algorithm approach. Applied Sciences, 13(11): 6394. https://doi.org/10.3390/app13116394
[8] Baradaran, F., Farzan, A., Danishvar, S., Sheykhivand, S. (2023). Automatic emotion recognition from EEG signals using a combination of type-2 fuzzy and deep convolutional networks. Electronics, 12(10): 2216. https://doi.org/10.3390/electronics12102216
[9] Baradaran, F., Farzan, A., Danishvar, S., Sheykhivand, S. (2023). Customized 2D CNN model for the automatic emotion recognition based on EEG signals. Electronics, 12(10): 2232. https://doi.org/10.3390/electronics12102232
[10] Luo, Y., Wu, C., Lv, C. (2023). Cascaded convolutional recurrent neural networks for EEG emotion recognition based on temporal–frequency–spatial features. Applied Sciences, 13(11): 6761. https://doi.org/10.3390/app13116761
[11] Samal, P., Hashmi, M.F. (2023). Ensemble median empirical mode decomposition for emotion recognition using EEG signal. IEEE Sensors Letters, 7(5): 7001704. https://doi.org/10.1109/LSENS.2023.3265682
[12] Pusarla, N., Singh, A., Tripathi, S. (2022). Normal inverse Gaussian features for EEG-based automatic emotion recognition. IEEE Transactions on Instrumentation and Measurement, 71: 1-11. https://doi.org/10.1109/TIM.2022.3205894
[13] Ramzan, M., Dawn, S. (2023). Fused CNN-LSTM deep learning emotion recognition model using electroencephalography signals. International Journal of Neuroscience, 133(6): 587-597. https://doi.org/10.1080/00207454.2021.1941947
[14] Gao, Q., Yang, Y., Kang, Q., Tian, Z., Song, Y. (2022). EEG-based emotion recognition with feature fusion networks. International Journal of Machine Learning and Cybernetics, 13(2): 421-429. https://doi.org/10.1007/s13042-021-01414-5
[15] Zali-Vargahan, B., Charmin, A., Kalbkhani, H., Barghandan, S. (2023). Deep time-frequency features and semi-supervised dimension reduction for subject-independent emotion recognition from multi-channel EEG signals. Biomedical Signal Processing and Control, 85: 104806. https://doi.org/10.1016/j.bspc.2023.104806
[16] Zhang, X., Liu, J., Shen, J., Li, S., Hou, K., Hu, B., Gao, J., Zhang, T. (2020). Emotion recognition from multimodal physiological signals using a regularized deep fusion of kernel machine. IEEE Transactions on Cybernetics, 51(9): 4386-4399. https://doi.org/10.1109/TCYB.2020.2987575
[17] Zong, J., Xiong, X., Zhou, J., Ji, Y., Zhou, D., Zhang, Q. (2023). FCAN–XGBoost: A novel hybrid model for EEG emotion recognition. Sensors, 23(12): 5680. https://doi.org/10.3390/s23125680
[18] Wang, X., Ma, Y., Cammon, J., Fang, F., Gao, Y., Zhang, Y. (2023). Self-supervised EEG emotion recognition models based on CNN. IEEE Transactions on Neural Systems and Rehabilitation Engineering, 31: 1952-1962. https://doi.org/10.1109/TNSRE.2023.3263570
[19] Salankar, N., Mishra, P., Garg, L. (2021). Emotion recognition from EEG signals using empirical mode decomposition and second-order difference plot. Biomedical Signal Processing and Control, 65: 102389. https://doi.org/10.1016/j.bspc.2020.102389
[20] Xu, D., Qin, X., Dong, X., Cui, X. (2023). Emotion recognition of EEG signals based on variational mode decomposition and weighted cascade forest. Mathematical Biosciences and Engineering, 20: 2566-2587. https://doi.org/10.3934/mbe.2023120
[21] Al-Salman, W., Li, Y., Wen, P. (2019). Detecting sleep spindles in EEGs using wavelet fourier analysis and statistical features. Biomedical Signal Processing and Control, 48: 80-92. https://doi.org/10.1016/j.bspc.2018.10.004
[22] Dhiman, G., Garg, M., Nagar, A., Kumar, V., Dehghani, M. (2021). A novel algorithm for global optimization: Rat swarm optimizer. Journal of Ambient Intelligence and Humanized Computing, 12: 8457-8482. https://doi.org/10.1007/s12652-020-02580-0
[23] Wang, Z. (2020). Text emotion detection based on Bi-LSTM network. Academic Journal of Computing & Information Science, 3(3): 129-137. https://doi.org/10.25236/AJCIS.2020.030314
[24] Tripathi, A., Choudhury, T. (2023). EEG based emotion recognition using long short term memory network with improved Rat Swarm Optimization Algorithm. Revue d'Intelligence Artificielle, 37(2): 281-289. https://doi.org/10.18280/ria.370205