Egia Rosi Subhiyakto![]() | Sindhu Rakasiwi*
| Sindhu Rakasiwi*![]() | Junta Zeniarja
| Junta Zeniarja![]() | Cinantya Paramita
| Cinantya Paramita![]() | Guruh Fajar Shidik
| Guruh Fajar Shidik![]() | Zainal Arifin Hasibuan
| Zainal Arifin Hasibuan![]() | Marijana Geets Kesić
| Marijana Geets Kesić![]()
© 2024 The authors. This article is published by IIETA and is licensed under the CC BY 4.0 license (http://creativecommons.org/licenses/by/4.0/).
OPEN ACCESS
This study investigates the efficacy of resampling techniques in ECG classification, addressing the challenge of data imbalance in heartbeat classification. Utilizing the PTB Diagnostic ECG database, the research focuses on the application of various Synthetic Minority Over-sampling Technique (SMOTE) variations, including SMOTE Borderline, ADASYN, Tomek, and ENN, alongside three algorithms: CNN, Transformer, and LSTM. The dataset, encompassing 549 patient records from 290 subjects, was bifurcated into training and testing segments, classifying heartbeats into normal and abnormal categories. The novelty of this work lies in its combined deep-structured learning model that integrates CNN, Transformer, and LSTM, further enhanced by an ensemble of these algorithms with original SMOTE and its variants for dataset balancing. The research revealed that the proposed method significantly ameliorates the classification of heartbeats, effectively addressing the class imbalance issue prevalent in ECG data. The results demonstrated that the transformer network, in particular, excelled in recognizing temporal continuities and extracting deep-seated features from ECG signals, thereby enhancing the model's performance beyond the capabilities of basic models. Key results indicate that CNN+SMOTE Borderline achieves the highest testing accuracy at 99.36%, while CNN+SMOTE Tomek leads in precision with 99.89%. Transformers excel in recall with a perfect score of 100%. The research concludes that CNNs effectively distinguish normal from abnormal heartbeats, with the highest accuracy using CNN+SMOTE at 99.06%. However, the study also acknowledges limitations, such as the dataset's restricted scope, and suggests further research with a more diverse dataset. Overall, the study demonstrates the effectiveness of CNN in ECG arrhythmia classification, offering a foundation for more advanced automatic diagnostic systems in cardiology.
electrocardiogram (ECG), classification, PTB dataset, CNN, transformer, LSTM, SMOTE
Electrocardiograms (ECGs) play a pivotal role in modern healthcare, serving as a valuable non-invasive tool for clinicians and cardiology specialists. These graphical representations of the heart's electrical activity are widely used for monitoring heart function and diagnosing various cardiac conditions, which range from critical to non-critical. Given that cardiovascular diseases claim a significant portion of global deaths, the ECG stands out as a standard and effective technique in hospitals for detecting irregular cardiac rhythms. ECGs emerge as essential in identifying issues such as atrial fibrillation (AF) by reflecting the heart's electrical activity. The significance of this approach lies in the early diagnosis of arrhythmias, enabling timely and appropriate treatment. The long-term monitoring of cardiac electrical activity becomes imperative for the early detection of transient or uncommon arrhythmias.
Millions of people worldwide are affected by cardiovascular diseases, which contribute to 30% of global deaths. Cardiac arrest, often resulting from heart arrhythmia, is a major concern [1]. The irregular pulse associated with arrhythmias necessitates regular monitoring to identify potentially life-threatening situations. The ECG considered the gold standard, employs electrodes on the skin to detect changes in the heart's electrical potential during its contraction and relaxation stages.
The most commonly used solution for detecting arrhythmias is through recordings from an ECG device. This device displays the heart's electrical activity based on electrodes placed on the skin [2], and has become one of the most important tools in diagnosing heart disease [3]. However, various factors such as basic signal aberrations, external signal interference, and individual physical differences [4], can cause problems in classifying heart rate with ECG. Even in healthy individuals, differences in rhythm and morphology of the heart rate can be detected under certain circumstances [5]. There is a significant class imbalance problem in ECG heart rate classification data, often caused by a limited number of rare classes. This imbalance can lead to a tendency for classifiers to select the majority class [6].
Various techniques are being employed to tackle the issue of class imbalance in ECG arrhythmia classification. Acharya et al. [7] employed a data-level approach by creating synthetic samples, thereby equalizing the dataset. This was achieved by altering the average Z-scores and standard deviations derived from the normalized original ECG signal. Rajesh and Dhuli [8] investigated various data-level strategies to address unbalanced ECG data, including random oversampling, random undersampling, SMOTE, and distribution-based sampling. Sellami and Hwang [9] introduced an algorithmic approach by adjusting the weights in loss functions for each class proportionally to their sample counts in each batch, aiming to rectify class imbalances. This study introduces a model for arrhythmia classification in ECG that utilizes the Convolutional Neural Network (CNN) for feature extraction and ensemble methods to address the issue of imbalanced data. Meanwhile, Kudithipudi et al. [10] focused on assessing the effectiveness of a hybrid resampling model that includes techniques like SMOTE, RUS, RUS+ROS, and RUS+SMOTE.
Originally gaining popularity in natural language processing (NLP) [11], Transformers utilize attention mechanisms to detect long-term connections and uncover hidden information. With these capabilities, Transformers are well-suited for analyzing intricate patterns and relationships in time sequence data, thereby aiding in the identification and classification of arrhythmias in ECG data [12]. Che et al. [13] developed an ensemble method combining CNN and Transformer to extract temporal information from ECG signals. The experimental results demonstrated that this model achieved superior performance compared to the majority of basic standalone models. Furthermore, the results indicated that the Transformer network more effectively focuses on the temporal continuity of the data and adeptly captures its deep hidden features. The constraints within the model's architecture can enhance feature selection and effectively reduce the impact of data imbalance on the results. This model holds the potential to significantly assist cardiologists in diagnosing heart disease, thereby enhancing the overall efficiency of healthcare delivery.
Resampling techniques provide a viable approach to address this issue by modifying the class ratio to achieve a balanced dataset. When combined with classification methods, these resampling strategies can significantly enhance the efficiency of ECG classification. Consequently, investigating and refining these methods is the primary focus of this research.
This study aims to explore the effects of different resampling methods on ECG Classification, with a particular focus on, but not restricted to, the Synthetic Minority Over-sampling Technique (SMOTE). To overcome data imbalance, we use the original SMOTE and several SMOTE variations, namely SMOTE Borderline, SMOTE ADASYN, SMOTE Tomek, and SMOTE ENN. For the three algorithms (CNN, Transformer, and LSTM), we apply various types of SMOTE. The dataset used is the PTB Dataset, divided into two parts: training data and testing data. In this study, we aim to balance the classes in the existing PTBDB dataset, grouping them into two categories: normal and abnormal. The abnormal class includes all classes that deviate from a normal heart rate [14].
The main contributions of this paper can be listed as follows:
Diagnosis and management of cardiovascular diseases in modern healthcare often involve ECG analysis and classification. Meeting the challenges in manual ECG interpretation requires intensive training and extensive expertise. The slow and time-intensive nature of this process increases the risk of diagnostic inaccuracies. Additionally, interpretative variations among observers can lead to further complications. Consequently, there is a pressing need for reliable automated ECG analysis methods to overcome these challenges. The utilization of sophisticated algorithms and models holds the potential to not only improve diagnostic accuracy but also quickly detect abnormalities, guide treatment decisions, and positively impact patient outcomes.
Recent studies have concentrated on using neural networks for ECG feature extraction and classification. Research showcasing various ECG signal techniques in healthcare is proposed by Anbalagan et al. [15]. Both conventional and machine learning strategies have been employed by numerous researchers for detecting heart diseases through ECG signal analysis. The efficacy of these methods hinges on the precise identification of ECG signal elements like P-, Q-, R-, S-, T-waveforms, QRS complex duration, R-peak, PR interval, and RR interval. These methods can also identify links between heart conditions and other body organs, such as the retina and brain, by analyzing ECGs, fundus images of the eye, and brain MRI scans. A comprehensive review of various ECG data and computational methods in applications such as morphological and rhythmic arrhythmia detection, signal quality evaluation, biometric recognition, respiratory rate determination, fetal ECG extraction, and monitoring physical and emotional states is presented in the study by Merdjanovska and Rashkovska [3]. In the study of Kunwar and Choudhary [16], the discussion focuses on using ECG features for stroke diagnosis, introducing a stacked ensemble model combining three 1-dimensional CNN sub-models with a dense neural network (meta-learner) on top. This model is designed to classify stroke patients using ECG data with high precision, thereby reducing the time and expenses associated with gathering physiological information such as blood pressure, oxygen saturation, heart rate, medical history, and lifestyle factors like alcohol or tobacco use. The model, trained and tested with raw ECG signals, demonstrates a 99.7% accuracy rate in predicting strokes.
The topic of ECG arrhythmia classification has been extensively explored, primarily focusing on categorizing arrhythmias into four types: Normal (N), Supraventricular Ectopic (S), Ventricular Ectopic (V), and Fusion (F) beats. In this area, one approach utilizes a Deep Neural Network with data from the MIT-BIH Arrhythmia database. Essa and Xie [17] developed a bagging model combining CNN-LSTM and RRHOS-LSTM, achieving an overall accuracy of 95.81%. For the classification of ECG beats, Liu et al. [18] introduced the wavelet scattering transform method, effectively categorizing the four types of arrhythmias. They analyzed ECG heartbeats through 8 time windows, finding that the fourth window, used with KNN, yielded the highest accuracy at 99.3%. Research has also extended to a 5-class classification of arrhythmias. Seitanidis et al. [19] employed a 2D-Convolutional Neural Network (CNN) with the MIT-BIH arrhythmia database, classifying five types of arrhythmias (N, S, V, F, Q) with 95.3% accuracy. Jing et al. [20] demonstrated ECG heartbeat classification using an enhanced CNN+ResNet-18 model, reaching 96.5% accuracy with the MIT-BIH dataset. Elmir et al. [21] introduced a method that transforms 1D time-frequency vectors into 2D images using the Gramian Angular Field transform, achieving a 97.47% accuracy rate. Bhattacharyya et al. [22] implemented an ensemble of Random Forest and SVM algorithms for classifying arrhythmic heartbeats, attaining a 98.21% accuracy. Additionally, Rahman et al. [23] utilized the transfer learning method AlexNet for ECG arrhythmia classification, recording a 98.38% accuracy.
In the context of deep learning, the use of transformer models for classification and detection based on ECG images has been explored by several researchers. Zhou et al. [24] proposed a masked transformer method for ECG classification, using the Fuwai, PTB-XL, and PCinC datasets. They evaluated the prediction performance of their method on both private and public ECG datasets, with F1 scores for the Fuwai dataset at 76.5%, PTB-XL at 58.6%, and PCinC at 66.2%. Kilimci et al. [25] present heart disease detection using cutting-edge technologies called vision transformer models. The study employed three distinct vision transformers, namely Google-Vit, Swin, and BEiT. The results obtained accuracy of Google-Wit at 94.3%, Swin at 95.5%, and BeiT at 95.9%. On the other hand, Jayanthi and Devi [26] propose a unique ensemble deep structured learning model that integrates attention mechanisms, CNN, and Bi-LSTM, achieving 99% accuracy.
Each classification system requires a unique process and methodology. Figure 1 illustrates the structure and essential stages of the proposed approach for classifying the two heartbeat classes. The procedures were carried out using Python on a computer with NVIDIA Tesla T4 GPU with 16GB of VRAM.
Figure 1. The proposed method
3.1 Experiment setup
To conduct our training, we leverage Google Colab Pro, equipped with a single NVIDIA P100/T4 GPU with a capacity of up to 15GB and RAM reaching 8GB. The pre-trained language models utilized encompass basic models of CNN, Transformer, and LSTM. Furthermore, we apply five SMOTE models for the dataset imbalance process, namely SMOTE Original, SMOTE ADASYN, SMOTE Tomek, SMOTE Borderline, and SMOTE ENN.
3.2 Data collection
The Physikalisch Technische Bundesanstalt (PTB) Diagnostic ECG database was employed in this research to assess its efficacy as an openly accessible ECG database [27]. The dataset comprises 549 record sourced from 290 subject, with ages ranging from 17 to 87 and a mean age of 57.2. The participants, 209 were male with a mean age of 55.5, and 81 were female with a mean age of 61.6. Ages were not documented for one female and 14 male subjects.
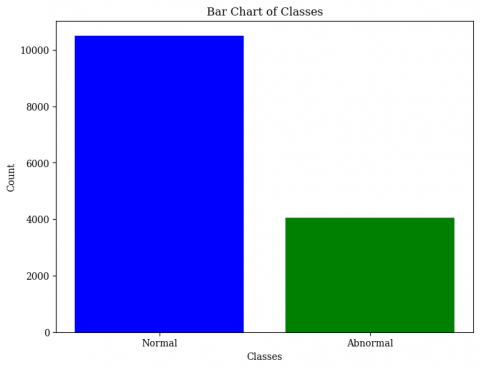
In Figure 2, it can be seen that there are 2 types of arrhythmia, namely normal and abnormal. The total data distribution consists of 4045 normal data and 10505 abnormal data as seen in Figure 3, so there is an imbalanced amount of data.
3.3 Pre-processing
Electrocardiogram (ECG) recordings typically suffer from various types of noise, both low- and high-frequency, including baseline Wander (BW), power line interference, electromyography (EMG) noise, and electrode motion artefact noise. A variety of filters are available to eliminate these noises. Specifically, Baseline Wander (BW), a low-frequency artefact in ECG recordings, is primarily caused by the subject's activities, such as breathing and physical movement. In this investigation, a median filter with a width of 200 ms and 600 ms was utilised [2]. This was done in accordance with the findings of earlier research. In the realm of digital filtering, the median filter is a non-linear approach that is employed to eliminate noise in signals and images while still keeping the important aspects of the signal or image. Following that, every recording was normalised to the amplitude range of [-1, +1 respectively].
3.4 Data segmentation
The segmentation process of ECG recordings is essential for standardizing the data length before it is input into the model. Given a sampling rate of 128Hz and an average cardiac cycle lasting 0.8 seconds, segments of 500 samples (equivalent to 3.9 seconds) are deemed suitable, as most arrhythmias are detectable within this duration. This segmentation is conducted in an overlapping fashion, where the window slides across the recordings to create segments. Following segmentation, all ECG segments from both databases are amalgamated. However, segments pertaining to normal and atrial fibrillation classes were disproportionately large. To mitigate the effects of this imbalance, evaluation metrics during training and testing phases were adjusted to be inversely proportional to the size of each class.
Figure 2. Types of arrhythmia normal and abnormal
Figure 3. Imbalanced data distribution
3.5 Resampling techniques
To handle data imbalance problems, we propose using 5 types of SMOTE techniques, namely SMOTE Original, BorderLine-SMOTE, ADASYN, SMOTE-Tomek and SMOTE-ENN.
3.5.1 SMOTE (Synthetic minority oversampling)
Oversampling continuous data for machine learning issues is a typical use of SMOTE, which involves the creation of false or synthetic data. Continuous data are being utilized by us because the model that is being used to build the sample is only able to accommodate continuous data. By adding a minority class that is not reproduced, the SMOTE method generates fictional data that is based on the similarities in feature space that exist between existing minority classes. The introduction of the new instances serves to effectively shift the learner's bias, causing them to adopt a more general bias, but primarily for the class that is considered to be inside the minority. The k-nearest neighbor algorithm is used to calculate the new minority instances, which are then extrapolated and formed from the existing minority class imbalances.
The quantity of over sampling that is necessary is used to determine the random selection of the neighbors from the k-NN. A more equitable distribution of classes is achieved through the incorporation of these instances of the minority class that were formed synthetically. It has been observed that although SMOTE appears to function effectively with low-dimensional data, its efficiency in the case of high-dimensional data is less striking. This is something that has been considered. This is because SMOTE is unable to handle the bias in the majority class for the classifier when the data is high dimensional. This is the reason why this is the case. Another disadvantage of the SMOTE algorithm is that it tends to generalize the minority class space to an excessive degree. When it comes to oversampling approaches, SMOTE has been utilized in a manner that is comparable to that of the Random Oversampling method.
3.5.2 Borderline-SMOTE
Both Borderline-SMOTE1 and Borderline-SMOTE2 are extensions of the Borderline-SMOTE approach, which, as its name suggests, is derived from the SMOTE technique. However, the approach merely over-samples the minority examples that are located close to the borderline and their closest neighbors who are also members of the same class. Both the positive closest neighbors and the negative nearest neighbors are utilized by borderline-SMOTE2, which is the primary distinction between the two versions.
Borderline-SMOTE is a variation of conventional SMOTE that does not generate synthetic examples for noisy instances. Instead, it focuses its efforts near the borderline, which in turn assists the decision function in developing more effective boundaries between classes. Additionally, it has been observed that borderline-SMOTE performs better than SMOTE in terms of performance.
3.5.3 ADASYN (Adaptive synthetic sampling)
A weighted distribution is utilized by ADASYN sampling for the purpose of determining the level of difficulty of learning for various minority class instances. Although ADASYN is similarly based on SMOTE, in contrast to borderline-SMOTE, ADASYN generates various synthetic samples for the minority class based on its distribution. This is in contrast to borderline-SMOTE, which only accounts for borderline situations. To add insult to injury, SMOTE ensures that every minority instance has an equal opportunity to be chosen, whereas in ADASYN, the selection procedure is determined by the distribution of minority classes.
Utilizing the k-nearest neighbor technique, the synthetic samples are generated by utilizing the majority of the nearest neighbors. As a result of the fact that this method does not identify noisy cases, it leaves the dataset open to the possibility of having values that are considered to be outliers. The results of previous studies have shown that there is an improvement in accuracy for both the majority class and the minority class, and this development does not make one class more accurate than another.
3.5.4 SMOTE-TOMEK
The SMOTE-Tomek algorithm is a hybrid that combines the SMOTE algorithm with the undersampling Tomek link. Tomek link is a method for cleaning data that can be used to eliminate the majority class that was overlapping with the minority class.
3.5.5 SMOTE-ENN (Edited nearest neighbour)
The SMOTE-ENN is a hybrid that mixes oversampling and undersampling, just like the SMOTE-Tomek combination. While the SMOTE was responsible for the oversampling, the ENN was in charge of the undersampling. Within the original dataset as well as the sample result dataset, the Edited Nearest Neighbour is a method that may be utilized to eliminate majority class samples in cases where the nearest class minority samples incorrectly classify it. It will eliminate the majority class that was incorrectly classified near to the border; this will take place.
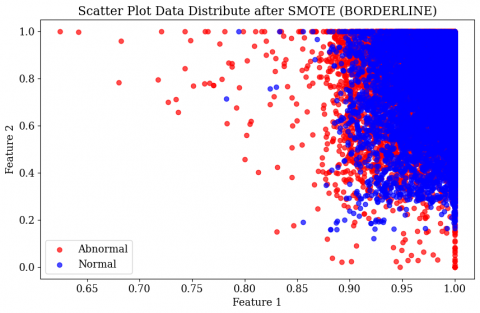
Figure 4. Scatter plot of the original and various SMOTE variants
SMOTE Original involves selecting minority samples, determining their nearest neighbors, and creating new data points between these samples and their neighbors. SMOTE Tomek uses interpolation to estimate values between two or more data points to generate synthetic samples. SMOTE Borderline focuses on minority and majority samples close to the decision boundary to create new data points. SMOTE Adaptive Synthetic Sampling (ADASYN) identifies minority samples that are difficult to classify correctly, assigns weights to these samples, and generates synthetic samples around these challenging cases to improve classification. Finally, SMOTE Edited Nearest Neighbors (ENN) first applies standard SMOTE, followed by ENN, which cleans the dataset by removing samples that might cause misclassification, specifically deleting majority data points if their neighbors have different class labels. From the provided scatter plot in Figure 4, it can be seen how the distribution of data resulting from synthetic sampling varies based on different SMOTE approaches. These differences in data distribution occur because the methods used by various types of SMOTE differ in how they create synthetic samples.
3.6 Classification
In this research, we used 3 deep learning classification models, including CNN (Convolutional Neural Network), LSTM (Long Short-Term Memory) and Transformer.
3.6.1 Convolutional neural network (CNN)
Many applications rely on Convolutional Neural Networks (CNNs) for signal processing, picture identification, pixel data, and NLP. By employing stacked trainable tiny filters known as kernels, they excel at recognizing spatial hierarchies or patterns. In order to diagnose arrhythmias, these kernels may successfully extract local information from the context of electrocardiogram (ECG) data, such as the duration and shape of chestbeats. Whereas 2D CNNs handle ECG data in pictures or other two-dimensional formats, 1D CNNs use kernels in the time dimension when dealing with raw ECG data. Some examples of such transformations are beat-to-beat correlations, gray-level co-occurrence matrices, and distance distribution matrices obtained from entropy calculations. A better method of detecting arrhythmias in ECG readings is to use convolutional neural networks (CNNs), which can learn and extract useful features automatically from raw ECG signals. Computer network algorithms (CNNs) are able to distinguish between healthy and unhealthy cardiac rhythms by identifying unique wave patterns. Nevertheless, CNNs may struggle to handle long sequences due to their restricted receptive field size. Hence, they risk missing out on important information on long-term dependencies that is necessary for deciphering ECG signals.
3.6.2 Long short-term memory (LSTM)
The Long Short-Term Memory Network (LSTM), a specialized variant of Recurrent Neural Networks (RNNs), is particularly adept at processing sequential data. One of its key characteristics is its remarkable ability to retain information over extended periods. LSTMs are distinctively equipped with memory cells for data storage, complemented by gates that regulate the flow of data into and out of these cells. These gates are instrumental in greatly facilitating the handling of ECG data, which often features critical information over long time frames, thus enabling LSTMs to effectively learn and recall longer sequences. In contrast to standard RNNs, which often encounter the vanishing gradient problem, the specialized features of LSTMs effectively help mitigate this issue. Since ECG signals are examples of temporal data sequences, this property of LSTMs makes them ideal for applications requiring learning from such sequences. In order to train an LSTM to identify and classify arrhythmias, it is necessary to first transform the ECG signal into sequential data segments. In each section, you can see a time series of recorded electrical heart activities.
In order to learn and simulate the interdependencies between these heartbeats, the LSTM is fed time-series data consisting of sequential cardiac cycles. An important tool for automated identification of ECG cardiac arrhythmias, the LSTM can identify and classify arrhythmia patterns based on this learned information. Despite possessing more advanced features, LSTMs incur higher computing costs compared to simpler models such as RNNs or MLPs. Particularly when dealing with large ECG datasets, it can be difficult to satisfy this higher processing demand. Arrhythmias can be more accurately and efficiently identified and categorized with LSTMs than with traditional methods because of their exceptional ability to learn from sequential data.
3.6.3 Transformer
Transformers are a powerful architecture for deep learning models that were initially introduced for use in NLP but have subsequently demonstrated potential in other domains as well. They use self-attention techniques to better grasp contextual information and long-term dependencies. When it comes to electrocardiogram (ECG) data, transformers with attention mechanisms can learn intricate patterns and relationships within time-series data, allowing them to detect and classify arrhythmias. The transformer model learns to decipher ECG signals by treating them as a series of data points, allowing it to react to important parts of the signal and capture relationships in time. This quality enables the model to simultaneously evaluate regional and worldwide trends. Because they demand a lot of processing and could require different hyperparameters, such as attention heads and model sizes, to change, transformers aren't as user-friendly as other models. The transformer model improves the detection and classification of cardiac arrhythmias by making advantage of its capacity to analyze and comprehend sequential data.
The analysis compares the performance metrics of CNN, Transformer, and LSTM classifiers, using the PTBDB dataset, which has an imbalanced class distribution. This imbalance makes accuracy an inadequate sole measure for evaluating the best learning algorithm since it might only reflect the correct classification of the predominant class while misclassifying rarer ones. Hence, assessing precision, recall, and accuracy collectively is more effective for evaluating sampling techniques.
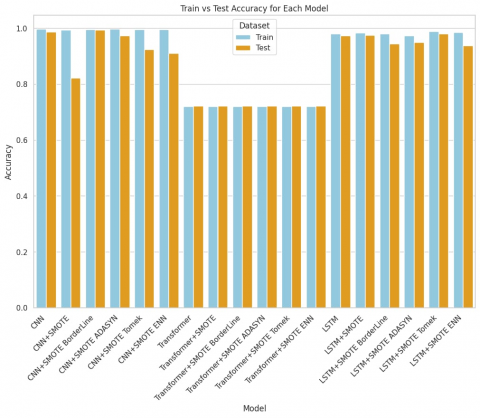
Key findings from Table 1 and Figure 5 show that CNN+SMOTE Borderline tops the list in terms of testing accuracy, achieving 99.36%, closely followed by the standard CNN with 98.74%. CNN and CNN+SMOTE ADASYN have almost identical training accuracies at 99.67%. Table 1 reveal that CNN+SMOTE Tomek leads in precision with a remarkable 99.89%, and LSTM+SMOTE Borderline trails closely at 99.49%, comparable to CNN+SMOTE Borderline and LSTM+SMOTE Original. Regarding recall, Transformers, whether combined with any SMOTE variant or not, outperform other methods with a perfect score of 100%. CNN+SMOTE ADASYN follows closely, with a slight difference of 0.0013, resulting in 99.87%.
Based on Table 1, which shows the accuracy results for training with three models-CNN, Transformer, and LSTM-the average accuracy for the CNN model is 99.58%, for the Transformer model is 71.96%, and for the LSTM model is 98.19%. Thus, it can be concluded that the average performance of the CNN model combined with various SMOTE variants is significantly better compared to the other models.
Figure 6 clearly demonstrates that among the algorithms, LSTM has the shortest training time. However, when it comes to testing time, several models exhibit comparable times of 0.6850 seconds. These include CNN+SMOTE Original, CNN+SMOTE Borderline, CNN+SMOTE ADASYN, CNN+SMOTE ENN, Transformer+SMOTE, Transformer+SMOTE Borderline, Transformer+SMOTE Tomek, and Transformer+SMOTE ENN. While the SMOTE technique enhances the efficacy of fundamental classifiers like CNN, Transformer, and LSTM, it requires substantial training time. This is primarily due to the creation of synthetic samples for the minority classes, which significantly adds to the total computational time.
(PTBDB dataset)
|
Model |
Training_Acc |
Testing_Acc |
Pre |
Rec |
Loss |
Training-Time (s) |
Testing-Time (s) |
|
CNN |
99.67 |
98.74 |
99.00 |
99.00 |
5.54 |
324.4847 |
0.8220 |
|
CNN+SMOTE |
99.44 |
82.18 |
97.00 |
77.00 |
18.37 |
323.8969 |
0.6850 |
|
CNN+SMOTE BorderLine |
99.52 |
99.36 |
99.46 |
99.56 |
2.38 |
324.4254 |
0.6850 |
|
CNN+SMOTE ADASYN |
99.67 |
97.41 |
96.65 |
99.87 |
9.62 |
323.9536 |
0.6850 |
|
CNN+SMOTE Tomek |
99.61 |
92.44 |
99.89 |
89.63 |
27.88 |
323.8904 |
0.8220 |
|
CNN+SMOTE ENN |
99.55 |
91.00 |
96.00 |
92.00 |
31.51 |
304.1692 |
0.6850 |
|
Transformer |
71.96 |
72.19 |
72.19 |
100 |
56.52 |
384.7857 |
0.8220 |
|
Transformer+SMOTE |
71.96 |
72.19 |
72.19 |
100 |
56.41 |
308.7765 |
0.6850 |
|
Transformer+ SMOTE BorderLine |
71.96 |
72.19 |
72.19 |
100 |
56.31 |
327.0823 |
0.6850 |
|
Transformer+ SMOTE ADASYN |
71.96 |
72.19 |
72.19 |
100 |
56.46 |
384.5038 |
0.9590 |
|
Transformer+ SMOTE Tomek |
71.96 |
72.19 |
72.19 |
100 |
57.09 |
384.0783 |
0.6850 |
|
Transformer+ SMOTE ENN |
71.96 |
72.19 |
72.19 |
100 |
56.71 |
326.3452 |
0.6850 |
|
LSTM |
98.09 |
97.32 |
98.65 |
97.62 |
8.67 |
136.7435 |
1.1830 |
|
LSTM+SMOTE |
98.33 |
97.42 |
99.46 |
96.95 |
7.29 |
295.1641 |
1.2740 |
|
LSTM+ SMOTE BorderLine |
97.96 |
94.47 |
99.49 |
92.81 |
17.04 |
202.925 |
1.2740 |
|
LSTM+ SMOTE ADASYN |
97.30 |
95.02 |
99.24 |
93.81 |
13.99 |
255,304 |
1.4560 |
|
LSTM+ SMOTE Tomek |
98.87 |
97.94 |
99.42 |
97.72 |
7.03 |
322.0792 |
1.3650 |
|
LSTM+ SMOTE ENN |
98.59 |
93.75 |
97.43 |
93.81 |
21.64 |
230.6548 |
1.5470 |
Figure 5. Various resampling techniques' training and testing accuracy
Figure 6. Impact of varying resampling models on computational time
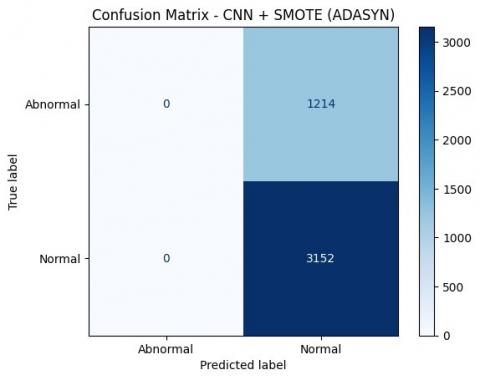
Figure 7. Confusion matrix of PTBDB dataset
Figure 7 shown the values of true negative (TN) and false negative (FN) are 0, this can provide some insights about the classification model and the data used. If TN=0, it means there are no negative cases correctly predicted as negative by the model; all negative cases are predicted as positive (false positive). This can indicate that the model is highly biased towards the positive class, the data used may be imbalanced with very few or no negative cases, or the model might be overfitting or underfitting. If FN=0, it means there are no positive cases actually predicted as negative by the model; all positive cases are correctly predicted (true positive). This can suggest that the model is very effective at detecting positive cases, the data used may have very clear and easily recognizable patterns for the positive class, or the model has high sensitivity. If both TN and FN are 0, this implies that the model predicts all cases as positive without any negative predictions, indicating a complete bias towards the positive class and an inability to recognize or predict negative cases. In a confusion matrix with TN=0 and FN=0, the matrix would show predictions as follows: for positive cases, true positive (TP) and no predicted negatives (0); for negative cases, false positive (FP) and no predicted negatives (0). The implications are that accuracy might still be high if the number of positive cases (TP+FN) is much higher than the number of negative cases (TN+FP), precision will depend on the ratio of TP to TP+FP, and recall will be very high (1 or 100%) because FN=0, meaning all positive cases are correctly predicted. This condition usually indicates that the model is imbalanced and may not be well optimized. It is important to re-evaluate the data used, the class balance, and the model training techniques to ensure more accurate and reliable performance.
The goal of this experimental study is to investigate different resampling techniques to address the issue of class imbalance in ECG Classification using the PTBDB dataset. The study found that CNN effectively distinguishes between normal and abnormal heartbeats, such as those with arrhythmias or other rhythm disorders, outperforming traditional classification methods. The highest accuracy, 99.36%, was achieved on the PTBDB dataset using CNN combined with SMOTE Borderline. This technology allows electrocardiogram signals to be interpreted more efficiently and accurately by medical professionals. However, the research also identified several limitations. One significant limitation is that it only involves a limited dataset in the category of certain abnormal heartbeats. Consequently, the application of CNN for heart rate classification needs further development and validation with a broader and more diverse dataset. Overall, this study demonstrates that CNN is an effective and reliable tool for classifying heart rates using electrocardiogram signals. Looking ahead, this research can serve as a foundation for developing more complex automatic systems for detecting and diagnosing heart disease.
This research was funded by Dinus Research Group for AI in Medical Scinece (DREAMS) Universitas Dian Nuswantoro for research funding in 2023.
[1] Wang, J., Li, R., Li, R., Fu, B., Xiao, C., Chen, D.Z. (2020). Towards interpretable arrhythmia classification with human-machine collaborative knowledge representation. IEEE Transactions on Biomedical Engineering, 68(7): 2098-2109. https://doi.org/10.1109/TBME.2020.3024970
[2] Murat, F., Yildirim, O., Talo, M., Baloglu, U.B., Demir, Y., Acharya, U.R. (2020). Application of deep learning techniques for heartbeats detection using ECG signals-analysis and review. Computers in Biology and Medicine, 120: 103726. https://doi.org/10.1016/j.compbiomed.2020.103726
[3] Merdjanovska, E., Rashkovska, A. (2022). Comprehensive survey of computational ECG analysis: Databases, methods and applications. Expert Systems with Applications, 203: 117206. https://doi.org/10.1016/j.eswa.2022.117206
[4] Liao, Y., Xiang, Y., Du, D. (2020). Automatic classification of heartbeats using ECG signals via higher order hidden Markov model. In 2020 IEEE 16th International Conference on Automation Science and Engineering (CASE), Hong Kong, China, pp. 69-74. https://doi.org/10.1109/CASE48305.2020.9216956
[5] Kumari, C.U., Ankita, R., Pavani, T., Vignesh, N.A., Varma, N.T., Manzar, M.A., Reethika, A. (2020). Heart rhythm abnormality detection and classification using machine learning technique. In 2020 4th International Conference on Trends in Electronics and Informatics (ICOEI)(48184), Tirunelveli, India, pp. 580-584. https://doi.org/10.1109/ICOEI48184.2020.9142914
[6] Wang, T., Lu, C., Yang, M., Hong, F., Liu, C. (2020). A hybrid method for heartbeat classification via convolutional neural networks, multilayer perceptrons and focal loss. PeerJ Computer Science, 6: e324. http://dx.doi.org/10.7717/peerj-cs.324
[7] Acharya, U.R., Oh, S.L., Hagiwara, Y., Tan, J.H., Adam, M., Gertych, A., San Tan, R. (2017). A deep convolutional neural network model to classify heartbeats. Computers in Biology and Medicine, 89: 389-396. https://doi.org/10.1016/j.compbiomed.2017.08.022
[8] Rajesh, K.N., Dhuli, R. (2018). Classification of imbalanced ECG beats using re-sampling techniques and AdaBoost ensemble classifier. Biomedical Signal Processing and Control, 41: 242-254. https://doi.org/10.1016/j.bspc.2017.12.004
[9] Sellami, A., Hwang, H. (2019). A robust deep convolutional neural network with batch-weighted loss for heartbeat classification. Expert Systems with Applications, 122: 75-84. https://doi.org/10.1016/j.eswa.2018.12.037
[10] Kudithipudi, S., Narisetty, N., Kancherla, G.R., Bobba, B. (2023). Evaluating the efficacy of resampling techniques in addressing class imbalance for network intrusion detection systems using support vector machines. Ingénierie des Systèmes d’Information, 28(5): 1229-1236. https://doi.org/10.18280/isi.280511
[11] Moutik, O., Sekkat, H., Tigani, S., Chehri, A., Saadane, R., Tchakoucht, T.A., Paul, A. (2023). Convolutional neural networks or vision transformers: Who will win the race for action recognitions in visual data? Sensors, 23(2): 734. https://doi.org/10.3390/s23020734
[12] Ansari, Y., Mourad, O., Qaraqe, K., Serpedin, E. (2023). Deep learning for ECG Arrhythmia detection and classification: An overview of progress for period 2017-2023. Frontiers in Physiology, 14: 1246746. https://doi.org/10.3389/fphys.2023.1246746
[13] Che, C., Zhang, P., Zhu, M., Qu, Y., Jin, B. (2021). Constrained transformer network for ECG signal processing and arrhythmia classification. BMC Medical Informatics and Decision Making, 21(1): 184. https://doi.org/10.1186/s12911-021-01546-2
[14] Sowmya, S., Jose, D. (2022). Contemplate on ECG signals and classification of arrhythmia signals using CNN-LSTM deep learning model. Measurement: Sensors, 24: 100558. https://doi.org/10.1016/j.measen.2022.100558
[15] Anbalagan, T., Nath, M.K., Vijayalakshmi, D., Anbalagan, A. (2023). Analysis of various techniques for ECG signal in healthcare, past, present, and future. Biomedical Engineering Advances, 6: 100089. https://doi.org/10.1016/j.bea.2023.100089
[16] Kunwar, P., Choudhary, P. (2023). A stacked ensemble model for automatic stroke prediction using only raw electrocardiogram. Intelligent Systems with Applications, 17: 200165. https://doi.org/10.1016/j.iswa.2022.200165
[17] Essa, E., Xie, X. (2021). An ensemble of deep learning-based multi-model for ECG heartbeats arrhythmia classification. IEEE Access, 9: 103452-103464. https://doi.org/10.1109/ACCESS.2021.3098986
[18] Liu, Z., Yao, G., Zhang, Q., Zhang, J., Zeng, X. (2020). Wavelet scattering transform for ECG beat classification. Computational and Mathematical Methods in Medicine, 2020(1): 3215681. https://doi.org/10.1155/2020/3215681
[19] Seitanidis, P., Gialelis, J., Papaconstantinou, G., Moschovas, A. (2022). Identification of heart arrhythmias by utilizing a deep learning approach of the ECG signals on edge devices. Computers, 11(12): 176. https://doi.org/10.3390/computers11120176
[20] Jing, E., Zhang, H., Li, Z., Liu, Y., Ji, Z., Ganchev, I. (2021). ECG heartbeat classification based on an improved ResNet‐18 model. Computational and Mathematical Methods in Medicine, 2021(1): 6649970. https://doi.org/10.1155/2021/6649970
[21] Elmir, Y., Himeur, Y., Amira, A. (2023). ECG classification using deep CNN and Gramian angular field. In 2023 IEEE Ninth International Conference on Big Data Computing Service and Applications (BigDataService), Athens, Greece, pp. 137-141. https://doi.org/10.1109/BigDataService58306.2023.00026
[22] Bhattacharyya, S., Majumder, S., Debnath, P., Chanda, M. (2021). Arrhythmic heartbeat classification using ensemble of random forest and support vector machine algorithm. IEEE Transactions on Artificial Intelligence, 2(3): 260-268. https://doi.org/10.1109/TAI.2021.3083689
[23] Rahman, A.U., Asif, R.N., Sultan, K., Alsaif, S.A., Abbas, S., Khan, M.A., Mosavi, A. (2022). ECG classification for detecting ECG arrhythmia empowered with deep learning approaches. Computational Intelligence and Neuroscience, 2022(1): 6852845. https://doi.org/10.1155/2022/6852845
[24] Zhou, Y., Diao, X., Huo, Y., Liu, Y., Fan, X., Zhao, W. (2023). Masked transformer for electrocardiogram classification. arXiv Preprint arXiv: 2309.07136. https://doi.org/10.48550/arXiv.2309.07136
[25] Kilimci, Z.H., Yalcin, M., Kucukmanisa, A., Mishra, A.K. (2023). Heart disease detection using vision-based transformer models from ECG images. arXiv preprint arXiv: 2310.12630. https://doi.org/10.48550/arXiv.2310.12630
[26] Jayanthi S., Devi, S.P. (2023). Ensemble of deep learning models for classification of heart beats arrhythmias detection. Journal of Theoretical and Applied Information Technology, 101(8): 3175-3186. https://www.jatit.org/volumes/Vol101No8/31Vol101No8.pdf.
[27] Bousseljot, R., Kreiseler, D., Schnabel, A. (1995). Nutzung der EKG-Signaldatenbank CARDIODAT der PTB über das Internet. Biomedical Technology, 40(s1): 317-318. https://doi.org/10.1515/bmte.1995.40.s1.317