Aidil Fitriansyah*![]() | Alfirman
| Alfirman![]() | Riki Ario Nugroho
| Riki Ario Nugroho![]() | Sonya Meitarice | Sukamto
| Sonya Meitarice | Sukamto
© 2024 The authors. This article is published by IIETA and is licensed under the CC BY 4.0 license (http://creativecommons.org/licenses/by/4.0/).
OPEN ACCESS
Numerous individuals in Riau Province are engaged in the fish cultivation due to the province's ample water supply and the substantial market demand, which generates relatively high selling prices. The significance of water quality issues in fish aquaculture stems from the fact that fish inhabit water. Water quality is determined by a number of parameters, including acidity, temperature, turbidity, and the quantity of dissolved substances. Therefore, this study aimed to develop a device capable of monitoring water quality. The water parameters observed through the utilization of sensors and the Internet of Things were temperature, acidity, dissolved solids concentration, and turbidity. Utilizing the Rapid Application Development (RAD) Method, the research was completed through the following phases: Analysis, design, development, evaluation, implementation, and simulation. A device comprised of electronic components, including a microcontroller and sensors, was the result of this research. Monitoring parameter data was collected in real time via sensors and subsequently stored on a cloud server. The tools developed as a consequence of this research enable fish producers to acquire parameter data in real time. These tools serve the purpose of generating responses to normalize water quality and to facilitate action in response to changes in water quality.
cultivation, RAD method, sensors, water quality
In order to sustain a global population of 9.3 billion individuals by 2050, food production is projected to need to increase by 60%, according to the Food and Agriculture Organization (FAO). Climate change is exerting a discernible influence on the food production system, which consequently heightens the tremendous pressure to meet this augmented demand for food security. Climate change often causes problems for fish farmers in Riau Province, one of which is high rainfall which causes disturbances to water pH and causes fish mortality problems. Fish cultivation is presently an industry that possesses its own allure; therefore, it is unsurprising that fish cultivation sites can be found in virtually every region of Riau province. Fish cultivation can be conducted in a multitude of environments, including swamps, reservoirs, rivers, lakes, and ponds. The fish nursery cultivation activities conducted in Riau province in 2020 yielded a cumulative output of 99,154 tons. In contrast, seed cultivation yielded 427,098 in total [1]. Smart Aquaculture is a widely adopted alternative approach utilized by numerous individuals in an effort to enhance fish farming. Utilizing the Internet of Things (IoT), big data, controllers, sensors, applications, and artificial intelligence (AI), the smart aquaculture method is an intelligent production technique that can be operated autonomously or remotely from facility devices and controllers. Intelligent aquaculture incorporates information, technology, management, and instruments to oversee fish farming.
Restructuring the conventional fish aquaculture production system is one method of overcoming the pressure caused by production disruptions. An emerging alternative approach to address disruptions in fish cultivation production involves the implementation of clever fish cultivation techniques during the cultivation phase. Restructuring the conventional fish aquaculture production system is one method of overcoming the pressure caused by production disruptions. In order to surmount disturbances in fish cultivation production and forecasts, an alternative approach materialized: the implementation of intelligent fish cultivation [2]. Fish farming is conducted through the optimization of water supply through the monitoring of water temperature, pH levels, and temperature [3]. The integration of water level and fish food, which can be tracked in real-time [4, 5], yields data output in the form of visualization data that can be accessed on smartphones and computers [4, 6]. Additionally, there are individuals who supplement water quality indicators with dissolved oxygen state parameters in order to enable continuous monitoring [7, 8]. As supplementary indicators, parameters utilized in water quality assessment may incorporate Total Dissolved Solids (TDS) or dissolved solids in water [9]. The assessment of pond water quality through dissolved oxygen monitoring [10, 11] is essential due to the fact that water is the habitat of fish and must therefore be measured. Nevertheless, dissolved oxygen measurement tools and sensors remain relatively costly, rendering their implementation less practical.
The research proposes a water quality monitoring system for fish producers that operates in real time via a computer or smartphone, allowing for prompt action to be taken if the pond water quality deteriorates. A series of monitoring parameters—including water temperature, acidity, turbidity, and dissolved substance concentrations—are transmitted to the cloud server over a specified time period. Fish manufacturers have the ability to regulate the operation of water filters and the flow of pond water taps via the resultant system.
The entire water quality monitoring system for fish farmers was developed utilizing the Internet of Things and the RAD development method [12, 13] from the SDLC paradigm of software development. Development of RAD. The development process consists of six steps, as illustrated in Figure 1.
Figure 1. Development processes
2.1 Analysis process
Analyzing algorithms utilized in system development through a review of multiple scholarly works, as well as analyzing user requirements for the system under development and modeling it, constitutes the initial phase [14]. The analysis phase determined which parameters and components were utilized to construct internet of things-based water quality monitoring for salmon farmers, as well as identified the system's limitations.
2.2 Design process
The system development requirements are determined by the system design process, which specifies what must be designed. The development blueprint comprises multiple designs [13], including the hardware monitoring device design block [15], the overall system structure flowchart, the sensor data flowchart design, and the use case design. The utilization of readily available electronic components expedited the process of hardware design. Scalability must be compatible with the designed hardware in order to facilitate future development [16].
2.3 Development process
After the system analysis and design stage had been carried out, the next stage was the stage of developing a hardware prototype for sensor reading, monitoring, monitoring control and creating program code for operating controller devices, sending data, reading data on computers/smartphones. All development teams were involved in developing the system with each expert team carrying out its sub-blocks.
2.4 Evaluation process
All designs for making controller hardware, controller program code and monitoring application interface program code were created, then the next stage was the Evaluation. The evaluation stage was carried out using black box testing [17]. Testing was carried out using criteria that focus on certain tests of something fundamental to the success of a water quality monitoring system for fish farmers [18]. There were six questions regarding functional system requirements to find out whether the input met the functional system or vice versa.
2.5 Implementation process
After all the devices were created starting from the controller, sensors, display/sensor output, relay system, and power supply as well as the program code embedded in the controller, the device was used.
2.6 Simulation
The implementation process was carried out, then the next step was to carry out simulations on each function of the system created, starting from determining the treatment of data objects taken, for example the amount of water, the number of fish, testing the power supply, internet connection, controller function and each function sensors [4] and monitoring applications then this stage needed to be carried out to ensure all functions can work as expected [19].
3.1 Analysis
In order to obtain several parameters for measuring the quality of pond water for fish farmers—namely water temperature, water acidity level, number of dissolved particles, and water turbidity level—an analysis process was conducted by perusing a variety of literature sources. In order to enable simultaneous operation of all sensors, water pump loads, water disposal, data display, and data transmission capabilities, they must be controlled by a controller with such capability. As the controller with the capability to transmit and receive data as well as establish an internet connection, NodeMCU was selected. This simplifies the process of system development because each of these functions is contained within a single component. NodeMCU ver 2.0 Controller, ds18d20 temperature sensor, DF Robot pH sensor, turbidity water turbidity level sensor, and dissolved solids (TDS) sensor are the primary components.
3.2 Design
The system development carried out is divided into several system blocks because it involves several different systems, then after each system block is built, each block is integrated.
3.2.1 The overall hardware structure block
The water quality monitoring component consists of various sensors, internet network connections, cloud servers and other electronic components. Before going any further in creating the system, it is necessary to have a block diagram design of the overall system so that later this system can be divided into sub-parts. If it has been divided into several parts, then create each sub-section. This activity is to make it easier to manufacture, repair and analyze each part. A clearer view of the block diagram of the system being built can be seen in Figure 2.
Figure 2. The overall hardware
The hardware block in its entirety comprises electronic devices that are employed to function the sensors utilized by the pool water quality monitoring utility. A temperature sensor [20], a pH sensor [10], a turbidity sensor [21, 22], and a TDS sensor [23] are the instruments utilized. The acquired sensor data is subsequently processed by the NodeMCU controller, which utilizes Internet media [24] and is based on System on chip (SoC) technology [25]. The controller includes an integrated WiFi system that enables data communication [26, 27] to a cloud server that acts as a data storage server. The results of the readings are stored on a cloud server, which is subsequently accessed via a personal computer or smartphone to perform the reading and monitoring tasks.
3.2.2 Monitoring hardware device design block
Assembly begins by creating an electronic circuit design for the hardware that will be used (Figure 3). This research tool uses sensors as input to read temperature, pH, water turbidity and TDS. Pins A0, D3, D4, D5 on the NodeMCU are used to retrieve analog data from the sensor. Then the other two digital pins are used to control the two devices remotely using a Personal Computer or Smartphone.
Figure 3. Monitoring hardware device design block
The devices utilized in this study consist of the following: a temperature sensor employing a DS18D20 to determine the temperature of pool water; a turbidity sensor incorporated into the design to gauge water turbidity; a pH sensor determining the acidity or alkalinity of pool water; and a TDS sensor quantifying the quantity of dissolved solids or particles in water. Additionally, relays are necessary to both activate and deactivate the device. The nodeMCU controller is operational across all hardware devices. The nodeMCU controller is quite compact and possesses components that are capable of establishing connections to an internet network.
3.2.3 System architecture diagrams
The overall architecture of water quality monitoring system for fish farmers using internet of things (IoT) is shown in Figure 4.
Figure 4. Architecture diagram system
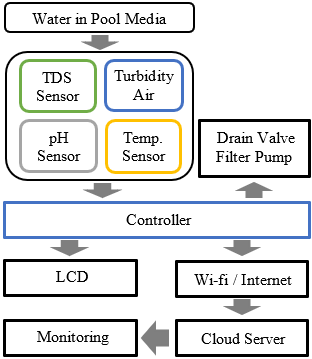
The water quality that will be read in this research is the water quality in fish column media with parameters that will be measured, namely water temperature using a temperature sensor, water acidity using a pH sensor, water turbidity level using a Turbidity sensor and how high particles or dissolved solids in the water using a TDS sensor. The data read by the sensor is analog (A0) and digital data (D3, D4, D5) which will then be processed by the controller (NodeMCU) to process the threshold value of each sensor Where if the status read is high (pH, TDS and Turbidity) then the controller will activate the filter pump. If the temperature status is read low (Temp. Sensor) then the Drain Valve is not active and the sensor data will also be displayed on the LCD in realtime. Data read from sensors within a certain period of time will automatically be stored on the cloud server by the controller, this process continues continuously. Data sensors stored on the cloud server can also be monitored or viewed in realtime from computer and smartphone devices. So far, the research carried out is how the sensor data used can be stored in real time. Local storage of sensor data automatically can also be done, but because the system being built wants to monitor automatically, in real-time and can be monitored remotely without having to look at the location, one of the right ways is to use a cloud server.
3.2.4 Sensor data flowchart design
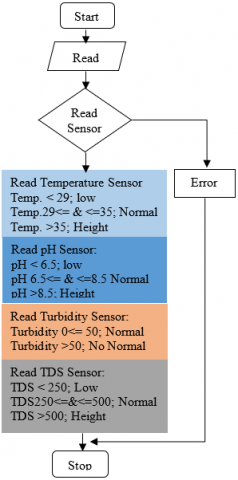
Sensors in processing the status that must be given to the monitoring system must first process the sensor data/values into a reading status value. To produce the reading status, the sensors will process the values/data by following the conditions in Figure 5.
Figure 5. Flowchart of sensor data and sensor status
3.3 Development
The prototype that was devised by professionals consists of two primary components: the software component and the hardware component (Figure 6). The water quality monitoring system is capable of transmitting data to a cloud server and can function continuously for specified time periods and twenty-four hours a day. In addition to the data transmitted to the prototype, a screen is present to exhibit the reading status of each sensor: low, normal, or height. Additionally, monitoring applications are developed so that devices can be monitored and controlled via mobile web applications. The program code intended for input into the controller was developed utilizing the PHP programming language and the Arduino IDE application to construct a mobile web application. The operational power of this system is derived from an electrical power source that is connected via a 12 Volt power supply. After being activated, this system will immediately begin searching for the identified SSID. The objective at hand is to locate an internet connection. In the absence of the specified SSID, operation of the system is not possible. This procedure is executed in an automated fashion in order to ascertain the availability of the internet connection.
Figure 6. Prototype of pond water quality monitoring hardware
The PHP and MySQL databases were utilized in the development of the monitoring application, which is accessible from a desktop computer, laptop, and mobile device. The constructed application is capable of monitoring water quality through the utilization of sensor data. Furthermore, the monitoring data can be visually presented on the LCD screen integrated into the system hardware. In addition to operating the pool water filter pump and pool discharge valve, the application can also do so.
3.4 Evaluation
The actual implementation process is carried out once a team of specialists has evaluated each block's performance according to eight success criteria for the water quality monitoring system for fish cultivation, based on observations and tests. During the evaluation phase, the following six criteria are considered: data transmission continuity, equipment durability, electricity consumption, data display speed, system usability, and reliability. The system was assessed and awarded 4.9 points for the following criteria: data transmission continuity (Table 1), equipment durability (4.7 points), electricity consumption (4.7 points), data display speed (4.8 points), ease of use (4.9 points), and reliability (4.9 points). Throughout the assessment of this system, feedback was acquired, specifically concerning data transmission. For instance, there were instances where the delivery of data was delayed by five minutes, where data delivery jumped, and where delivery time intervals were either ignored or left empty. In order to circumvent this issue, delay the reading of each sensor before transmitting all sensor data; this substantially reduces the interval between transmissions of null data.
Table 1. Sensor reading data table
|
No. |
Times |
Temp. |
TDS |
Turbidity |
pH |
|
1 |
2023-08-02T09:02:26 |
34.63 |
263 |
37.25 |
7.38 |
|
2 |
2023-08-02T09:07:41 |
33.06 |
281 |
36.42 |
7.28 |
|
3 |
2023-08-02T09:12:59 |
33.69 |
278 |
36.62 |
7.68 |
|
4 |
2023-08-02T09:17:14 |
32.50 |
334 |
36.38 |
6.97 |
|
5 |
2023-08-02T09:22:30 |
31.50 |
431 |
36.66 |
6.79 |
|
6 |
2023-08-02T09:27:46 |
30.56 |
302 |
36.57 |
6.68 |
|
7 |
2023-08-02T09:32:01 |
29.63 |
327 |
36.63 |
7.14 |
|
8 |
2023-08-02T09:37:17 |
30.94 |
362 |
36.64 |
7.29 |
|
9 |
2023-08-02T09:42:33 |
29.25 |
315 |
36.67 |
7.40 |
|
10 |
2023-08-02T09:47:49 |
29.75 |
390 |
36.66 |
7.50 |
|
11 |
2023-08-02T09:52:04 |
29.31 |
365 |
36.59 |
7.57 |
|
12 |
2023-08-02T09:57:20 |
29.06 |
391 |
36.59 |
7.64 |
|
13 |
2023-08-02T10:05:36 |
29.88 |
341 |
36.57 |
7.71 |
|
14 |
2023-08-02T10:10:52 |
29.88 |
357 |
36.73 |
7.75 |
|
15 |
2023-08-02T10:15:07 |
29.56 |
361 |
36.83 |
7.80 |
|
16 |
2023-08-02T10:20:23 |
29.31 |
395 |
36.84 |
7.84 |
|
17 |
2023-08-02T10:25:39 |
29.13 |
364 |
36.84 |
7.89 |
|
18 |
2023-08-02T10:30:54 |
29.81 |
312 |
36.71 |
7.91 |
3.5 Implementation
The pool water quality monitoring device that has been constructed is linked to an Access Point and the Internet; testing indicates that this connection is stable (Figure 7). Sensor data can be obtained from the monitoring tool's sensor values by comparing the previously measured values of each sensor with the corresponding measuring instruments. For instance, the digital pH meter tester can be utilized to compare the values of the pH sensor.
The cost required to make one monitoring tool is Rp. 785,800, - with an estimate that this tool can last 1 - 2 years (Table 2).
Figure 7. Pool water quality monitoring device
Table 2. Cost of the device prototype
|
No. |
Components |
Quantity |
Price (Rp.) |
Total Price (Rp.) |
|
1 |
NodeMCU v3 |
1 Piece |
74.000 |
74.000 |
|
2 |
pH sensor |
1 Piece |
275.000 |
275.000 |
|
3 |
TDS sensor |
1 Piece |
213.000 |
213.000 |
|
4 |
Turbidity Sensor |
1 Piece |
99.800 |
99.800 |
|
5 |
Temperature sensor DS18B20 |
1 Piece |
48.000 |
48.000 |
|
6 |
LCD (I2C 16X2 character |
1 Piece |
26.000 |
26.000 |
|
7 |
Power Supply |
1 Piece |
35.000 |
35.000 |
|
8 |
cable |
1 Piece |
8.000 |
8.000 |
|
9 |
Box Module |
1 Set |
7.000 |
7.000 |
|
|
Total |
|
|
785.800 |
3.6 Simulation
The experimental setting involved the use of a pond water quality monitoring instrument in a fish cultivation medium containing 220 liters of water. However, for the 50 tilapia (Oreochromis Niloticus) fish seeds measuring 5-7 cm in length, only 150 liters of water were required. The media used for cultivation contains a water filter. The fish food provided adheres to the Feed Conversion Ratio calculation, incorporating three distinct feed quantities. It is administered twice daily, and the simulation spans a duration of three months. The outcomes of the simulation demonstrate that this instrument is capable of delivering real-time data pertaining to water quality measurement parameters, with results that closely resemble those obtained using the measuring instrument.
Experimental data conducted can be seen that the process of sending data or storing data can be done with a time interval of 5 minutes.
Figure 8. Data graph of temperature, pH, TDS, and Turbidity
Figure 8 can be concluded that pH, TDS and Turbidity are interrelated where for example if there is an increase in pH, TDS and Turbidity also increase. Conversely, if the pH drops, TDS and Turbidity also decrease but do not affect the water temperature. Water temperature remains an important parameter to always be monitored for fish survival, which is between 29℃ and 35℃. Using the tool produced from this research has several advantages such as users or owners can observe water conditions without having to be at the cultivation site because the data stored is on the cloud server. In addition, the cost to produce this tool as a whole is very cheap so that it can be used in any area, then the components in this tool are easily available so that if there is a replacement of parts, it can be done easily. As an illustration of the total cost of operating one tool from this prototype tool can be seen in Table 2 and when compared to the cost of hiring an employee for 24 hours to supervise the pool which is approximately Rp 2,400,000 then operating this tool is much cheaper.
During the use of the tools produced from this research, there are several obstacles that must be considered, namely the need for a way to ensure that all sensor and controller devices can be stable on the water surface even in bad weather. Bad weather can cause the water surface to be unsettled so that these devices are less stable and cause sensor readings to be somewhat less accurate. Likewise, the internet connection in bad weather conditions also causes the internet connection to the cloud server to be poor so that the data sent is sometimes constrained to be stored.
The prototype of Oreochromis Niloticus fish pond water quality monitoring system for fish farmers is able to provide sensor readings in real time using a nodeMCU controller. The sensors used are adjusted to the parameters for measuring the water quality of fish farming ponds including temperature parameters to measure water temperature, pH to measure water pH levels, water turbidity levels and levels of total solutes in pond water. Each sensor will have a certain status range value which can later be used for controlling pond water, namely controlling the filling and discharge of water and activating the water filter pump. Data sent using an internet connection to the cloud server can be stored properly every 5 minutes in realtime. Overall functional testing has been carried out and shows that the pond water quality monitoring prototype can work according to the input to the device and provide output based on the process carried out by the system. By using the tool from the results of this study, it can monitor the water quality of fish ponds at a fairly low cost.
For future work, the data generated can be analyzed using machine learning to get feeding patterns, patterns to predict fish survival rates, and can also get patterns to predict what parameters will increase or decrease. So that on the application side, an early warning feature can be added that provides information about feeding patterns, fish survival rates and parameters that will experience interference or problems.
This research is supported and funded by Lembaga Penelitian dan Pengabdian Masyarakat (LPPM) University of Riau (Grant No.: 8205/UN19.5.1.3/al.04/2023).
[1] Provinsi Riau Dalam Angka 2022. https://riau.bps.go.id/publication/2022/02/25/85c4ce5fd9662f99e34a5071/provinsi-riau-dalam-angka-2022.html.
[2] Hu, Z., Li, R., Xia, X., Yu, C., Fan, X., Zhao, Y. (2020). A method overview in smart aquaculture. Environmental Monitoring and Assessment, 192: 493. https://doi.org/10.1007/s10661-020-08409-9
[3] Ya’acob, N., Dzulkefli, N., Yusof, A.L., Kassim, M., Naim, N.F., Aris, S.S.M. (2021). Water quality monitoring system for fisheries using internet of things (IoT). IOP Conference Series: Materials Science and Engineering, 1176(1): 012016. https://doi.org/10.1088/1757-899x/1176/1/012016
[4] Chen, C.H., Wu, Y.C., Zhang, J.X., Chen, Y.H. (2022). IoT-based fish farm water quality monitoring system. Sensors, 22(17): 6700. https://doi.org/10.3390/s22176700
[5] Situmorang, J.P., Ariyanto, E., Al Makky, M. (2023). Pemanfaatan IoT pada Metode Ad Satiation untuk Meningkatkan Efektivitas Budidaya Ikan Mas. Proceedings of Engineering, 10(2): 2061-2070.
[6] Riansyah, A., Mardiati, R., Effendi, M.R., Ismail, N. (2020). Fish feeding automation and aquaponics monitoring system base on IoT. In 2020 6th International Conference on Wireless and Telematics (ICWT), Yogyakarta, Indonesia, pp. 1-4. https://doi.org/10.1109/ICWT50448.2020.9243620
[7] Wang, C., Li, Z., Wang, T., Xu, X., Zhang, X., Li, D. (2021). Intelligent fish farm - the future of aquaculture. Aquaculture International, 29: 2681-2711. https://doi.org/10.1007/s10499-021-00773-8
[8] Zulhelman, Z., Ausha, H.A., Ulfa, R.M. (2016). Pengembangan sistem smart aquaponik. Jurnal Poli-Teknologi, 15(2): 181-186. https://doi.org/10.32722/pt.v15i2.848
[9] Susanti, N.D., Sagita, D., Apriyanto, I.F., Anggara, C.E. W., Darmajana, D.A., Rahayuningtyas, A. (2022). Design and implementation of water quality monitoring system (Temperature, pH, TDS) in aquaculture using IoT at low cost. In 6th International Conference of Food, Agriculture, and Natural Resource (IC-FANRES 2021), pp. 7-11. https://doi.org/10.2991/absr.k.220101.002
[10] Tamim, A.T., Begum, H., Shachcho, S.A., Khan, M.M., Yeboah-Akowuah, B., Masud, M., Al-Amri, J.F. (2022). Development of IoT based fish monitoring system for aquaculture. Intelligent Automation & Soft Computing, 32(1): 55-71. http://dx.doi.org/10.32604/iasc.2022.021559
[11] Den Ouden, C.J., Wills, P.S., Lopes, L., Sanderson, J., Ouyang, B. (2022). Evolution of the hybrid aerial underwater robotic system (HAUCS) for aquaculture: Sensor payload and extension development. Vehicles, 4(2): 390-408. https://doi.org/10.3390/vehicles4020023
[12] Nalendra, A.K. (2021). Rapid application development (rad) model method for creating an agricultural irrigation system based on internet of things. IOP Conference Series: Materials Science and Engineering, 1098(2): 022103. https://doi.org/10.1088/1757-899x/1098/2/022103
[13] Park, J.Y. (2021). Real-time monitoring electronic triage tag system for improving survival rate in disaster-induced mass casualty incidents. Healthcare, 9(7): 877. https://doi.org/10.3390/healthcare9070877
[14] Ramelan, A., Adriyanto, F., Apribowo, C.H.B., Ibrahim, M. H., Sulistyo, M.E., Arief, K.S. (2021). IOT lora-based energy management information system with rad method and laravel frameworks. Journal of Communications Software and Systems, 17(4): 366-372. https://doi.org/10.24138/jcomss-2021-0003
[15] Ortiz, K.J.P., Davalos, J.P.O., Eusebio, E.S., Tucay, D.M. (2018). IoT: Electrocardiogram (ECG) monitoring system. Indonesian Journal of Electrical Engineering and Computer Science, 10(2): 480-489.
[16] Shen, Y. (2022). Information monitoring of animal husbandry industry based on the internet of things and wireless communication system. Computational and Mathematical Methods in Medicine, 2022: 8794044. https://doi.org/10.1155/2022/8794044
[17] Harjoseputro, Y., Julianto, E., Handarkho, Y.D., Ritonga, Y.I.T. (2020). Design and implementation of smart waste recycling bin for the household environment based on IoT. Sensor Review, 40(6): 657-663. https://doi.org/10.1108/SR-03-2020-0051
[18] Liu, X., Du, X., Zhang, X., Zhu, Q., Wang, H., Guizani, M. (2019). Adversarial samples on android malware detection systems for IoT systems. Sensors, 19(4): 974. https://doi.org/10.3390/s19040974
[19] Parenreng, J.M., Syahrul, S., Wahid, A., Sary, D.W. (2022). Modern Farming Biofloc ponds for tilapia aquaculture based on the internet of things use a fuzzy logic algorithm. Internet of Things and Artificial Intelligence Journal, 2(4): 233-247. https://doi.org/10.31763/iota.v2i4.548
[20] Saha, R., Biswas, S., Sarmah, S., Karmakar, S., Das, P. (2021). A working prototype using DS18B20 temperature sensor and arduino for health monitoring. SN Computer Science, 2(1): 33. https://doi.org/10.1007/s42979-020-00434-2
[21] Islam, M.M., Kashem, M.A., Uddin, J. (2022). An internet of things framework for real-time aquatic environment monitoring using an Arduino and sensors. International Journal of Electrical and Computer Engineering, 12(1): 826-833. https://doi.org/10.11591/ijece.v12i1.pp826-833
[22] Udanor, C.N., Ossai, N.I., Nweke, E.O., Ogbuokiri, B.O., Eneh, A.H., Ugwuishiwu, C.H., Aneke, S.O., Ezuwgu, A.O., Ugwoke, P.O., Christiana, A. (2022). An internet of things labelled dataset for aquaponics fish pond water quality monitoring system. Data in Brief, 43: 108400. https://doi.org/10.1016/j.dib.2022.108400
[23] Tolentino, L.K., Chua, E.J., Añover, J.R., Cabrera, C., Hizon, C.A., Mallari, J.G., Mamenta, J., Quijano, J.F., Virrey, G., Madrigal, G.A., Fernandez, E. (2021). IoT-Based automated water monitoring and correcting modular device via LoRaWAN for aquaculture. International Journal of Computing and Digital Systems, 10: 533-544. https://doi.org/10.12785/IJCDS/100151
[24] Sabireen, H., Neelanarayanan, V. (2021). A review on fog computing: Architecture, fog with IoT, algorithms and research challenges. ICT Express, 7(2): 162-176. https://doi.org/10.1016/j.icte.2021.05.004
[25] Sutikno, T., Purnama, H.S., Pamungkas, A., Fadlil, A., Alsofyani, I.M., Jopri, M.H. (2021). Internet of things-based photovoltaics parameter monitoring system using NodeMCU ESP8266. International Journal of Electrical and Computer Engineering, 11(6): 5578-5587. https://doi.org/10.11591/ijece.v11i6.pp5578-5587
[26] Ali, M., Kanwal, N., Hussain, A., Samiullah, F., Iftikhar, A., Qamar, M. (2020). IoT based smart garden monitoring system using NodeMCU microcontroller. International Journal of Advances in Applied Sciences, 7(8): 117-124. https://doi.org/10.21833/ijaas.2020.08.012
[27] Ouldzira, H., Mouhsen, A., Lagraini, H., Chhiba, M., Tabyaoui, A., Amrane, S. (2019). Remote monitoring of an object using a wireless sensor network based on NODEMCU ESP8266. Indonesian Journal of Electrical Engineering and Computer Science, 16(3): 1154-1162. https://doi.org/10.11591/ijeecs.v16.i3.pp1154-1162