Purude Vaishali Narayanrao![]() | P. Lalitha Surya Kumari*
| P. Lalitha Surya Kumari*![]()
OPEN ACCESS
Depression is serious and common disorder among human being that affects mental health. Large scale research is carried out to identify the risk of depression. Using technology to identify individuals with depression could connect patients with the help they need more quickly and easily while reducing healthcare costs and burden on physicians. In this paper Convolution Neural Network (CNN) is implemented using Patient Health Questionnaire (PHQ-9) screened NHANES (National Health and Nutrition Examination Survey) dataset from 1999 to 2014. The proposed framework for automatic depression prediction shows accuracy starting from 92.37 to 1.0. Continuing the research, dropout layer is used in visible and hidden layers to avoid overfitting. After the use of dropout layer the training and validation accuracy is synchronized and validation loss is less than training loss. Hence generalized model is obtained by using regularized CNN with 100% accuracy. When the implemented model is compared with existing work in the same area then it is observed that till date using CNN this is the first attempt to achieve 100% accuracy on NHANES dataset for identifying the risk of depression using PHQ-9 questionnaire.
CNN, depression, dropout, NHANES, overfitting, PHQ-9
As per survey reports of WHO (World Health Organization), millions of people are depressed worldwide. Depression is a common illness worldwide, with an estimated 3.8% of the population affected, including 5.0% among adults and 5.7% among adults older than 60 years [1]. Approximately 280 million people of all ages suffer from depression [1]. As many as 2 out of 100 young children and 8 out of 100 teens may have serious depression.
The seriousness of this issue is the inspiration to many researchers to start research work in such field. The challenge in this task is to differentiate stress, anxiety and depression using appropriate machine learning algorithm for accurate prediction.
A healthy person means not only physical fitness but includes healthy brain also. For diagnosis of depression treatments include meditation, medication and psychotherapy. Depressive symptoms can be monitored using tools like self-reports taken periodically via interview or questionnaires. Using machine learning to identify individuals with depression could connect patients with the help they need more quickly and easily while reducing healthcare costs and burden on physicians.
1.1 Motivation (Suicide and depression)
According to American Association of Suicidology-Two-thirds of those who commit suicide struggle with depression. Of those diagnosed with depression, 1% of women and 7% of men commit suicide. The risk of suicide is about 20 times greater among those diagnosed with major depression in comparison to those without major depression. Suicide is one of the leading causes of death for 15- to 19-year-olds. Reports of suicide attempts among college students increased from 0.7% to 1.8% from 2013 to 2018.
A leading cause of disability worldwide is depression which is a major contributor for overall global burden of disease. More than men, women are affected by depression. Depression can lead to suicide. There is effective treatment for mild, moderate, and severe depression. If prediction is done at early stage, then treatment can be started. In this research, an approach for depression prediction using text classification, analyzes the answers given by depressive subject to the interview or questionnaire. Different questionnaire techniques are Patient Health Questionnaire (PHQ) investigated by Jelenchick et al., BDI (Beck Depression Inventory) and HRDS (Hamilton Depression Rating Scale). These tools provide alerts for depression through prediction. PHQ-9 questionnaires applied on NHANES dataset for depression assessment. Total score is determined by addition of scores of all 9 questions answered by subject. Total is checked against threshold to label data and then classification is done using CNN. Convolution Neural Network (CNN) or ConvNet is a artificial neural network based on feed-forward technique and deep learning. It is used in wide range of applications in medical field. For example, image processing algorithms can be implemented using CNN to find fractures in X-ray images [2]. It can also be used in computer vision applications for automatic plant species recognition using leaf dataset [3]. Other uses include in iris recognition system using noisy eye images in which CNN performs entropy based segmentation [4]. Entropy based CNN can also improve segmentation accuracy in eye biometric system [5].
1.2 CNN contains following layers
a. The convolution layer - Using dot product of weights and small receptive fields in the input, it generates output. This results in the extraction of a feature map.
b. The subsampling layer - It gets a representation of input by reducing its dimensions, to avoid the risk of overfitting. Maxpooling is one of the alternatives for subsampling. It takes the largest value.
c. The fully connected layer - This layer flattens the features extracted by convolutional layers and then combines all the features. The flattened output is directed to the output layer where sigmoid function or softmax classifier predicts the class label for that input.
Three convolution layers are used using function Conv2D () and the Leaky ReLU activation function. The max-pooling layer is formed using MaxPooling2D (). The last layer used is the Dense layer that utilizes softmax activation function. Dataset contains 5372 entries, out of which 60% data is used for training, 20% for testing and remaining 20% dataset is used for validation. Accuracy achieved for Test dataset is 1.0 with loss 0.0001907785770323714. While for validation loss is 0.0002670571828042908 with accuracy 1.0.
The summary of the proposed framework contribution is:
First framework architecture is proposed for automatic depression prediction that performs Text processing on PHQ-9 questionnaires applied on NHANES dataset for depression assessment using CNN.
In next part CNN is trained by adding dropout layer to avoid overfitting.
The paper is divided section wise as stated; Section II performs review of previous work in the same area. Section III provides information about dataset used. Section IV gives proposed method along with system architecture, algorithm, and model of CNN without and with dropout layer. Section V, VI displays and discusses the experimental results. Section VII provides comparative study while Section VIII concludes this paper.
Automatic depression assessment is a rapidly growing research domain. After surveying nearly 30 papers from past 5 years found related work using text classification as following:
Text classification has several applications like organizing large documents based on topics using fuzzy neural network [6]. Social emotions can be predicted in multilingual environment taking summarization of text from social media posts like Twitter and Facebook [7]. Text documents can be clustered into groups by feature selection [8]. When text data is shared among distributed framework using cloud, encryption techniques should be used to make the information sharing secure [9]. Though smart healthcare [10, 11] applications can be developed using IoT, patient health monitoring system can be built using text data as input.
According to study language used by depressed person is different from healthy person. It serves useful input for text classification. Author [12] used DASS 21(Depression, Anxiety and Stress Scale questionnaire) [12] for predicting Depression, Anxiety and Stress by applying machine learning algorithms. Random Forest classifier proved best accuracy model among 5 algorithms to predict depression in employed and unemployed people from different communities and culture. Another author [13] predicted depression among IT employees using dataset of questionnaires and again found Random forest as best model with highest accuracy. While research is also carried to predict major depressive disorder (MDD) among elderly people using Perceived Deficit Questionnaire for Depression (PDQD) [14]. Author [15] developed model using Human Computer Intervention (HCI) by asking mental health questionnaire to 671 participants using multimodal deep learning for video, audio and text data. Same research also carried out among military persons by asking baseline questionnaires [16]. Author [17] used Korea National Health and Nutrition Examination Surveys dataset to classify depressive subjects using regularized Logistic Regression model. Some authors used dataset that contains text-based questions by youth discussed on public online channel. The model used was RNN (Recurrent Neural Network) using LSTM (Long Short-Term Memory) to identify text inputs that describe self-identified depression symptoms [18]. While some authors carried research during pandemic to identify depression among employees in IT sector using survey based data [19].
It is possible to predict depression using questionnaire dataset. Text classification can be applied to obtained answers. When related work in this research area is surveyed, text classification when used for depression prediction, the model is not more accurate. From this survey it is observed that for depression identification using text classification based on questionnaires dataset, accuracy achieved is less than 98%.
Hence experiments are carried out in this research to get still higher accuracy using CNN.
The dataset used is NHANES. It is responsible for producing all the useful health statistics for the Nation. The NHANES is an initiation that monitors health status of persons residing in United States (USA). The survey is carried out by combining interviews with physical examinations. It is part of the Centers for Disease Control and Prevention (CDC) that produces health related statistical information for USA. The survey is conducted each year. It examines nearly 5000 persons located across the country. The questionnaires are formed to satisfy emerging needs of health measurement. The NHANES interview questions includes dietary, socioeconomic, demographic, and health-related questions. The obtained data is useful for prediction of major diseases and its risk factors. It expands the knowledge of Nation in health sector. In this dataset, Data samples are collected for 5372 participants from 1999 to 2014. In the dataset Mental Health - Depression Screener from Questionnaire data is used by applying PHQ-9. Dataset contains 9 columns representing questions based on interest in doing things, whether feeling hopeless, down and depressed, whether taking proper sleep, whether feels like lost energy, whether eating habits changed, whether feels bad about self, less concentration, affected speech, thought of ending life. Possible options for responses are "not at all," "several days," "more than half the days," and "nearly every day" with a point from 0 to 3.
Depression identification using Questionnaire dataset NHANES 2014 is proposed using following methodology.
4.1 System architecture
The responses of person to the questionnaire is collected in dataset. From it remove null entries and entries not containing responses in between 0-3. The sum of all the responses is found and compared with threshold 10. This value is considered to find symptoms of depression. The labeled dataset is obtained as the result of comparison. This dataset acts as input to the proposed model.
The Figure 1 indicates proposed system architecture. Three convolution layers are used using function Conv2D () and the Leaky ReLU activation function. The max-pooling layer is formed using MaxPooling2D (). The last layer is a Dense layer that makes use of softmax activation function.
The convlotution layer tries to find pattern or useful information in data. The feature extraction is carried out using 3X3 filters. In the obtained pool of data, the maximum features are sent to next layer using MaxPooling layer. The matrix is converted into vector using Flatten layer. And as we need to carry binary classification (depressed or not depressed), apply dense layer at the end.
Figure 1. System architecture
4.2 Algorithm
The algorithm for implementing CNN model is given in Table 1.
Table 1. Algorithm to predict depression using CNN
|
Algorithm 1: Depression CNN Algorithm |
|
Input: NHANES-2014 dataset |
|
1. Begin: 2. Install tensorflow and keras in python the packages required for text classification. 3. Read NHANES-2014 dataset using pandas. Mental Health - Depression Screener from Questionnaire data is used by applying PHQ-9. i. Perform preprocessing to clean the dataset as following ii. Removing null entries. iii. Removing columns not containing responses in between 0-3. iv. Converting all entries into int64 data type. 4. Calculate total score as the sum of the points in for each question ranging from 0 to 27. 5. Define threshold as 10 for assessing Major depression and depression severity. 6. Considering this threshold label the dataset as depressed (1) and non-depressed (0). 7. Using sklearn, split 80% dataset for training and remaining 20% for testing. 8. Again from training dataset divide 20% data for validation to reduce overfitting and to improve test performance. 9. Define variables batch_size, epochs and num_classes. 10. Define the model using 3 convolution layers and 3 max-pooling layers. 11. Compile the model by specifying optimizer as Adam, loss type binary_crossentropy and metrics as accuracy. 12. Visualize the model created in above step using summary function. 13. Train the model using fit() function of keras. 14. The function fit() returns history object representing the result of training operation that contains training and validation accuracy and loss at each epoch out of 20. 15. Evaluate the performance of the model for test dataset. 16. Plot the graph using training and validation accuracy and loss. End |
|
Output: Binary Classified data indicating prediction of depression. |
4.3 Model
The model using 3 convolution layers and 3 max-pooling layers is defined as shown in the Figure 2.
Figure 2. CNN model without dropout layer
4.4 Adding dropout layer into the network model
To avoid overfitting, dropout layer is added to CNN. Dropout means during training period, randomly turns off some fraction of neurons to reduce the dependency on the training data. The values of hyperparameter decide the fraction of neuron to turn off. Due to such turn off, CNN need not remember training data as active neurons will be in learning phase while inactive will not be able to learn.
By adding dropout layer define, compile and train the model. And execute it for 20 epochs and batch with size of 64.
4.5 Algorithm with dropout layer
Using algorithm given in Table 2 build CNN model with dropout layers to avoid overfitting.
Table 2. Algorithm to predict depression using CNN with dropout layer
|
Algorithm 2: Depression CNN_dropout Algorithm |
|
Input: Use following values from Depression CNN Algorithm train_x,train_y: features and labels of Training set. val_x,val_y: features and labels of Validation set. test_x,test_y : features and labels of Test set. |
|
Begin: 1: Define the model using 3 convolution layers and 3 max-pooling layers and dropout layers. 2: Compile the model by specifying optimizer as Adam, loss type binary_crossentropy and metrics as accuracy. 3: Visualize the model created in above step using summary function. 4: Train the model using fit() function of keras. 5: The function fit() returns history object representing the result of training operation that contains training and validation accuracy and loss at each epoch out of 20. 6: Evaluate the performance of the model for test dataset. 7: Observe the change in training and validation accuracy and loss due to addition of dropout layer and plot the graph. End |
|
Output: Binary Classified data indicating prediction of depression that handles overfitting |
4.6 Model with dropout layer
The CNN model by adding dropout in both visible layer and hidden layer is defined in the Figure 3.
Figure 3. CNN model with dropout layer
Experiment is implementing CNN assigns each sample from input to either class called binary classification. The classes are represented by label 1(depressed) & 0(non-depressed). Element is assigned true label if prediction is correct indicating match between predicted and true labels, while false label indicates mismatch.
The four metrics used are:
True Positive: It means correct classification of positive samples.
False Negative: It is exactly reverse of True positive indicating incorrect classification of positive samples.
False Positive: It means incorrect classification of negative samples.
True Negative: It is exactly reverse of False positive indicating correct classification of negative samples.
To evaluate behavior of the model, above four metrics are used to find Accuracy, Precision and Recall.
Accuracy: Accuracy is correct predictions divided by total predictions.
$$Accuracy=\frac{\text { True }_{\text {positive }}+\text { True }_{\text {negative }}}{\text { True }_{\text {positive }}+\text { True }_{\text {negative }}+\text { False }_{\text {positive }}+\text { False }_{\text {negative }}}$$
Precision: It measures model’s accuracy for classifying a sample as positive. It specifies number of positive samples classified correctly.
Precision $=\frac{\text { True }_{\text {positive }}}{\text { True }_{\text {positive }}\quad+\text { False }_{\text {positive }}}$
Recall: It is defined as ratio of number of positive samples classified correctly as positive to the total positive samples.
Recall $=\frac{\text { True }_{\text {positive }}}{\text { True }_{\text {positive }}\quad+\text { False }_{\text {negative }}}$
When model is executed then training and validation accuracy and loss obtained in each epoch is displayed in Figure 4. Accuracy of 1.0 is obtained with loss of 0.00014826182060925593.
Figures 5 and 6 show plots epochwise.
Figure 4. Epochwise output for CNN without dropout layer
Figure 5. Training and validation accuracy
Figure 6. Training and validation loss
6.1 Adding dropout
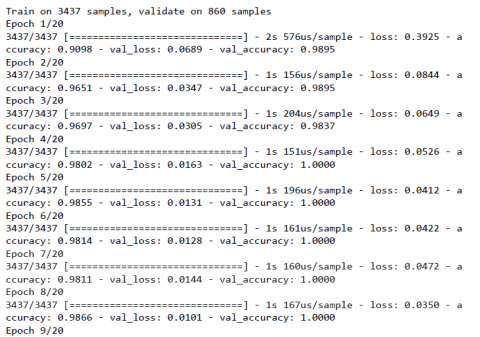
After adding 25% dropout in visible layer, 25 and 40% in hidden layers and finally 30% dropout is added in output layer. Output obtained in each epoch is shown in Figure 7.
Figure 7. Epochwise output for CNN with dropout layer
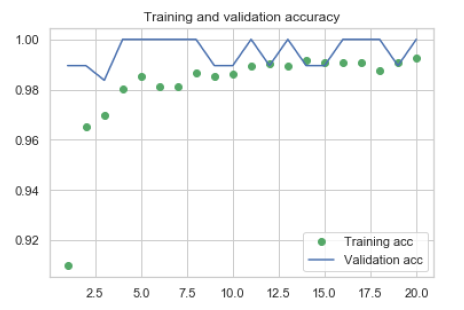
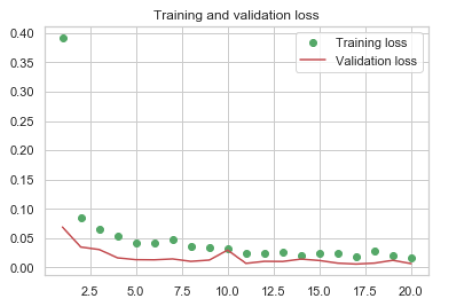
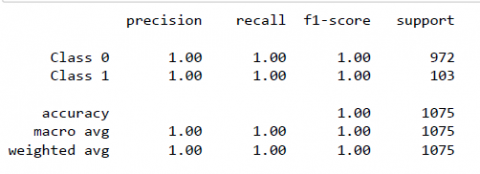
Figure 8 and 9 shows plots epoch wise. After adding dropout layer in CNN, it is observed that the loss and accuracy for validation data is synchronized with loss and accuracy for training data. Even though plots for them are not linear, but it indicates that the model is not overfitting as the loss obtained from validation data is not increasing but decreasing. Therefore, we can conclude that generalization capability of model improved in better way due to dropout layer. Figure 10 shows classification report indicating performance of model with metrics accuracy, precision, recall and f1-score as 1.00 which is the best performance achieved for this task till now using CNN.
Figure 8. Training and validation accuracy with dropout layer
Figure 9. Training and validation loss with dropout layer
Figure 10. Classification report
The obtained results are compared with previous work either using CNN and different questionnaire datasets. The analysis is as shown in Table 3.
As shown in Table 3, after comparing experimental results with previous related work in same area, it is observed that only machine learning algorithms like Logistic Regression, Decision tree gave 100% accuracy as dataset is small (117 participants). Hence it can be concluded that CNN model and regularized CNN model implemented in this experiment giving highest accuracy of 100% for large dataset. Same comparative accuracy is plotted graphically in Figure 11.
Table 3. Comparison with previous work
|
References |
Dataset used |
Algorithm |
Performance in terms of accuracy |
|
[12] |
DASS21 |
DT |
77.8 |
|
RF |
79.8 |
||
|
NB |
85.5 |
||
|
SVM |
80.3 |
||
|
KNN |
72.1 |
||
|
[13] |
Dataset formed by conducting interview for 60 IT employees |
RF |
81.2 |
|
[14] |
PDQ-D, PHQ-9 AND SDS |
Multiple Regression Analysis |
NCT Z score |
|
[15] |
PHQ-9 Questionnaire applied on 671 participants |
BiLSTM |
70.88 |
|
[16] |
PHQ-9 Questionnaire applied on 1951 men and 298 women in Army |
RF |
Women – 68 Men- 73 |
|
[17] |
2014 NHANES (Training) 2016 Korea NHANES (Testing) on 9488 participants |
LR |
82.8 |
|
[18] |
Questionnaire asked on site ung.no under title Mental health and emotions |
LSTM based RNN |
98 |
|
[19] |
Web based survey on IT sector employees in India on 117 participants |
LR |
100 |
|
KNN |
88 |
||
|
RF |
97 |
||
|
DT |
100 |
||
|
Bagging |
100 |
||
|
DNN |
97 |
||
|
[20] |
BDI-II questionnaire for Pre-sem and Post-sem asked to 138 college students. |
ML model |
81.3 |
|
[21] |
Posts by 1000 randomly selected students on social network Weibo |
RBF-NN |
83.66 / 82.31 (Train/Test) |
|
SVM |
82.77 / 80.00 |
||
|
KNN |
81.52 / 79.23 |
||
|
DISVM |
88.10 / 86.15 |
||
|
[22] |
BDI-II questionnaire on RACE dataset for 20 users |
BERT model |
69.41 (ACR) |
|
[23] |
NHANES and KNHANES |
LR and DL |
91 (AUC) |
|
[24] |
PHQ-9 mental screen inventory on NHANES data |
SVM |
92.1 |
|
DT |
90.5 |
||
|
ANN |
90.8 |
||
|
KNN |
92.4 |
||
|
Ensemble Classifier |
95.4 |
||
|
[25] |
DASS21 and DASS42 questionnaire |
Bayes Net |
89.6 |
|
NB |
74.89 |
||
|
MLP |
87.95 |
||
|
RBFN |
96.02 |
||
|
KNN |
75.14 |
||
|
RF |
84.97 |
||
|
K star with RF |
91.38 |
||
|
This research |
PHQ-9 Questionnaire applied on 2014 NHANES USA data |
CNN |
100 |
|
Regularized CNN (with dropout layer) |
100 |
Figure 11. Comparative study
An identification of risk of depression at early stage can save life of the affected person by starting the treatment. In this paper, we have used health related data from NHANES dataset and developed a generalized methodology that could help in early detection of the onset of depression by implementing CNN with 100% accuracy. By adding dropout layer we obtained regularized CNN that avoids overfitting. Accuracy obtained in this phase of experiment also 100%. Till date using NHANES dataset, the depression prediction is not done using CNN that avoids overfitting with the use of dropout layer. The obtained accuracy in previous study starts from 69.41% which is very poor. Using machine learning algorithms better than 69.41% accuracy is achieved but it works on less data samples. Hence this research is suitable for large data samples with 100% accuracy. The model is regularized and generalized using dropout layer to avoid the risk of overfitting. This is the most accurate and generalized model till date using deep learning. In future dataset can be expanded by adding demographic data and other questionnaires that plays role in depression prediction. And experiments can be performed on expanded dataset.
[1] https://www.who.int/news-room/fact-sheets/detail/depression, accessed on Sep. 20, 2022.
[2] Chittajallu, S.M., Mandalaneni, N.L.D., Parasa, D., Bano, S. (2019). Classification of Binary Fracture Using CNN. In 2019 Global Conference for Advancement in Technology (GCAT), Bangalore, India, pp. 1-5. https://doi.org/10.1109/GCAT47503.2019.8978468
[3] Dudi, B., Rajesh, V. (2019). Medicinal plant recognition based on CNN and machine learning. International Journal of Advanced Trends in Computer Science and Engineering, 8(4): 999-1003. https://doi.org/10.30534/ijatcse/2019/03842019
[4] Pathak, M., Bairagi, V., Srinivasu, N. (2019). Entropy based CNN for segmentation of noisy color eye images using color, texture and brightness contour features. International Journal of Recent Technology and Engineering, 8(2): 2116-2124. https://doi.org/10.35940/ijrte.B2332.078219
[5] Pathak, M.P., Bairagi, V., Srinivasu, N. (2019). Multimodal eye biometric system based on contour based E-CNN and multi algorithmic feature extraction using SVBF matching. International Journal of Innovative Technology and Exploring Engineering, 8(9): 417-423. https://doi.org/10.35940/ijitee.i7729.078919
[6] Krishna, U.S., Shree, H., Jayadeep, K., Prasanna, P.L. (2019). Text classification using fuzzy neural network. Int. J. Recent Technol. Eng., 7(6): 193-198.
[7] Prasad, K.V., Satya Vara Prasad, B.B.V., Chandrasekhar, P., Tenali, R.K. (2019). Multilingual sentimental analysis by predicting social emotions via text summarization. International Journal of Recent Technology and Engineering (IJRTE).
[8] Nikhath, A.K., Subrahmanyam, K. (2019). Feature selection, optimization and clustering strategies of text documents. International Journal of Electrical and Computer Engineering (IJECE), 9(2): 1313-1320. https://doi.org/10.11591/ijece.v9i2.pp1313-1320
[9] Mojjada, R.K., Tenali, R.., Satya Vara Prasad, B.B.V., Aruna, B. (2019). Consistent information insolvency in cloud using cipher text encryption. International Journal of Innovative Technology and Exploring Engineering, 8(8): 1600-1603.
[10] Banka, S., Isha M., Saranya, S.S. (2018). Smart healthcare monitoring using IoT. International Journal of Applied Engineering Research, 13(15): 11984-11989.
[11] Babu, K.P., Nageswara Rao, G.S. (2019). Smart healthcare system. International Journal of Innovative Technology and Exploring Engineering, 8(12): 4184-4188. https://doi.org/10.35940/ijitee.L3667.1081219
[12] Priya, A., Garg, S., Tigga, N.P. (2020). Predicting anxiety, depression and stress in modern life using machine learning algorithms. Procedia Computer Science, 167: 1258-1267. https://doi.org/10.1016/j.procs.2020.03.442
[13] Sandhya, P., Kantesaria, M. (2019). Prediction of mental disorder for employees in IT industry. International Journal of Innovative Technology and Exploring Engineering (IJITEE), 8(6S): 374-376.
[14] Srisurapanont, M., Suttajit, S., Eurviriyanukul, K., & Varnado, P. (2017). Discrepancy between objective and subjective cognition in adults with major depressive disorder. Scientific Reports, 7(1): 3901. https://doi.org/10.1038/s41598-017-04353-w
[15] Victor, E., Aghajan, Z.M., Sewart, A.R., Christian, R. (2019). Detecting depression using a framework combining deep multimodal neural networks with a purpose-built automated evaluation. Psychological assessment, 31(8): 1019-1027. https://doi.org/10.1037/pas0000724
[16] Sampson, L., Jiang, T., Gradus, J.L., et al. (2021). A Machine learning approach to predicting new‐onset depression in a military population. Psychiatric research and clinical practice, 3(3): 115-122.
[17] Cho, S.E., Geem, Z.W., Na, K.S. (2021). Predicting depression in community dwellers using a machine learning algorithm. Diagnostics, 11(8): 1429. https://doi.org/10.3390/diagnostics11081429
[18] Uddin, M.Z., Dysthe, K.K., Følstad, A., Brandtzaeg, P.B. (2022). Deep learning for prediction of depressive symptoms in a large textual dataset. Neural Computing and Applications, 34(1): 721-744. https://doi.org/10.1007/s00521-021-06426-4
[19] Kaman, S., Vajpai, I. (2020). Predicting depression among it sector employees in India during COVID-19 pandemic using deep neural network and supervised machine learning classifiers: A survey approach. Editorial Board, 9(8): 23.
[20] Chikersal, P., Doryab, A., Tumminia, M., et al. (2021). Detecting depression and predicting its onset using longitudinal symptoms captured by passive sensing: a machine learning approach with robust feature selection. ACM Transactions on Computer-Human Interaction (TOCHI), 28(1): 1-41. https://doi.org/10.1145/3422821
[21] Ding, Y., Chen, X., Fu, Q., Zhong, S. (2020). A depression recognition method for college students using deep integrated support vector algorithm. IEEE access, 8: 75616-75629. https://doi.org/10.1109/ACCESS.2020.2987523
[22] Gabín, J., Pérez, A., Parapar, J. (2021). Multiple-Choice Question Answering Models for Automatic Depression Severity Estimation. Engineering Proceedings, 7(1): 23. https://doi.org/10.3390/engproc2021007023
[23] Oh, J., Yun, K., Maoz, U., Kim, T.S., Chae, J.H. (2019). Identifying depression in the National Health and Nutrition Examination Survey data using a deep learning algorithm. Journal of affective disorders, 257: 623-631. https://doi.org/10.1016/j.jad.2019.06.034.
[24] Tao, X., Chi, O., Delaney, P.J., Li, L., Huang, J. (2021). Detecting depression using an ensemble classifier based on quality of life scales. Brain Informatics, 8: 1-15. https://doi.org/10.1186/s40708-021-00125-5
[25] Kumar, P., Garg, S., Garg, A. (2020). Assessment of anxiety, depression and stress using machine learning models. Procedia Computer Science, 171: 1989-1998. https://doi.org/10.1016/j.procs.2020.04.213