Dadang Sudrajat![]() | Ade Irma Purnamasari
| Ade Irma Purnamasari![]() | Arif Rinaldi Dikananda
| Arif Rinaldi Dikananda![]() | Dian Ade Kurnia*
| Dian Ade Kurnia*![]() | Dwi Marisa Efendi
| Dwi Marisa Efendi![]()
OPEN ACCESS
Indonesia declares COVID-19 Pandemic by the World Health Organization (WHO) from March 2020. This has a very impact, one of which is on the continuity of the world of education. This research aims to foretell the impact of hybrid teaching methods used at SMK Cendikia Cirebon City during the COVID-19 period on student achievement. Teachers' materials, honesty, enthusiasm, and IT backing are all factors in determining the quality of education. Multiple linear regression with root-mean-squared error as the dependent variable is used in this study (RMSE). Experiments conducted on 122 participants yielded an RMSE of 0.375 and a correlation level of 0.440 for each attribute, with test samples comprising 10% and training samples comprising 90%. As a result, the use of this multiple linear regression model can be suggested for foreseeing the introduction of a hybrid learning model to enhance educational quality.
hybrid learning, multiple linear regression, RMSE, COVID-19
The World Health Organization (WHO) declared COVID-19 a global pandemic in early 2020. In response, the Ministry of Education and Culture has mandated that all educational institutions submit to regulations that make it possible for students to study at home. While very strict health protocols must be maintained, the Ministry of Education and Culture issued a policy in 2021 favoring the face-to-face method of education despite the growing threat posed by COVID-19 [1]. The implementation of education in the wake of the 2020 pandemic was conducted digitally. Therefore, the importance of implementing online learning through information technology really needs to be considered. The lack of student-to-student, student-to-teacher, and student-to-manager interaction is just one way in which online learning has impacted the psyches of students in the SMA/SMK education unit. While there is some content available online, it's sparse [2]. As a result, the traditional online-only model of education must undergo some technical adjustments to make way for what is now known as hybrid learning [3]. Hybrid learning is a method of education that combines the advantages of both traditional classroom instruction and modern online tools [4]. The learner or the instructor can take center stage depending on the goals of the lesson, and the model can accommodate both scenarios. To sum up, the teacher plays a more central role during the application process's early stages and the student plays a central role once the application has been successful (student center learning) [5].
Present-day hybrid models of education combine elements from several different pedagogical approaches, including (but not limited to) the following: First, face-to-face learning, or learning that is carried out face-to-face in the classroom or laboratory; learning activities include the delivery of material, discussion and presentation, exercises, and evaluation of learning or exams; Second, Synchronous Virtual Collaboration, or collaborative learning in which students from different locations work on the same assignment at the same time; and third, asynchronous learning. In the third place, we have teacher-student interaction through asynchronous virtual collaboration [6]. Fourth, the Asynchronous Self-Paced Learning Model is a learning model carried out by students at various and independent times; the implementation is provided at various times; the facilities used in learning activities are online discussion boards or discussion forums and emails. Books, modules, practice questions, and online tests and quizzes all contribute to the educational experience [7].
This study's contribution is a set of guidelines for implementing hybrid learning models with the goal of enhancing education at SMK Cendikia Cirebon City by taking into account the school's unique circumstances in terms of faculty, course materials, security, student motivation, and technological resources. It is based on the gap that occurred during an academic year where the achievements obtained by students during the COVID-19 pandemic are brought with a minimum completion value.
A machine learning method or technique, called Multiple Linear Regression, is proposed for predicting the hybrid learning model. The goal of multiple linear regression analysis is to establish a correlation between a single dependent variable or characteristic and a set of independent variables [8]. This study is divided into 5 parts, starting with the first part of introduction, the second part of related research, the third part of methods, the fourth part of result and discussion, and the fifth part of conclusion.
Numerous researchers on both sides of the Atlantic have conducted and published studies on hybrid learning in peer-reviewed academic journals. Benny Sumardiana's findings from his studies [5]. According to the findings, hybrid courses can help students who are fighting for their right to a quality education in the wake of the COVID-19 crisisased on the findings of other research [9] which demonstrated that hybrid learning is the product of the evolution of blended learning methods, it was concluded that this instructional strategy for life support education is at least as effective as conventional classroom instruction. Accredited basic and advanced life support courses show that a blended learning approach is associated with significant ongoing cost savings, although initial costs to the accrediting organization may be high. Using a Blended Learning Approach (BLA) can help improve learning outcomes and foster new forms of knowledge in the field of education. As useful as the internet can be for training and education, it will never be able to completely replace face-to-face interaction [10]. Based on his findings, he concludes that it is possible to predict students' performance in the classroom using predictive models employing linear regression [11]. Before the development of hybrid learning methods, there was one study of blended learning conducted at three vocational schools in Cirebon City with the results obtained were the level of satisfaction with the model measured by Very Satisfied, Satisfied, Moderately or Dissatisfied. The aspect measured by satisfaction consists of six components, namely Institution, Teacher, Learner, Content, Learning Support and Technology [12].
Linear Regression is the process of identifying relationships and influences between independent variables and dependent variables. Independent variables are symbolized by X while dependent variables are symbolized by Y [13]. Regression is commonly used for predicting and forecasting. Prediction is the process of estimating data values of any type and at any time (past, present, future) while forecasting is used to estimate the values of future time series data [14].
There are two types of linear regression, namely linear simple regression and multiple linear regression. Simple linear regression is a linear regression that involves only one independent variable X, whereas multiple linear regression involves more than one independent variable X [15].
The formula for simple linear regression is expressed in the equation as follows [14].
y=a+bx
where:
y=dependent variable
a=Constant
b=coefficient
x=independent variable
While the linear multiple regression formula is expressed in the following equation [16].
Y=a+b1X1+b2X2+…+bnXn
where,
Y=dependent variable
a=Constant
b1, b2, … bn=regression coefficient
X1, X2, … Xn=independent variable
From various related studies that have been reviewed, it can be summarized that studies on hybrid learning have been carried out by previous researchers. They report that hybrid learning is an extension of the blended learning approach, where blended learning depends on the internet and technology. It is known that the internet and technology cannot replace the atmosphere when interaction between students and teachers occurs, so as the atmosphere of the learning environment. Finally, with hybrid learning, students can alternately have the opportunity to interact directly with the teacher and their environment in a face-to-face classroom.
This study employs a data science methodology, which consists of five stages: data collection, data preprocessing, data transformation, modeling, and evaluation [17]. The Figure 1 is a breakdown of these phases.
Figure 1. Stages of research
3.1 Datasets collection
The data set was collected by administering an online Google form survey to 122 participants (including students, faculty, and staff). There are a total of fifteen questions on the survey, covering topics like classroom instruction, content, academic atmosphere, student motivation, and ICT support.
The data is disseminated through an online questionnaire that has been prepared through the URL link https://bit.ly/Survey_RK. Furthermore, the data that has been filled in is exported into the form of a spreedsheet file to be used as a data source in machine learning applications using Rapidminer 9.0.
3.2 Data pre-processing
One step in the data science and analysis process is called "data preprocessing" and its goal is to transform raw data into a form suitable for further analysis using machine learning [18].
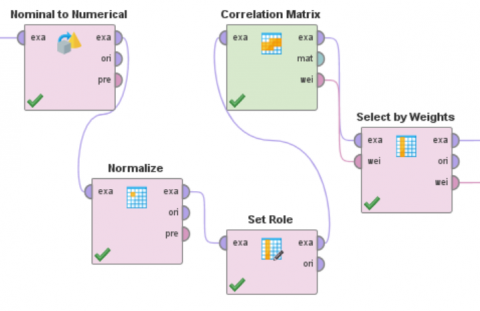
The following procedures were used to prepare the data for analysis in this study: nominal to numerical conversion; normalization; set role; correlation matrix; select by weight.
3.2.1 Nominal to numerical
During preprocessing, selected attributes with a nominal type are converted to a numeric type using the nominal to numerical conversion. Furthermore, the Figure 2 converts the values of these attributes to numbers.
Figure 2. Data pre-processing
3.2.2 Normalization
By adjusting the magnitude of each value, normalization ensures that it falls within a predetermined interval. When working with attributes on varying scales and units, it is crucial to modify the value range. When comparing massively different characteristics, normalization is a helpful tool.
3.2.3 Set role
An attribute’s role specifies how it is used by other operators. Being a “regular” is the default position. Specialized roles are those that fall outside the norm.
3.2.4 Correlation matrix
An attribute’s correlation with another is expressed as a number between -1 and +1. (call them X and Y). If the correlation coefficient is positive, it indicates a strong positive relationship. Here, high X values are linked to low Y ones, and low X values to high Y ones. If the correlation coefficient is negative, it means that the two things are correlated in the opposite way.
3.2.5 Select by weight
This operator takes an input example set and pulls out only the attributes whose weights meet the given criterion. The weight input port is where the user can input the desired weight. The weight relation parameter defines the weighted attribute selection criterion.
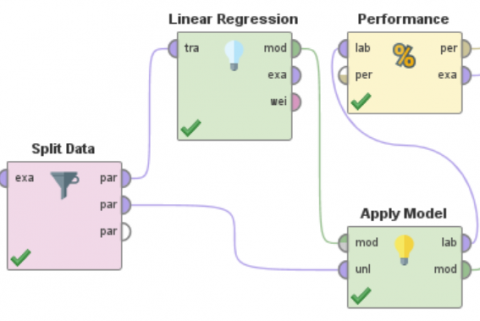
3.3 Data modelling
The purpose of data modeling, one of the many steps in the data science process, is to discover connections between various data sets in order to extract the required insights [19]. Multiple Linear Regression is the chosen data model for this investigation of Figure 3.
3.3.1 Split data
The input to the Split Data operator is an ExampleSet, and the outputs are the subsets of that ExampleSet. The partitions parameter allows the user to set the number of subsets (or partitions) and the size of each partition individually.
3.3.2 Linear regression
Statistical regression analyzes the interplay between a single “dependent” (here, the label attribute) and multiple “independent” (constant) variables (regular attributes). When trying to predict a continuous value, use regression instead of classification [11].
Figure 3. Data modeling of multiple linear regression
3.3.3 Apply model
First, another operator, typically a learning algorithm, is used to train the model on the example set. After that, this model can be used on a different example set. Using a preprocessing model to make a prediction on data that has not yet been seen is a common objective.
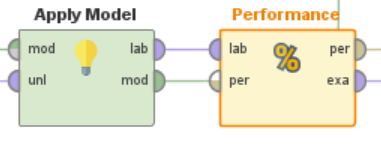
3.4 Evaluation
An effective machine learning model relies heavily on evaluation. After the training model has been finalized, the evaluation model process can begin [20]. In this research, the model is analyzed in terms of the operators’ efficiency, as shown in Figure 4.
Figure 4. Model evaluation using performance operator
3.4.1 Performance
It is recommended that this operator be used solely for assessing how well regression tasks have been completed. In addition to the performance operator, the performance (binary classification) operator, the performance (classification) operator, etc., there are numerous other performance evaluation operators available. Only regression tasks can make use of the Performance (Regression) operator.
Let's say we want to talk about the linear relationship between one dependent variable and several independent variables. This research's dataset includes the Table 1 elements:
Table 1. Type of variable
|
Variable |
Type |
|
Quality |
Dependent |
|
Teacher |
Independent Variable |
|
Content |
Independent Variable |
|
Integrity |
Independent Variable |
|
Motivation |
Independent Variable |
|
ICT Support |
Independent Variable |
One can think of the quality variable as a dependent variable, while the success of the hybrid learning system serves as an independent variable quality, namely teacher, content, integrity, motivation and ICT Support.
4.1 Linear regression table
In this linear regression table will be presented regarding the coefficient, error standard, coefficient standard, tolerance, t-count and p-value of each independent variable, is the Table 2.
Table 2. Matrix correlation table
|
Attribute |
Coef |
Std. Error |
Std. Coeff |
Toler |
t-Stat |
p-Value |
|
Teacher |
0.357 |
0.149 |
0.251 |
0.921 |
2.388 |
0.019 |
|
Content |
-0.037 |
0.141 |
-0.028 |
0.751 |
-0.261 |
0.795 |
|
Integrity |
-0.008 |
0.164 |
-0.005 |
1.000 |
-0.051 |
0.960 |
|
Motivation |
0.258 |
0.107 |
0.241 |
0.952 |
2.413 |
0.018 |
|
ICT Support |
0.014 |
0.156 |
0.009 |
0.861 |
0.090 |
0.928 |
|
(Intercept) |
0.138 |
0.059 |
|
|
2.322 |
0.022 |
Based on the table above, there are two variables that have a very small p-value or close to 0, namely the Teacher variable of 0.019 and motivation of 0.018. While the other three attributes have a very large p-value or close to the number 1.
The equation for multiple linear regression is expressed in the formula Y=a+b1X1+b2X2+...+bnxn n, thus from the equation it can be implied as follows:
Y=0.138+(0.357*Teacher)–(0.037*Content)-(0.008*Integrity)+(0.258*Motivation)+(0.014*ICT Support)
4.2 Data visualization
4.2.1 Teacher aspect statistically
The relationship between the teacher aspect and quality shows a strong relationship, this is shown through visualization that the distribution of points is close to a straight line, as shown in Figure 5:
Figure 5. The relationship of teacher aspect to quality
4.2.2 Content aspect statistically
The relationship between the content aspect to quality has a less strong relationship, this is shown by the distribution of points that are not close to a straight line, as shown in the chart of Figure 6:
Figure 6. The relationship of content aspect to quality
4.2.3 Integrity aspect statistically
The relationship between the integrity aspect to quality shows that it is not strong enough, it is shown that the distribution of points against straight lines is very far, as can be seen from the visualization as Figure 7:
Figure 7. The relationship of integrity aspects to quality
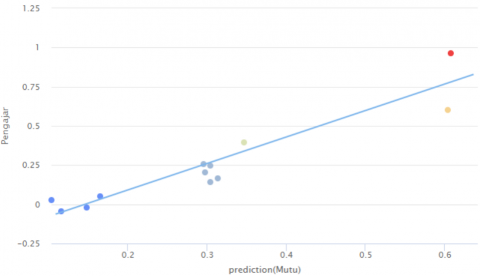
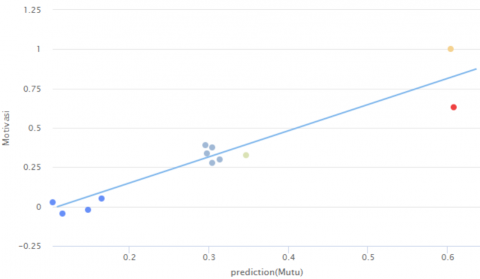
4.2.4 Motivation aspect statistically
The motivational aspect to quality has a very strong relationship, this can be shown by a graph where the distribution of points approaches to a straight line, as Figure 8:
Figure 8. The relationship of motivational aspects to quality
4.2.5 ICT aspect statistically
Similarly, the relationship of ICT Support aspects to quality has a strong relationship, it can be seen from the visualization results is Figure 9:
Figure 9. The relationship of ICT support aspects to quality
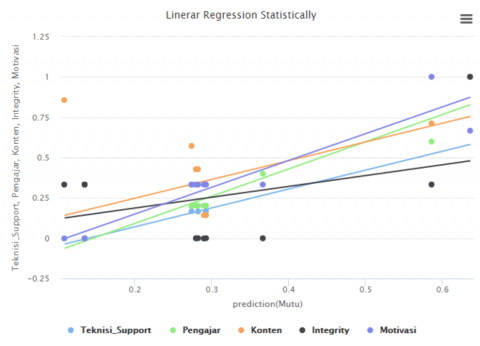
4.2.6 Linear regression statistically
Based on the results of the study conducted, if the connection between the five aspects (teacher, content, motivation, integrity and ICT Support) with the quality aspects in the hybrid learning model, then the multiple linear regression model can be visualized as Figure 10:
Figure 10. The relationship between aspects of teacher, content, motivation, integrity and ICT support to quality
4.3 Model evaluation result
The evaluation carried out is through measurements based on Root Mean Squared Error (RMSE), Mean Absolute Error (MAE) and Mean Absolute Relative Error (MARE) [16].
RMSE is a measurement method by measuring the difference in values from the prediction of a model as an estimate of the observed values [1]. The result of the RMSE calculation pad for this model shows 0.375. Thus, this model is said to be quite feasible to use as the RMSE value is close to 0. Mean Absolute Error (MAE) to calculate the absolute average of prediction errors regardless of the positive or negative signs [21]. MAE results show 0.302. MAE results show 0.302. use Mean Absolute Relative Error (MARE) to evaluate the average of the differences between the observed values and the predicted values. MARE results showed 45.94%.
As a form of implication of the results of this study, the machine learning model that is built can be applied to educational problems. Machine learning is one of the technological innovations that play a major role in artificial intelligence and human interaction. Education practitioners such as teachers, education managers need very accurate information from data processed and modeled by machine learning, so that machine learning is able to function as a good predictive tool in supporting decision making and supporting continuous improvement.
The conclusion obtained from the results of this study is that from the five variables or aspects that affect the quality of hybrid learning carried out at SMK Cendekia Cirebon City during the COVID-19 pandemic, it turns out that there are three variables or aspects that have a very strong correlation, namely teacher, motivation, and ICT support. While variables or aspects that have a correlation that is not yet strong or weak are variables or aspects of content and integrity. Model evaluation has been carried out through measuring the average level of error through RMSE, MAE, and MARE. When viewed from the day of RMSE, this multiple linear regression model can be used. Therefore, as a suggestion for further research, in order to be able to choose variables that have a very strong level of correlation with predicted variables so that it will affect the performance of the model developed.
SMK Cendikia Cirebon City can use this machine learning model for measurement purposes other than hybrid learning on several other aspects of learning quality, in addition, it can also be applied to other subjects that use the same learning method.
Another recommendation that can be submitted for further research is that it is necessary to select attributes based on a correlation matrix that has a strong correlation between independent attributes and dependent attributes before modeling, it is expected that this stage will affect the performance of the regression model.
For future research, it is hoped that it can prepare as well as possible related to research instruments, measurement methods to be carried out, as well as the availability of data to be better modeled.
A word of gratitude was conveyed to the Directorate General of Higher Education of the Ministry of Education and Culture, Research and Technology for supporting from the aspect of financing through the Scientific Research Grant Program for year 2022.
[1] Zhang, X. (2021). Regression analysis of general education for equestrian professionals in colleges and universities based on IEO model. In 2021 International Conference on Health Big Data and Smart Sports (HBDSS), pp. 39-44. https://doi.org/10.1109/HBDSS54392.2021.00016
[2] Khairiawati, L. (2021). Spin jurnal kimia and pendidikan kimia dampak pembelajaran daring terhadap psikologi belajar siswa sma/smk sebagai efek pandemi COVID-19 di lingkungan karang buaya pagutan timur. SPIN, 3(2): 154-164. https://journal.uinmataram.ac.id/index.php/spin/article/view/4250
[3] Wulan, R., Saputra, S., Bachtiar, Y. (2022). Formulasi hybrid model pembelajaran virtual dalam masa transisi menuju new normal pandemi COVID 19. Jurnal PkM Pengabdian kepada Masyarakat, 4(6): 594-601. http://dx.doi.org/10.30998/jurnalpkm.v4i6.10228
[4] Prasetio, T. (2022). Umpan balik pada model pembelajaran hybrid mata kuliah ekonomi di masa pandemi COVID-19. Perspektif: Jurnal Ekonomi dan Manajemen Akademi Bina Sarana Informatika, 20(1): 90-98. https://doi.org/10.31294/jp.v20i1.12503
[5] Sumardiana, B., Fergina, S., Nurmala, S., Nanda, T.S., Oktaviani, N.N. (2022). Penerapan hybrid learning system di era pandemi COVID-19 sebagai upaya untuk mewujudkan hak belajar anak berdasarkan Undang-Undang Sisdiknas di Desa Padasugih Brebes. Jurnal Pengabdian Hukum Indonesia (Indonesian Journal of Legal Community Engagement) JPHI, 5(1): 10-22. https://doi.org/10.15294/jphi.v5i1.49910
[6] Gultom, J.R., Sundara, D., Fatwara, M.D. (2022). Pembelajaran hybrid learning model sebagai strategi optimalisasi sistem pembelajaran di era pandemi COVID-19 pada perguruan tinggi di jakarta. Mediastima, 28(1): 11-22. https://doi.org/10.55122/mediastima.v28i1.385
[7] Du, L., Zhao, L., Xu, T., Wang, Y., Zu, W., Huang, X., Nie, W., Wang, L. (2022). Blended learning vs traditional teaching: The potential of a novel teaching strategy in nursing education-a systematic review and meta-analysis. Nurse Education in Practice, 63: 103354. https://doi.org/10.1016/j.nepr.2022.103354
[8] Li, L., Rong, M., Zhang, G. (2015). An Internet of Things QoE evaluation method based on multiple linear regression analysis. In 2015 10th International Conference on Computer Science & Education (ICCSE), Cambridge, UK, pp. 925-928. https://doi.org/10.1109/ICCSE.2015.7250382
[9] Elgohary, M., Palazzo, F.S., Breckwoldt, J., Cheng, A., Pellegrino, J., Schnaubelt, S., Greif, R., Lockey, A. (2022). Blended learning for accredited life support courses–A systematic review. Resuscitation Plus, 10: 100240. https://doi.org/10.1016/j.resplu.2022.100240
[10] Marie, S.M.J.A. (2021). Improved pedagogical practices strengthens the performance of student teachers by a blended learning approach. Social Sciences & Humanities Open, 4(1): 100199. https://doi.org/10.1016/j.ssaho.2021.100199
[11] Arsad, P.M., Buniyamin, N. (2013). Prediction of engineering students' academic performance using Artificial Neural Network and Linear Regression: A comparison. In 2013 IEEE 5th Conference on Engineering Education (ICEED), pp. 43-48. https://doi.org/10.1109/ICEED.2013.6908300
[12] Sudrajat, D., Dana, R.D., Rahaningsih, N., Dikananda, A.R., Kurnia, D.A. (2019). Clustering student’s satisfaction in complex adaptive blended learning with the six value system using the K-means algorithm. Universal Journal of Educational Research, 7(9): 1990-1995. https://doi.org/10.13189/ujer.2019.070920
[13] Prion, S.K., Haerling, K.A. (2020). Making sense of methods and measurements: Simple linear regression. Clinical Simulation in Nursing, 48: 94-95. https://doi.org/10.1016/j.ecns.2020.07.004
[14] Huang, C.H., Hsieh, S.H. (2020). Predicting BIM labor cost with random forest and simple linear regression. Automation in Construction, 118: 103280. https://doi.org/10.1016/j.autcon.2020.103280
[15] Jain, S., Rathee, S., Kumar, A., Sambasivam, A., Boadh, R., Choudhary, T., Kumar, P., Singh, P.K. (2022). Prediction of temperature for various pressure levels using ANN and multiple linear regression techniques: A case study. Materials Today: Proceedings, 56: 194-199. https://doi.org/10.1016/j.matpr.2022.01.067
[16] Yang, L. (2021). Research on quantitative evaluation method of teachers based on multiple linear regression. In 2021 13th International Conference on Measuring Technology and Mechatronics Automation (ICMTMA), pp. 858-862. https://doi.org/10.1109/ICMTMA52658.2021.00196
[17] Studer, S., Bui, T.B., Drescher, C., Hanuschkin, A., Winkler, L., Peters, S., Müller, K.R. (2021). Towards CRISP-ML (Q): A machine learning process model with quality assurance methodology. Machine Learning and Knowledge Extraction, 3(2): 392-413. https://doi.org/10.3390/make3020020
[18] Lee, P.Y., Loh, W.P., Chin, J.F. (2017). Feature selection in multimedia: the state-of-the-art review. Image and Vision Computing, 67: 29-42. https://doi.org/10.1016/j.imavis.2017.09.004
[19] Martínez-Plumed, F., Contreras-Ochando, L., Ferri, C., Hernández-Orallo, J., Kull, M., Lachiche, N., Ramírez-Quintana, M.J., Flach, P. (2019). CRISP-DM twenty years later: From data mining processes to data science trajectories. IEEE Transactions on Knowledge and Data Engineering, 33(8): 3048-3061. https://doi.org/10.1109/TKDE.2019.2962680
[20] Nargesian, F., Samulowitz, H., Khurana, U., Khalil, E.B., Turaga, D.S. (2017). Learning feature engineering for classification. In International Joint Conferences on Artificial Intelligence Organization, 17: 2529-2535. https://doi.org/10.24963/ijcai.2017/352
[21] Kayri, M., Kayri, I., Gencoglu, M.T. (2017). The performance comparison of Multiple Linear Regression, Random Forest and Artificial Neural Network by using photovoltaic and atmospheric data. In 2017 14th International Conference on Engineering of Modern Electric Systems (EMES), Oradea, Romania, pp. 1-4. https://doi.org/10.1109/EMES.2017.7980368