Amel Behaz![]() | Hamouma Moumen*
| Hamouma Moumen*![]() | Wafa Nouari
| Wafa Nouari![]()
© 2023 IIETA. This article is published by IIETA and is licensed under the CC BY 4.0 license (http://creativecommons.org/licenses/by/4.0/).
OPEN ACCESS
The involvement of teaching videos increases the learners’ psychological stimulation during the learning process. In fact, this type of resource can facilitate comprehension by approaching the content at the learners own pace and coming back to it as many times as necessary. In this particular case, the possibility of keeping a trace of video playing will be considered for the teacher an important asset in monitoring the learning progress of the learners. The objective of our work is to analyze the learner traces when he/she is playing a video. We propose usable restitutions to improve the online learning. Among these restitutions, we suggest to the teacher groups of learners who will be able to work together since they have the same video playing strategies. Throughout this analysis, the results are from a specific case study on which we applied unsupervised classification methods to identify groups of learners with similar profiles.
learning analytics, learner profile, educational data mining, clustering trace analysis
Digital technologies continue to display an increasingly important role in education: digital textbooks, learning games, e-learning, MOOC, etc. These new Digital technologies can help us make teaching engaging and creative. They have become a necessity to guarantee learning. For example, during the COVID-19 pandemic, countries that lacked digital technology infrastructure experienced disruptions and learning losses. Thus, the use of these technologies offers a potential on the performance of learners. Today, in addition to the increased learning needs, the possibility of distance learning is a decisive advantage [1]. Learning analytics can improve learning practice by transforming the ways we support into learning processes. Historically, learning analytics has emerged as a promising area of research that extracts useful information from educational databases to understand students’ progress and performance. Today, the Web is gradually replacing the amphitheater and confidently teaching online video courses with entertainment. Thus, such success has led to a pedagogical revolution since learners are no longer rushing to their lecture halls yet eager to watch online videos courses that eventually pose new pedagogical challenges. Actually, this pedagogical strategy can pave the way for the teacher to keep a trace of video playing in monitoring the learners’ learning progress. For example, a teacher can use it to personalize a learning path. A learner can also visualize his/her learning line and positioning in relation to other learners. Also, a researcher will be able to develop these traces in order to produce new knowledge and provide feedback relevant or diagnostic to assist the teacher in the course.
Today, learning institutions seek ways to collect, manage, analyze and exploit data from learners for the facilitation of learning processes. There are two types of data learners: qualitative data which correspond to direct answers, forms, or other traces which correspond to all interactions data with the learning environment. Among the traces we can cite the consultation time of course pages, logs on pages, quiz attempts and score.
We are interested exactly in the interactions’ traces playing the video courses by the learners. This information will allow teachers to detect difficulties of assimilation and monitor the behavior of their learners. However, it is a challenge that we must take up to optimize the lessons as well as possible and improve the learners’ paths while learning.
Teachers need tools to improve monitoring learners and understanding their behaviors. The tools collect information from learners and tutors (teachers) and use it in their programs to track learning progress. Therefore, these tools must allow clear and widely tested and accessible visualizations. Analytical data from monitoring of reading of resources can be used to guide learners’ progress towards the goals set: Monitoring and analysis, Prediction and intervention, Tutoring, and mentoring (coaching), Monitoring and feedback, Adaptation, Personalization, recommendation, and Reflection [2].
We have noticed some disengagement among learners during distance learning activities. Therefore, the implementation of a new pedagogical approach is necessary to improve the involvement of these learners during the learning process. For example, we suggest groups of learners who can work together in practical activities. This from the analysis of the traces of the learners during an activity.
In this paper, our goal is to study and improve the way learner behavioral profiles are return to teachers. We will keep in graphs traces of pedagogical online video courses, and through these graph’s data we apply two unsupervised classification methods to identify groups of learners with similar profiles.
The objective of our work is to analyze traces of video playing in order to offer the teacher restitutions that he/she can use in face to face sessions.
The rest of the paper is organized as follows: The second section, describes an overview of the most relevant contributions in the analysis of learner traces for usable returns. The third section, presents the adopted methodology that we have followed throughout the results of the analytical data collected. By applying some unsupervised classification methods, we were able to identify groups of similar profiles. The fourth section describes an experiment using quizzes which led us to make a comparison with classification methods adopted. Thus, we can describe the characteristics of each group of learners with similar profiles. Our conclusions and some perspectives regarding this study are drawn in the fifth and the final section.
The study of the profiles deduced by the different clustering algorithms led us to identify three groups of similar profiles: a group of fast learners with a good test score, another group of slower learners with an average test score, and finally a group of very slow learners with poor test scores.
We must focus on the learning analytics (LA) and the methods that harness educational data sets to support the learning process.
2.1 Learning analytics and educational data mining
We must focus on the learning analytics (LA) and the methods that harness educational data sets to support the learning process.
When learners interact with learning environments often leave. These generated data have been an increasing interest in the automatic analysis of educational data, an area of research recently referred to as learning analytics (LA).
In the last few years, a crucial debate has persisted on the definition of the term "learning analytics" since that of George Siemens in 2010 [3] and slightly revised in 2011 [4] others have given slightly different definitions like Boyer [5] or Rustici [6] (no definition is mentioned) and finally The independent UK education organization JISC gives the following definition: “Learning analytics refers to the measurement, collection, analysis and reporting of data about the progress of learners and the contexts in which learning takes place” [7].
In learning environments, the analysis of the collected data include time online, total number of visits, number of visits per page, distribution of visits over time, frequency of learner's postings/replies, and percentage of material read. Different tools provide basic statistics of the learners' interaction with the system. These reporting tools often generate simple statistical information such as average, mean, and standard deviation.
Educational Data Mining (EDM) is an emerging discipline area, in which methods and techniques for exploring data originating from various educational information systems have been developed [8]. EDM is both a learning science, as well as a rich application area for data gathering, due to the growing availability of educational data. EDM contributes to the study’s settings and how students learn. It enables data-driven decision making for improving the current educational practice and learning material [9].
EDM is defined as an area of research which involves:
The work of Siemens and Baker [10], and Romero and Ventura [11] provides an overview of the research techniques applied in the two (EDM) and (LA) communities.
The main difference between the LA and EDM is the production targets: for EDM the algorithms and tools produced are mainly used by the machine while the LA tools are primarily intended for human users [12].
Our work is in the field of LA, since the main purpose is to equip the teacher here to determine the groups of learners and not to recommend solutions in which the system intervenes itself with the groups of learners.
2.2 Monitoring and analysis in educational video
Depositing an educational video type resource increases and stimulates the learning process among learners. In fact, this type of resource can facilitate comprehension and interaction activities through better and direct addressing the content according to the learner’s rhythm of understanding, and returning to it as often as necessary. In this case, the ability to keep tracking of video playing will be considered an additional asset in monitoring learner’s learning progress.
Indeed, the teacher by his/her act of training would like to know the degree of assimilation of his/her video by the learners themselves and also know-how this resource was used, i.e., what were the strategies playing video by the learner and to verify his comprehension. We must try to keep tracking playing videos since it is our objective in this paper. Analyzing learner actions and monitoring in video courses can help teachers for example to detect and identify the at-risk learners patterns and make decision on the future design of the learning activity. Jaouedi et al. [13] explains that human activity and the tracking motion are all clues that facilitate the analysis of human behavior to classify and recognize human action. Traces can be utilized to provide recommendations based on past experiences [14] or adaptive feedback in real time [15].
They can also allow the detection of stall in MOOCs [16] or face-to-face, such as [17] which describes the impact of predictive analytics on learning processes.
In our work, we do not seek to predict learner performance but we focus on identifying groups of students from similar profile.
2.3 Unsupervised classification methods
Automatic classification is the task of grouping, in an unsupervised way, a set of objects or more broadly of data, in such a way that the objects are in the same group (called a cluster) are closer to each other than those in other groups. This is the main task of exploratory data, and a statistical data analysis technique in many fields, including machine learning, pattern recognition, information recovery, etc.
Unsupervised classification algorithms are often used to study data for which little information is available.
Unsupervised learning consists of inferring knowledge about classes based only on learning samples, without knowing the classes they belong to.
We describe two unsupervised classification algorithms used in our approach. CAH (algorithm and K-means algorithm).
2.3.1 CAH algorithm
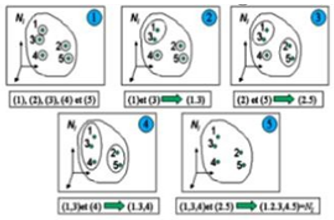
CAH algorithm (Figure 1) is a procedure that consists of the following steps:
Input: dataset (XI)
Output: an indicator of group membership of individuals
UNTIL
All the objects are gathered in a unique group
Figure 1. CAH algorithm of 5 individuals
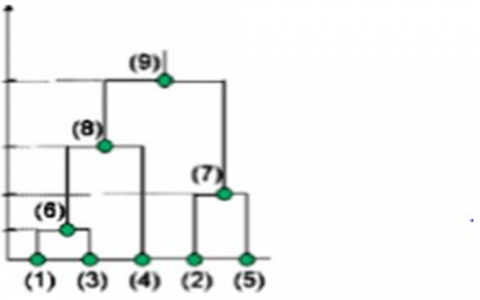
Most works using hierarchical clustering employ one of the four popular agglomerative methods, namely: the single linkage method, the average linkage method, the complete linkage method and Ward’s method. The goal of these methods is to represent the proximities, or the dissimilarities, between objects as a tree where the objects are situated at the end of the branches, generally at the bottom of the graph (Figure 2). The junctions of the branches are called the nodes of the tree; the node levels are supposed to represent the intensity of the resemblance between the objects joined one clusters [18].
Figure 2. Dendrogram resulting from a hierarchical clustering program
2.3.2 k-means algorithm
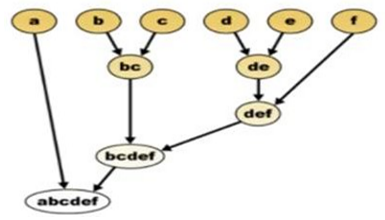
The k-means algorithm developed by McQueen in 1967, one of the simplest unsupervised learning algorithms, called the moving center algorithm, assigns each point in a cluster whose center (centroid) is closest. The center is the average of all the points in the cluster, its coordinations are the arithmetic mean for each dimension separately from all the points in the cluster i.e., each cluster is represented by its center of gravity. To better understand the mechanism, we can represent it with a simple diagram (Figure 3).
Figure 3. K-means diagram
At the beginning, each letter is considered as a cluster then we group them together according to their proximity (similarity) to form at the end only one group: abcdef. The k- means algorithm is as follows:
Start
End
These methods construct k classes from a set of n individuals, while minimizing the quantity:
$\sum_{r=1}^k \sum_{x_i \in c r}\left(x_i-G r\right)^2$ (1)
Cr is the class number r
Xi is an individual in a class
Gr is the center of class Cr
Figure 4. K-means Algorithm for K=3 [19]
Several works use classification techniques to provide feedback at the scale of a group of learners (Figure 4). Sachan et al. [20] analyze the patterns of interaction between users to identify communities in social networks. Others [21] use techniques to automate learner assessments to identify groups that require teacher intervention. Group similar students according to their learning trajectories in order to predict their performance [22].
Clustering methods can be used in learning to improve prediction performance in the system or simply to better understand the behavior of a learner [23], then characterizing these clusters [24].
In our case study, we seek to identify groups of learners based on video playing data. We used unsupervised classification methods to group learners of similar profile into (non-predefined) classes. Indeed, the data available, relating to readings, does not contain label type information allowing a supervised classification to be carried out.
In this section we present our proposal to describe a new approach to the support and monitoring learning of learners engaged in an activity. The approach we propose makes it possible to produce a behavioral profile based on the automatic analysis of video playing.
The originality of our study compared to the literature review presented above lies in:
3.1 Collected data and visualization
The data collected comes from the analysis of learners' playing on the videos of a MOOC entitled "Spice up your English". This MOOC had been initially designed for beginners who already have some knowledge of the English language.
We took a sample of 40 Masters level learners for a section that we have at our disposal. The choice of a single section is essential in our case because we want to make groups within the same section and not between learners from different sections.
The videos are distributed to the 40 learners. For each learner and each video, we manually collect the data in a table. This data is: the number of pauses taken, the duration of each pause, the duration of the pause and the number of returns to the beginning of the video. Other parameters are calculated, namely the time elapsed between pauses and the total reading time.
The analyzed data consists of a set of traces obtained from the learners' videos playing.
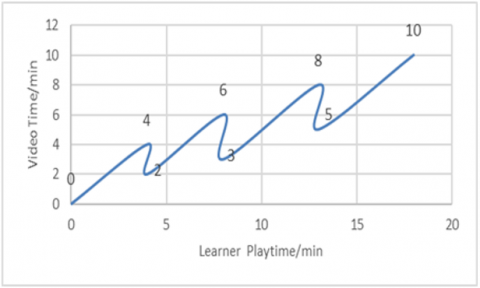
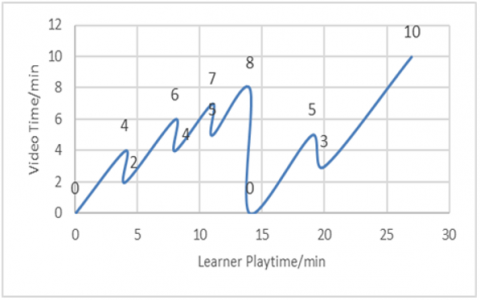
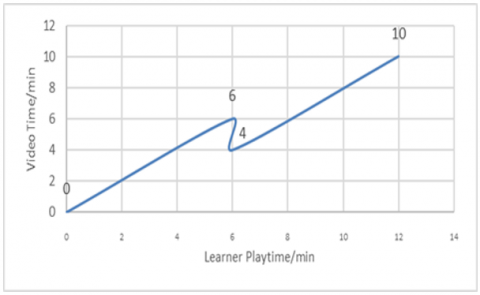
Figures 5, 6 and 7 show the reading graphs of three learners who viewed the video of 10 minutes.
The Figure 5 shows that the 1st learner X practiced 3 pauses time: the first at the 4 min, the second at the 6 min, and the third at the 8 min. So, the learner went back in the 8th min video that its total playtime is 18 minutes.
Figure 6 shows that the 2nd learner Y practiced 5 pause time the first at the 4 min, the second at the 6min, the third at the 7 min, the fourth at the 8min, then the learner made only one return at the beginning of the video, and finally a fifth pause time at 5 min, so the total playing time is 26 minutes.
Figure 7 shows that the 3rd learner Z practiced only one break at the 6th min, he backtracked in the video in 2nd min, without forgetting that the graph also shows that this learner does not make any return at the beginning of the video.
Representing the results collected with this visual format can facilitate both of interpretation and analysis of the educational data. The teacher can easily follow the navigation of his learners within the videos. He will be able to know how long time the learner plays the video compared to the total time of the video timeline.
He will also be able to know how many times the learner made breaks or gone back and forth in the video. So, these graphs will give teachers an overview of how the different video courses are played.
These analyzes are carried out to get as closer as possible to the learner by capturing the slightest interaction in the space of a video playing: a click, a pause, a return are all traces to inform the learning process.
Figure 5. Scenario of learner X
Figure 6. Scenario of learner Y
Figure 7. Scenario of learner Z
3.2 Data clustering
For this step, we have been using two clustering methods to create small homogeneous groups and identify learners of similar profile. In our case, we know that the clustering will try to group a set of learners and find whether there is some relationship between the learners. The advantage of clustering approaches is that they provide knowledge that can be easily exploited by teachers, since they do not involve action with each learner but rather at the level of a few groups.
Our aim is to offer the teacher a possible distribution of the learners into different groups. These feedbacks (feedback that can be used by the teacher in the context of face-to- face training) take into consideration understanding the behaviour’s learners via the videos experience. We start by creating a large number of clusters with the CAH method. Then we use the center of these clusters as new individuals to launch a K-means. We reduce the size of the data which will make it possible to calculate the CAH and we also reduce calculation time.
3.2.1 Hierarchical clustering
Hierarchical clustering is a cluster analysis method, which produce a tree-based representation (i.e.: dendrogram) of a data. Objects in the dendrogram are linked together based on their similarity.
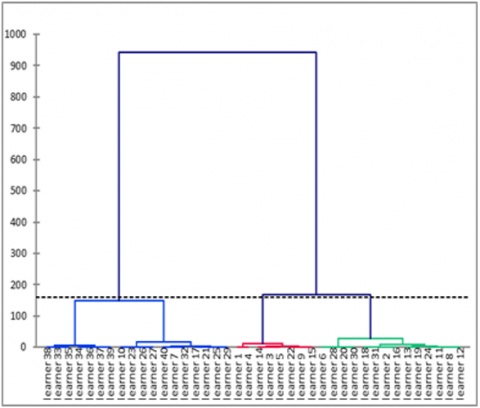
Figure 8. CAH dendrogramme
At the top of the tree (Figure 8), there is only one group. The whole population is united in one group. At the bottom of the tree, there are n groups because each individual constitutes a group. Between these two ends, there are intermediate groups. The population is partitioned into a set of groups. The number of groups is set by the level of the hierarchy moving up the vertical axis.
The number of clusters then corresponds to the number of vertical lines crossed by the horizontal section of the dendrogram. In our case, the horizontal cut corresponds to the two red lines. There are 3 vertical lines crossed by the cut. We deduce that the optimal number of clusters is 3.
This diagram suggests a division into three clusters.
Cluster 1 contains 8 learners who have the lowest number of breaks and the shortest videos playing timing.
Cluster 2 is made up of 12 learners who also have the lowest number of breaks but with excessively long videos playing timing.
Finally, cluster 3 is made up of 20 learners who have the greatest number of breaks and with too long reading times compared to the videos playing timing.
When we work through the CAH method, we get a partition that makes the similar elements of one group that are different from other groups.
3.2.2 K-means
We started from the results obtained by CAH, which proposes an optimal number of 3 clusters to maximize the gain in inertia and to compare more easily the results obtained by the two methods.
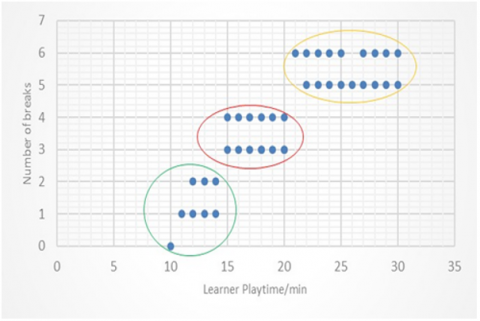
The distribution of learners in the three groups by K-means is (Figure 9) close to the results obtained by CAH.
Indeed, K-means clusters 1, 2 and 3 are almost similar to clusters 1,2 and 3 obtained by CAH.
We notice a strong correspondence; indeed, the clusters are almost identical. In all cases, it is interesting to notice that the two algorithms manage to identify the same structure in the data.
Figure 9. Scatter plots of K-means classes
3.2.3 Discussion
The study of the profiles deduced posteriori from the groups identified by the two clustering algorithms leads us to identify three groups of similar profiles: a group of learners, quick in the playing videos with a low number of pauses, another group of learners who are slower in reading videos but with fewer pauses. the last group of learners who are slower in playing videos with too many pauses. The results obtained are generally close and the groups identified are consistent.
Table 1. Learners clusters comparison
|
Cluster (Nb learners) |
Cluster 1 (8) |
Cluster 2 (12) |
Cluster 3 (20) |
|
Average playing time |
13 min |
18 min |
28 min |
|
Average number of breaks |
1 |
3 |
6 |
Establishing classes of learners (Table 1) according to their actual and observable behaviors by the traces can support effective learning in various ways. These include:
One part of the analysis of the learners work was carried out using the quizzes to assess their scores and compare the results obtained by the clustering methods. For each class of learners, we evaluate the good, average and bad scores. The idea is to know the score of each learner compared to his class.
We have offered exercises for the 40 learners in the same section. The exercises are spread over six quizzes; each quiz includes 20 questions so a total of 120 questions covering the maximum of skills acquired on the videos viewed. To build a profile, we considered the following two criteria: the final score obtained for each learner on all the quizzes and the average time to answer.
The data of these results will allow us to compare the characteristics of the learners after clustering compared to the scores by quizzes.
4.1 Results
The figures show the scores of the learners. Results are classified by students’ grades for each class. X axes presents the learners’ class, and Y axes is how score students give that.
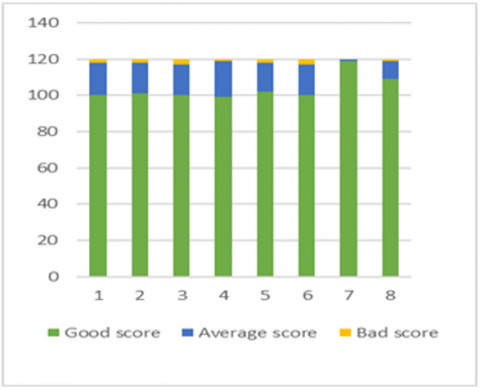
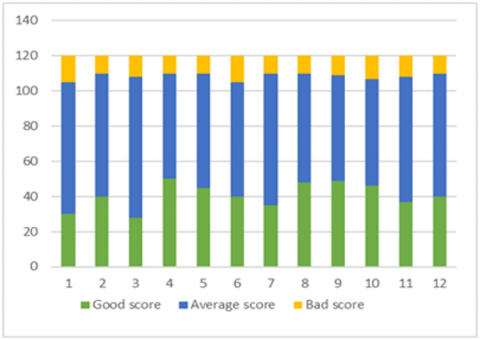
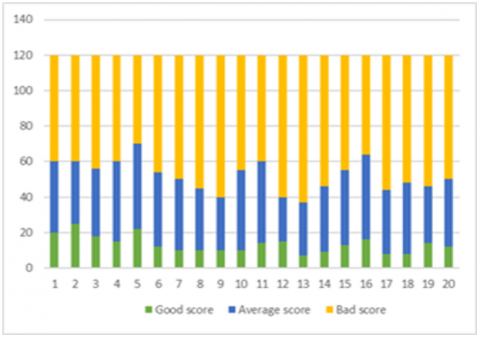
Figures 10, 11 and 12 represent the distribution of learners in the three clusters according to good, average and bad score (good in green, medium in blue, and bad in yellow).
The results in Figure 10 show that almost all of the first learners in the 8 classes score very well on 100 correct questions. They are the same learners who achieved a very short video playback time with fewer pauses.
Figure 10. Class 1 results
The learners of class 2 shown in Figure 11 have an average score since their correct answers do not exceed 50. The 12 learners in this class take more time to watch the video lessons but the number of breaks remains quite low.
Finally, the 20 learners in class 3 are the weakest. They are represented in Figure 12 with very few correct answers and too long video reading times with many pauses.
The study of the profiles deduced a posteriori from the groups identified by the different clustering algorithms and leads the researchers to identify three groups of similar profiles: a group of learners, fast with a good score on the tests, another group of slower learners with an average score in tests, and finally a group of very slow learners with a bad score in tests (Table 2).
Figure 11. Class 2 results
Figure 12. Class 3 results
Table 2. Characteristics of similar groups
|
Class (Nb learners) |
Class 1 (8) |
Class 2 (12) |
Class 3 (20) |
|
Average percentage of Questions with good score |
86% |
31% |
5% |
|
Average percentage of questions with medium score |
11% |
56% |
20% |
|
Average percentage of questions with bad score |
3% |
13% |
65% |
4.2 Interpretation
The objective of this case study is to illustrate our methodology, analyze, and restore the results to assist the teacher in the learning process. We focus on clustering methods which allow the extraction and return of knowledge that can be used in class by the teacher.
This study led us to note that the clustering techniques used provide results that can be useful to teachers, and also these methods have given us results comparable to the results provided by the tests.
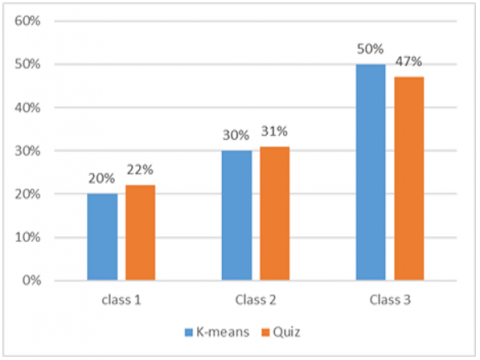
The results provided by the K-means method for example are very close to the results of the quizzes. We clearly notice a distribution in 3 classes and the percentages are very close to each other in Figure 13.
To sum up, we conclude that tests results are generally similar by the clustering methods and the groups identified are consistent.
These results (good fast, medium slow, and bad slow) may seem "obvious", but this is due to the low number of data dimensions. This study ends up to say that even simple clustering techniques provide useful results that are comparable to the quiz ones.
This study led us to note that even simple clustering techniques provide results that can be useful to teachers, and that they gave us here comparable but very close results, with a preference for the CAH.
Figure 13. Distribution of learners
In the increasingly competitive and changing world, efficient education system that drives the human development in the country is the key to a nation’s progress.
The education providers like higher learning institutions must focus on learner success and design instruction that considers the individual differences of the learners.
The study in this paper is based on the analysis traces playing videos of 40 learners in our higher institution. The main research question is to differentiate learners with similar profiles while the focus is on existing clustering methods. The results were examined with validated quiz tests. Despite the fact that the number of learners is reduced, this experience indicates that there is a move towards a deeper understanding of learning and improved support in teaching.
We discussed the interest of the analysis of traces and their different possible forms of exploitation. We focused on clustering methods that allow to extract and restore knowledge usable by the teacher. Our objective is to propose a possible distribution of learners into groups of similar profile.
The results of the experiments show us a great efficiency of this proposed approach. The implications of this study are manifold, namely: Reduce the number of learners who drop out of learning, Compute predictions on users in a cluster with similar learning behaviors (same learning style) and avoid recommending resources that are not important.
In the future, on the basis of richer data, we recommend to improve and diversify the feedback to teachers. Also, it is important to think about how to allow the teacher to visualize and understand these results, which are not yet sufficiently accessible to non- specialists. In the short term, we will be able to apply process mining techniques on learning and assessment data to study learner journeys in order to provide personalized journeys (and identify individual learner profiles). In the long term, we also plan to exploit social interactions between learners using social network analysis techniques.
[1] Roy, D. (2015). Optimisation des parcours d’apprentissage à l’aide des technologies numériques. Doctoral dissertation, CNAM, Paris.
[2] Chatti, M.A., Dyckhoff, A.L., Schroeder, U., Thüs, H. (2012). A reference model for learning analytics. International Journal of Technology Enhanced Learning, 4(5-6): 318-331. https://doi.org/10.1504/IJTEL.2012.051815
[3] Siemens, G. (2010). What are learning analytics. http://www.elearnspace.org/blog/2010/08/25/what-are-learning-analytics/, accessed on 12 Jan., 2020.
[4] Siemens, G. (2011). Learning and Academic Analytics. http://www.learninganalytics.net/, accessed on 12 Jan., 2020.
[5] Boyer, A. (2015). Learning analytics: promesses et réalités. http://www.sup-numerique.gouv.fr/cid94948/learning-analytics-promesses-et-realites.html accessed on 12 Jan., 2020.
[6] Rustici, M. (2016). An Intro to Learning Analytics. https://www.watershedlrs.com/blog/an-intro-to- learning-analytics, accessed on 20 April 2020.
[7] JISC. (2017). Learning Analytic in Higher Education. https://www.jisc.ac.uk/reports/learning- analytics-in-higher-education, accessed on April 6, 2020.
[8] Djoudi, M., Luengo, V., El Kechaï, H., Cerisier, J.F., Maugard, E., Cherigny, F., Champalle, O., Iksal, S., Beust, P. (2018). Learning Analytics: terminologie du Learning Analytics (Doctoral dissertation, Direction du Numérique pour l’Éducation, ministère de l’Enseignement supérieur de la Recherche et de l’Innovation (France)).
[9] Calders, T., Pechenizkiy, M. (2012). Introduction to the special section on educational data mining. Acm Sigkdd Explorations Newsletter, 13(2): 3-6. https://doi.org/10.1145/2207243.2207245
[10] Siemens, G., Baker, R.S.D. (2012). Learning analytics and educational data mining: towards communication and collaboration. In Proceedings of the 2nd International Conference on Learning Analytics and Knowledge, pp. 252-254. https://doi.org/10.1145/2330601.2330661
[11] Romero, C., Ventura, S. (2013). Data mining in education. Wiley Interdisciplinary Reviews: Data Mining and Knowledge Discovery, 3(1): 12-27. https://doi.org/10.1002/widm.1075
[12] Harrak, F., Bouchet, F., Luengo, V. (2019). From student questions to student profiles in a blended learning environment. Journal of Learning Analytics, 6(1): 54-84.
[13] Jaouedi, N., Boujnah, N., Bouhlel, M.S. (2020). A new hybrid deep learning model for human action recognition. Journal of King Saud University-Computer and Information Sciences, 32(4): 447-453. https://doi.org/10.1016/j.jksuci.2019.09.004
[14] Hug, C., Deneckère, R., Salinesi, C. (2012). Map-TBS: Map process enactment traces and analysis. In 2012 Sixth International Conference on Research Challenges in Information Science (RCIS), pp. 1-6. https://doi.org/10.1109/RCIS.2012.6240435
[15] Conati, C., Fratamico, L., Kardan, S., Roll, I. (2015). Comparing representations for learner models in interactive simulations. In: Conati, C., Heffernan, N., Mitrovic, A., Verdejo, M. (eds) Artificial Intelligence in Education. AIED 2015. Lecture Notes in Computer Science(), vol. 9112. Springer, Cham. https://doi.org/10.1007/978-3-319-19773-9_8
[16] Bani, I. (2014). Analysis of traces of learning and inter-learner interactions in a MOOC. Lip6 thesis, Pierre and Marie Curie University. Bentley, R.E. (1998). Handbook of Temperature Measurement Vol. 3: The Theory and Practice of Thermoelectric Thermometry. Springer Science & Business Media.
[17] ECAR Working Group. (2015). The Predictive Learning Analytics Revolution: Leveraging Learning Data for Student Success. EDUCAUSE.
[18] Roux, M. (2015). A comparative study of divisive hierarchical clustering algorithms. arXiv preprint arXiv:1506.08977. https://doi.org/10.48550/arXiv.1506.08977
[19] Chen, Y.Z., Lai, Y.C. (2016). Universal structural estimator and dynamics approximator for complex networks. arXiv preprint arXiv:1611.01849. https://doi.org/10.48550/arXiv.1611.01849
[20] Sachan, M., Contractor, D., Faruquie, T.A., Subramaniam, L.V. (2012, April). Using content and interactions for discovering communities in social networks. In Proceedings of the 21st international conference on World Wide Web, pp. 331-340. https://doi.org/10.1145/2187836.2187882
[21] Floryan, M., Dragon, T., Basit, N., Dragon, S., Woolf, B. (2015). Who needs help? Automating student assessment within exploratory learning environments. In: Conati, C., Heffernan, N., Mitrovic, A., Verdejo, M. (eds) Artificial Intelligence in Education. AIED 2015. Lecture Notes in Computer Science(), vol 9112. Springer, Cham. https://doi.org/10.1007/978-3-319-19773-9_13
[22] Käser, T., Busetto, A.G., Solenthaler, B., Kohn, J., von Aster, M., Gross, M. (2013). Cluster-based prediction of mathematical learning patterns. In: Lane, H.C., Yacef, K., Mostow, J., Pavlik, P. (eds) Artificial Intelligence in Education. AIED 2013. Lecture Notes in Computer Science(), vol. 7926. Springer, Berlin, Heidelberg. https://doi.org/10.1007/978-3-642-39112-5_40
[23] Davoodi, A., Kardan, S., Conati, C. (2013). Understanding Users’ Interaction Behavior with an Intelligent Educational Game: Prime Climb. In AIED 2013 Workshops Proceedings Volume 2 Scaffolding in Open-Ended Learning Environments (OELEs): 9.
[24] Bouchet, F., Harley, J.M., Trevors, G.J., Azevedo, R. (2013). Clustering and profiling students according to their interactions with an intelligent tutoring system fostering self-regulated learning. Journal of Educational Data Mining, 5(1): 104-146.