Yahia Belayadi* | Abdallah Khababa | Abdelouahab Attia | Sofiane Maza
© 2022 IIETA. This article is published by IIETA and is licensed under the CC BY 4.0 license (http://creativecommons.org/licenses/by/4.0/).
OPEN ACCESS
Examining information concerning users of Location-Based Social Networks (LBSNs) and predicting a user's activity becomes very difficult to process. However recently, biclustering algorithms have shown their effective plan to uncover sub-matrices showing unique patterns. In this paper, we present a novel scheme based on biclustering algorithms with the Apriori algorithm to extract association rules from LBSNs data The idea focuses on generating a model that explains and analyzes the user's activities to get a lot of information about his behavior. Next, we select the sub-matrices using the BCX motif algorithm. After that, the Apriori algorithm is only applied to these sub-matrices, allowing for a meaningful extraction and useful rules for classifying user profiles The proposed technique is applied to a large real dataset called Gowalla. Thus, we have extracted rules such as (X→Y [support%, Confidence% and Lift]). Furthermore, we have presented a compression study of the results by biclustering the Apriori method and the Apriori algorithm. Additionally, the extracted rules provided relevant information for analyzing users’ activities. we show that biclustering with Apriori method exhibits the best performance. In summary, the model of association rule briefly described user activities and it is considered a novel tool, which can be included in the offered state-of-the-art methods.
bi-clustering, location-based social network, association rules, Apriori algorithm, Gowalla dataset
As mentioned in the abstract section, these rules are easy to follow as long as you replace the "content" without changing the "form". It is very important to create a good recommender system with higher accuracy in business applications and ultimately attract other customers to partner companies. Today, location-based social networks (LBSN) have received considerable attention. The emerging progress of the mobile device industry makes smart phones widely used everywhere in daily life. Also, due to the advent of Internet technology, the mobile phone has become a necessary tool that allows users to get information in real time.
Your smart phone can manage various life activities, including searching for interesting information like online shopping, a travel plan with GPS sensors, online education, and job search.
This explosion in the use of LBSN services makes it possible to record a large amount of mobile data with various data resources. With these resources, you can help determine users' movement patterns, recognizing and tracking their behavior along the way. Numerous LBSNs have been created for this purpose, they can be divided into collaborative filtering-based and content-based [1]. LBSN enables the sharing of services and has received a lot of attention, e.g., Gowalla [2], which is examined in detail in this paper.
Recently, LBSN merged social networks and mobile trajectory data [3]. LBSNs have experienced a great evolution, spurring millions of mobile device users to share their favorite locations with location-based content. Due to the large amount of information in LBSN, it is very important to design an efficient scheme for analyzing users’ activities. However, compared to existing works, it suffers from low veracity and efficiency, which is why data mining techniques based on representation and data modeling have been very successful in the last decade [4, 5]. However, data mining techniques have been widely used in several fields, including the semantic web [6], computer vision [7], and LBSN analysis [8]. Data mining methods allow you to generate and build models based on existing data named training data. These models are valuable data representation, discovery, and predictive analysis tools [9]. In summary, we have proposed a new method for user activity analysis based on biclustering and association rules. First, the biclustering method is used before extracting rules to find sub-matrices of rows and columns that are as similar to each other and as different from the rest. In addition, the Apriori algorithm [10, 11] is applied to each sub-matrix to collectively describe users’ preferred locations and behaviors. In the designed framework, user comments and their movement from position (place) to position (place) complement each other. Therefore, the presented method is a powerful tool to describe and explain the heterogeneous data collected by LBSN.
In the generated model, we consider two factors of the association rules, including location and user feedback. The given model is (X→Y[support%, Confidence% and Lift]), where X and Y are the places visited by the user, while (support, trust, and lift) are measures used to evaluate an association rule.
The contributions provided in this paper are used to improve the customization of purpose recommender systems. By looking at a large number of places visited by users, we figured out how real users prefer their favorite places and should be able to make more realistic recommendations. In addition, the biclustering method reduces the study area, which improves the quality of the generated model and is used directly as a regional model within a location recommender system.
The rest of this paper is organized as follows. In Section 2, we present the relevant work. Section 3 explains the proposed methodology. The results of the experiment are given in Section 4. Finally, Section 5 is the conclusion.
The motivation of this work is to provide model-based association rules used to learn about users' activities in LBSN, which can be used for the tourist recommender system. To get good location recommendations, we need more detailed information about how users move from one location to another, what types of locations are there, and which places should be visited frequently. Recently, the global adoption of various embedded systems in mobile smartphones and the attraction of social media have spawned several works in the field of LBSN recommender systems [8].
The recommendation systems can be divided into venue categories [12, 13], next POI recommendation [14], Recurrent Neural Networks [15, 16], and Itinerary recommendations [17, 18]. A brief review of existing recommendation algorithms, Distributed Representation, Models of Neural Networks, clustering algorithms, and Prediction of Social Link and Recommendations in LBSNs are depicted as follows.
Gao et al. [14] have considered the satisfying information in LBSNs. Thus, Point of Interest (POI) recommendations are investigated with diverse sorts of content information. However, based on the sentiment of users as indicators of user interests the POI properties are predicted. For instance, Chen et al. [19] have studied the benefit of check-ins of associated users for the recommendation in LBSN.
Cai et al. [20] have designed and evaluated a novel location recommendation method named LC–G–P to deal with the poor efficiency and accuracy of the traditional recommendation system based on collaborative filtering. The designed scheme is built on community clustering and various fusion, including geographical distance, location popularity, and user characteristics.
Li et al. [21] have investigated a two-step structure for the POI recommendation problem by taking into consideration the check-in information of three kinds of friends counting location, social, and neighbouring friends. For instance, Zhao et al. [22] explain POIs with Geo-tagged Tweets.
Also, To et al. [23] have designed a model used to predict the next activity of users. The model is based on the past and current context of the users. Moreover, the model has contributed a fine tool for joining location prediction with transportation planning. Coarse-grained location types have been investigated by Likhyani et al. [24]. The idea is to explore the relationship between scattered location data and map information; this secondary information is then used to predict the location more accurately for the next visit. Although, in an emergency, Shem-Tov et al. [25] have designed a model to guide users to the best nearest friend.
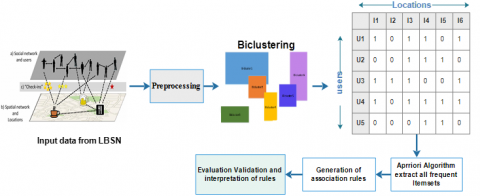
Figure 1 presents the scheme of the proposed method of extraction association rules from LBSN dataset. Therefore, the process consists of four main steps. (i) The first one is for preprocessing of the dataset (thus some operations, including treatment of null value and preparing the data matrices (user_location /user_comment)). (ii) The second step is the application of the biclustering algorithm to select revealing sub- matrices showing a unique pattern. (iii)The third step is the application of the Apriori algorithm on the sub-matrices. However, the Apriori algorithm consists of two major steps: (1) extract overall frequents itemsets, then, step (2) extracts useful association rules from the frequents itemset that are provided by step (1). (iv) The fourth step consists of visualization and interpretation of the utile extracted rules.
Figure 1. Design scheme of user activity based biclustering and association rules in LBSN Model
3.1 Location based social network
LBSN systems aim to merge online social network features and permit users to share their urban data, which enclose spatiotemporal information and social aspects, including the user’s preferences and routines [26]. Besides this process is well-known as a participatory sensor network [27], One essential point is that users can manually determine when, how, where, and what to share.
Figure 2. Illustrate an example of LBSN architecture based on the GPS features
Formally, the concept of LBSNs [28, 29] corresponds to graph G the form of a 3-tuple where V is the set of nodes e.g. users, and E refers to the set of edges that describe the social connections between users, and C is the users' check-in dataset. In Figure 2, we illustrate an example of LBSN architecture [30]. This architecture is based on the GPS features, which locates users and permits them to share spatiotemporal data such as location and location-tagged media content, for instance, texts, photos and videos. The architecture includes two layers. In the Online Social Networks (OSNs) Layer, users form their social networks, according to interactions in LBSNs, and the Physical Location Layer (PLL): Permits to users by checking in and checking-out per location-based services applications.
3.2 Association rules
The extraction association rules model between items in huge dataset has been introduced by Agrawal et al. [10], which the first algorithm is named by Apriori [11]. The extraction of association rules consists of two major steps. Step 1 is to find all frequent itemset, which have support superior or equal than the minimum thresholds defined previously and denoted as Minsupp. Step 2 generates all the association rules from frequent itemset, that is generated in step one. These rules should have confidence superior or equal than to the minimum thresholds defined previously and denoted as Minconf. Thus, a number of rules are accepted, while others are rejected by Apriori.
Assume that the association rules defined as: $(X \rightarrow Y$ [support $\%$, Confidence $\%$ and Lift]) with $X \cap Y=\emptyset$. Where $\mathrm{X}$ and $\mathrm{Y}$ are frequent itemset $\mathrm{X}$ is named the left-hand-side (LHS). While $\mathrm{Y}$ is named the right-hand-side (RHS).; whereas the support $\%$, Confidence $\%$ and Lift are measures of quality of rule which indicate the reliability, precision and validity of rule respectively [31].
These measures are calculated as follow:
$\operatorname{support}(X \rightarrow Y)=\frac{\text { numberof }(X \text { and } Y)}{\text { Total number of transaction }}$ (1)
confidence $(X \rightarrow Y)=\frac{\operatorname{support}(X \rightarrow Y)}{\operatorname{support}(X)}$ (2)
$\operatorname{lift}(X \rightarrow Y)=\frac{\operatorname{support}(X \rightarrow Y)}{\operatorname{support}(X) \times \operatorname{support}(C Y)}$ (3)
To present the pseudo code of Apriori Algorithm we need to describe these variable s: Ck refer to Candidate itemset of size k, Lk: frequent itemset of size k, D: a set of transactions and t represent one transaction. minsup is threshold of min support.
Algorithm Apriori
Input: D: a set of transactions
Minsup: threshold of min support
Output:L: the frequents Itemsets.
When we Apriori return frequent itemset it will be used by generation rules algorithm to generate a useful association rule which satisfy both minimum support and minimum confidence (minconf) the pseudo code of gen-rules Algorithms as follow:
Algorithm gen-rules:
3.3 Data initialization and preparation
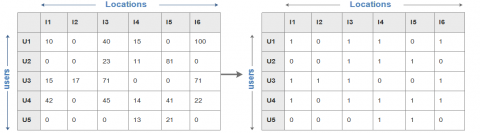
Here, we describe the step of initializing and preparing data, including user-location and user-comment matrices. Then, we apply the biclusteringalgorithm to select sub matrices with the same patterns. Finally, we apply the Apriori algorithm to extract association rules as Figure 3 illustrates the process.
(a)
(b)
Figure 3. Present the process of transformation matrices:(a) matrix for present users with location visited;(b) matrix for describe users comments
3.3.1 User-location data
Let U and L represent users and locations respectively. We define the function Fu,l for computing the frequency of a user that is to be found in location l. the Fu,l is:
$F_{u, l}=\left\{\begin{array}{l}f_{u, l} \text { number of user which } \\ \text { located in location } l \\ 0 \quad \text { otherwise }\end{array}\right.$ (4)
The biclustering algorithm provides sub matrices. Afterward, we transformed each cluster of the define user-location of binary data. Form such as sub-matrices $S M \in R^{U \times L}$:
$S M_{u, l}=\left\{\begin{array}{lc}1 & \text { if } f_{u, l} \geq 1 \\ 0 & \text { otherwise }\end{array}\right.$ (5)
where, the value SMu,l=1 refers to that the users’ u visited the location l. Likewise, a value of 0 does not locate in location l.
3.3.2 User-comment data
Let U and C denote the number of users and comments respectively. First, we compute the frequency Cu,c of each user that is made comment about check-in spot. The representation of Cu,c as:
$C_{u, c}=\left\{\begin{array}{l}c_{u, c} \text { number of comment } c \\ 0 \quad \text { otherwise }\end{array}\right.$ (6)
Then, we define the user-comment based on binary data form such as interaction matrix $M C \in R^{U \times C}$ from users and the visited places as:
$M C_{u, c}=\left\{\begin{array}{l}1 \text { if } c_{u, c} \geq 1 \\ 0 \text { otherwise }\end{array}\right.$ (7)
At this point, a value of 1 for MCu,c indicates that the user u put comment c.
3.3.3 Biclustering algorithm
Analyses of large scale LBSN data and notably spatiotemporal data need to focus on clustering algorithms. However, biclustering methods were introduced for revealing sub- matrices illustrating similar patterns. Thus, we investigate and study an algorithm named X motifs algorithm to biclustering for LBSN data. Then, the results of this method are used by the Apriori algorithm in order to provide a useful association rule with high performances.
The X motifs algorithm was introduced by Murali and Kasif [32]. Since it searches for conserved gene states, another step of pre-processing is required. Once the data matrix user location is generated, the algorithm chooses a random column noticed by (nl: refer to the number locations) then performs these steps:
Step 1. Choose an sd: Stand for subset of columns and nu: Represent a number of users. Followed by collecting all rows with equal state belongs in this subset, including the above column.
Step 2. Collect all columns where these rows (generated by step1) which have the same state.
Step 3. Return the bicluster if it has the most rows of all the bicluster found and if it is also larger than an alpha fraction of the data.
3.4 Dataset Gowalla
We have evaluated and tested the planned methodology on Gowalla datasets, which is a publicly available. Gowalla is an LBSN lunched on 2007 [33], permitting users to share their spatiotemporal information with friends through check-ins. This dataset has the largest social network of any public. Gowalla covers 30.367 geo-referenced spots of New York city and has information concerning 357,753 visits of 19,183 users. Thus, the Gowalla dataset contains the following files spots.txt, which contains information’s about spots, that have identified by ids, names, and geospatial coordinates. The users.txt file of Gowalla defines users, by ids, names, hometowns and geospatial coordinates. The highlights.txt file is a table contains the spots marked as highlights by Gowalla users, enclose spot and user ids, together with a textual description as well as the category of spot. Finally, the users-spots.txt file is a table enclosed the spots visited by Gowalla users, the spot and user ids, appear together with attribute a Boolean value that indicating if the user frequently visits the spot. Table 1 and Table 2 present the data type and categories of Gowalla respectively.
Table 1. The proprieties Gowalla dataset
|
Designation |
Number |
|
Users |
19183 |
|
Activities |
8334 |
|
Spot id |
30367 |
|
Connected hometown |
11129 |
|
Frequency cheek-in |
357753 |
|
Categories of spot or highlights.txt |
9 |
Table 2. The categories offered by Gowalla
|
No. |
Categories |
|
1 |
Architecture and building |
|
2 |
Art and culture |
|
3 |
College and education |
|
4 |
Entertainment |
|
5 |
Food |
|
6 |
Nightlife |
|
7 |
Park, nature and recreation |
|
8 |
Shopping and services |
|
9 |
Travel and lodging |
In this section, we depict the application of our proposed method on Gowalla dataset, which is illustrated above. For our implementation, the R language is used. It permits to apply the Apriori algorithm with different packages including design and display association rules as well as provide statistics on extracted rules.
The first step is data pre-processing, which focused on data processing. We remove any records that are missing or in the wrong places. Next, we create arrays named ML, and MC that contain user locations and user comments respectively. ML data indicates the sites visited by users, while MC contains information that was put by users while visiting the locations.
This is done by process (section) using Eqns. (4) and (5), the same process is done for MC (users-comments) by using Eqns. (6) and (7).
The idea is to keep whether or not this user visits or selects the location from the possible connection to a place that contains this type. Next, X motifs biclustering algorithm is applied on ML and MC matrices to extract sub matrices that show relevant motifs. Finally, the Apriori algorithm is applied on each sub matrices to generate frequent itemset with association rules.
Two kinds of experimentations were conducted, the first one is to consider the locations frequently visited to get herby Gowalla users based on the users-spots.txt file provided by the Gowalla dataset. While in the second one we have investigated the activities of users based on data given in highlights.txt offered by Gowalla services.
4.1 Experiment I association rules users-locations
In this section, we present the results that include some extracted rules with some of their plots by a given method using R language. R provides a package named “a rules” which permits to apply of several algorithms for the extraction of association rules. Also, we have to use the packages, a rule Viz [34] and vis network [35] which provides some functions permit to plot graphs, and get statistics about the number of association rules based on parameters including maxlen which indicates the length of rules (i.e. number of items), supp: support of rules and conf the confidence of rules. Besides, some plots were presented with rules analysis by graphs counting scatter plots for rules; (b) two-key plots, graphs of rules and parallel coordinate plots.
In the first step from the Gowalla database, we generate matrix user-locations (see section 2.3.1) which are then stored in a file .CSV, and then we import it by:
file<-read.csv(“filename.csv”).
In the second step, we applied the Xmotif biclustering algorithm to extract clusters. Each cluster was stored in a sub-file (.csv).
In the third step, from each cluster we extract association rules using the Apriori algorithm:
rules=Apriori (file, parameter=list (supp=α, conf=β, minlen=γ)); where α and β belong to [0,1], γ should be more.
Finally, we have selected and described some association rules based on their categories (see Table 3).
As a result, in Table 3, we have put some rules with their description.
Figure 4 presents a network graph of some rules provided by VisAR tools [36] without layouts restrictions. Also, in the above graph, the size of the nodes is based on the highest Support and the color signifies the highest Lift measure. As seen in Figure 4, the size of graph nodes is based on support levels and the color on lift ratios. The larger nodes or circles imply higher support while red nodes imply higher lift. The following lines correspond to the (LHS), and the outgoing lines characterize the (RHS) are represented by names of keywords (items).
Table 3. Some rules with descriptions
|
Rules |
Sup. |
Conf |
Lift |
Description |
|
{La.Maison.du.Chocolat}=>{Grand.Central.Terminal} |
8.21% |
100% |
9.12 |
This rules indicate that 8.21% of users of Gowalla located in Grand.Central.Terminalfavorite the La.Maison.du.Chocolat with 100% of confidence |
|
{JFK.John.F..Kennedy.International}=>{Grand.Central.Terminal} |
3.52% |
100% |
2.83 |
This rules show that 3.52% users located in Grand.Central.Terminal station came from JFK.John.F..Kennedy.International airport with 100% of confidence |
|
{Katz.s.Delicatessen,Madison.Square.Garden}=>{Empire.State.Building} |
3.57% |
100% |
9.33 |
This rules show that 3.57% users located in Katz.s.Delicatessen and Madison.Square.Garden are located in Empire.State.Building with 100% of confidence |
|
{Bloomingdale.s, George.Washington.Bridge, Grand.Central.Terminal, La.Maison.du.Chocolat, Lil..Frankie.s.Pizza}=>{Statue.of.Liberty} |
1.36% |
80% |
9.08 |
This rule show that the 1.36% of users of Gowalla prefer {Bloomingdale.s,George.Washington.Bridge, Grand.Central.Terminal, La.Maison.du.Chocolat, Lil..Frankie.s.Pizza} places are visitor of StatueofLiberty with 80% of confidence |
|
{Liberty.Island.Ferry}=>{Hunan.Delight} |
0.98% |
100% |
5.37 |
This rule show that the 0.98% of users ‘s gowalla who are located in spot “Hunan.Delight” has been located in Liberty.Island.Ferry of 100% of persion |
|
{Ed Sullivan Theatre}=>{1 World Trade Center} |
1.31% |
100% |
1.53 |
This rule indicate that the 1.31% of users who are located in spot “Ed Sullivan Theatre” also located in World Trade Center of 100%of confidance |
|
{Katz.s.Delicatessen}=>{Empire.State.Building} |
7.14% |
100% |
9.33 |
This rule indicate that 7.14% of users who are located in Empire.State.Building are located in Katz.s.Delicatessen restaurant with 100% precision |
|
{Empire.State.Building,Gramercy.Tavern}=>{Madison.Square.Garden} |
7.14% |
100% |
9.33 |
This rule informe us that 7.14% of users’s Gwalla who located in Empire.State.Building and Gramercy.Tavern restaurant are located in Madison.Square.Garden stadium with 100% of precision |
|
{Bean...Bean}=>{The.Museum.of.Modern.Art..MoMA.} |
0.98 |
100% |
29 |
The rule illustrate that 0.98% of users which go to Bean...Bean coffee like to visit the.Museum.of.Modern.Art.MoMA with100 % of presicion |
|
{Café.Habana}=>{Bean...Bean} |
0.98 |
100% |
8.12 |
The rule indecate that 0.65% of users which located in {Bean...Bean} coffee are located in Café. Habana coffee with 50% of presicion |
|
National.9.11. Memorial.Museum}=>{Katz's Delicatessen} |
0.4 5% |
75% |
4.12 |
This rule signifies that 0.45% of users which located in 9/11Memorial.Museum are located in Katz’s Delicatessen restaurent with575% of presicion |
|
{Madison.Square.Garden}=>{Citi.Field} |
0.98% |
100% |
8.12 |
This rule show that 0.98% of users Gowalla which located in Madison.Square.Garden are also like the citi.Field stadium with 100% of precision |
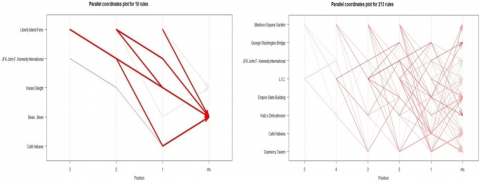
Figure 5 illustrates the parallel coordinates plot for 213 and 10 rules order 2 to 5 respectively. From this figure it’s clear to read rules: {liberty.Island-Ferry}→{Bean.Bean}or {Madison.Square.Garden}→{JFK.John.F..Kennedy.International} and so on.
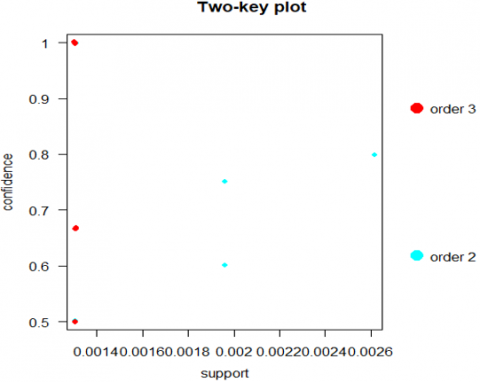
Therefore, we presented some results using plots generated by the R software for 19 rules in Figure 6, the 19-rules scatter plot with the two-key plot. Figure 6(a) shows the diversity of arrangements according to the measures of support, confidence and maintenance. Figure 6(b) shows the order of the rules according to the support and confidence measures. In addition, we have presented in Figure 7 the pathway of these rules on a map using google maps, which permit to determine the mobility of Gowalla users, also we show how users tend to travel to move from locations (LHS) to locations (RHS).
4.2 Experiment II association rules users-comments
An effective solution against the limitations of the ubiquitous “check-in”is to influence locations in other valuable and unique ways. A new service called “Highlights” was added to Gowalla which offers to define places with user favourites and experiences rather than “check-ins”. Every answer can reveal a bit about the user’s identity, and where they spend their time. Hence, with the services named “experience-data” linked with specific places, users can learn from the exciting experiences of their friends when they check in at their favourite places.
The VisAR tools [2] permits to illustrate samples of rules, thus, figure 8 shows network graph of six rules without layouts restrictions. Also, in the above graph, the size of the nodes is based on the highest Support and the color signifies the highest Lift.
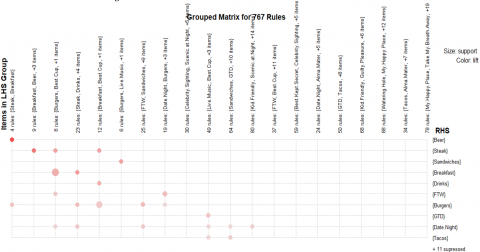
In another example we have applied the instruction “Apriori (file,parameter=list(supp=0.004,conf=0.5,minlen=2))”. We extracted 767 rules, illustrated in Figure 9, which shows the grouped matrix of 763 rules. Using this representation, we can describe more the relation between rules and frequent itemset. As a result, displaying association rules using graphs permits enhancement of the presentation and visualization of the association rules. In addition, it can improve the illustration and enhance interoperability while visualizing huge sets of rules.
We have extracted over 14,906, some of them are important while others, might be useless. Thus, selecting the threshold for support and confidence is an important step to getting stronger rules. Besides, not all of which we can explain. Some of these rules are presented and discussed and presented in Table 4 and Table 5.
Table 4. Present rules generated by Aprriori method
|
Rules |
Support |
Confidence |
Lift |
|
{Live.Music,People.Watching}=>{Pizza} |
0.09581882 |
0.7857143 |
4.849462 |
|
{People.Watching,Pizza}=>{Live.Music} |
0.09581882 |
0.5500000 |
7.428235 |
|
{Scenic.at.Night,Tourist.Trap}=>{Pizza} |
0.09581882 |
0.5500000 |
3.394624 |
|
{Pizza,Scenic.at.Night}=>{Tourist.Trap} |
0.09581882 |
0.5000000 |
4.519685 |
|
{Live.Music,Tourist.Trap}=>{Pizza} |
0.09581882 |
0.6470588 |
3.993675 |
|
{Guilty.Pleasure,Tourist.Trap}=>{Pizza} |
0.10452962 |
0.5714286 |
3.526882 |
Table 5. Some extracted rules with descriptions
|
Rules |
Sup. |
Conf. |
Lift |
Description |
|
{Guilty.Pleasure, Celebrity Sighting}=>{ Tourist.Trap }=>{Pizza} |
0.0871 |
0.6667 |
6.02 |
This rule informs us that the tourist visitors comment Guilty. Pleasure and like Celebrity Sighting about 8.71 % with 66.67% of precision. |
|
{Best.Kept.Secret,Pizza}=>{Best.Cup} |
0.0871 |
66.667 |
5.88 |
This rule indicate that pepeole which comment best.kept secret and favorate as meal pizza they like Best Cup with 8.7% of realability and 66.67% of precision. |
|
{Pizza,Scenic.at.Night}=>{Tourist.Trap} |
0.0958 |
0.5000 |
4.52 |
This rule demonstrate that 9,58% of persons which like to watch Scenic.at.Night favorate to take PIZZA are tourists with 50.000% of precision. |
|
{Live.Music, People.Watching}=>{Pizza} |
0.0785 |
0.958 |
4.85 |
This rule show that pepeople who favourite place to hear live music. And highlights generally ask for eat pizza with 7.875% of reliability and 95.8% of precision. |
|
{TakeMyBreathAway}=>{BestKeptSecret} |
0.114 |
1.00 |
2.44 |
This rule shows that more than 11% of the users of the gowalla site who like cinema and look for it, and comment on, also prefer to frequent the green spaces with 100% of precision. |
|
{ Scenicat Night}=>{My Happy Place} |
0.091 |
1.000 |
3.14 |
This rule shows that about 9% of the users of the site like places that guarantee beauty and charming landscapes such as the look to New York at night with itmagnificent lights then they make comment “My happy place”. This rule appears with a precision of 100%. |
|
{Celebrity Sighting, WTF=>{Take My Breath Away} |
0.091 |
1.000 |
4.00 |
This rule indicate that 9.10% of persons who like Celebrity Sighting and stay in the middle of open space comments “take my breath” away with 100% of precision. |
|
{Alma Mater, Pizza}=>{Burgers} |
0.114 |
1.000 |
2.933 |
This rule indicate that pepeole which vistors of Alma Mater that favorite Pizza as meal they also take Burgers with 11.4% of realability and 100% of reliability. |
(a)
(b)
Figure 4. Somenetwork graphs of rules generated byVisAR tools
Figure 5. Illustrates an examples of parallel coordinates plot for 213 and 10 rules
(a)
(b)
Figure 6. Visualise: (a) Scatter plot for 19 rules; (b) Two-key plot
Figure 7. Illustrate some path between anticendent and consiquent of rules visited by Gowalla users in NYC
Figure 8. Illustrate an example of network graph contains 6 rules
Figure 9. The grouped matrix for 767 rules (LHS→RHS)
This paper presented a new approach based on the biclustering and Apriori algorithm for considering a model of association rules that were used to analyse and predict users’ activities. However, the case study was considered the social network platform Gowalla. The proposed scheme consisted of four main steps, including pre-processing data, data-matrix preparation of both users-location and user-on, then, biclustering method to get a relevant sub matrix, and finally, the Apriori algorithm was applied to extract significant associations’ rules. In the end, we described and commented on some extracted rules. The achieved result a publicly available. The Gowalla dataset demonstrated the effectiveness of the presented method in analysing LBSNs. Furthermore, the model of association rule briefly described user activities and it is considered a novel tool, which can be included in the offered state-of-the-art methods. Moreover, the extracted association rules were considered as a model to represent knowledge. Then, some selected rules based on categories offered by LBSNs Gowalla were described. In future work, we will study and investigate applying feature selection methods to data matrix before extracting the association rules model.
[1] Ding, X., Xu, J., Chen, G. (2013). Exploring structural analysis of place networks using check-in signals. In 2013 IEEE Global Communications Conference (GLOBECOM), pp. 3194-3199. https://doi.org/10.1109/GLOCOM.2013.6831563
[2] Ye, M., Yin, P., Lee, W.C., Lee, D.L. (2011). Exploiting geographical influence for collaborative point-of-interest recommendation. In Proceedings of the 34th International ACM SIGIR Conference on Research and Development in Information Retrieval, pp. 325-334. https://doi.org/10.1145/2009916.2009962
[3] Yang, C., Sun, M., Zhao, W.X., Liu, Z., Chang, E.Y. (2017). A neural network approach to jointly modelling social networks and mobile trajectories. ACM Transactions on Information Systems (TOIS), 35(4): 1-28. https://doi.org/10.1145/3041658
[4] Lekshmy, P.L., Rahiman, M.A. (2020). A sanitization approach for privacy preserving data mining on social distributed environment. Journal of Ambient Intelligence and Humanized Computing, 11(7): 2761-2777. https://doi.org/10.1007/s12652-019-01335-w
[5] Aggarwal, C.C. (2015). Data mining: The textbook. New York: Springer. https://doi.org/10.1007/978-3-319-14142-8
[6] Ristoski, P., Paulheim, H. (2016). Semantic Web in data mining and knowledge discovery: A comprehensive survey. Journal of Web Semantics, 36: 1-22. https://doi.org/10.1016/j.websem.2016.01.001
[7] Shin, S., Hwang, I. (2017). Data-mining-based computer vision analytics for automated helicopter flight state inference. Journal of Aerospace Information Systems, 14(12): 652-662. https://doi.org/10.2514/1.I010517
[8] Bao, J., Zheng, Y., Wilkie, D., Mokbel, M. (2015). Recommendations in location-based social networks: A survey. GeoInformatica, 19(3): 525-565. https://doi.org/10.1007/s10707-014-0220-8
[9] Zafar, A., Chitnis, S. (2020). Survey of depression detection using social networking sites via data mining. In 2020 10th International Conference on Cloud Computing, Data Science & Engineering (Confluence), pp. 88-93. https://doi.org/10.1109/Confluence47617.2020.9058189
[10] Agrawal, R., Imieliński, T., Swami, A. (1993). Mining association rules between sets of items in large databases. In Proceedings of the 1993 ACM SIGMOD International Conference on Management of Data, pp. 207-216. https://doi.org/10.1145/170036.170072
[11] Agrawal, R., Srikant, R. (1994). Fast algorithms for mining association rules. In Proc. 20th Int. Conf. Very Large Data Bases, VLDB, 1215: 487-499. https://doi.org/10.1007/BF02948845
[12] Preoţiuc-Pietro, D., Cranshaw, J., Yano, T. (2013). Exploring venue-based city-to-city similarity measures. In Proceedings of the 2nd ACM SIGKDD International Workshop on Urban Computing, pp. 1-4. https://doi.org/10.1145/2505821.2505832
[13] Liu, Y., Yang, H., Sun, G.X., Bin, S. (2020). Collaborative filtering recommendation algorithm based on multi-relationship social network. Ingénierie des Systèmes d’Information, 25(3): 359-364. https://doi.org/10.18280/isi.250310
[14] Gao, H., Tang, J., Hu, X., Liu, H. (2015). Content-aware point of interest recommendation on location-based social networks. In Twenty-Ninth AAAI Conference on Artificial Intelligence, 15: 1721-1727. https://doi.org/10.1609/aaai.v29i1.9462
[15] Metlapalli, A.C., Muthusamy, T., Battula, B.P. (2020). Classification of social media text spam using VAE-CNN and LSTM model. Ingénierie des Systèmes d’Information, 25(6): 747-753. https://doi.org/10.18280/isi.250605
[16] Palumbo, E., Rizzo, G., Troncy, R., Baralis, E. (2017). Predicting your next stop-over from location-based social network data with recurrent neural networks. In RecTour@ RecSys, pp. 1-8.
[17] De Choudhury, M., Feldman, M., Amer-Yahia, S., Golbandi, N., Lempel, R., Yu, C. (2010). Automatic construction of travel itineraries using social breadcrumbs. In Proceedings of the 21st ACM Conference on Hypertext and Hypermedia, pp. 35-44. https://doi.org/10.1145/1810617.1810626
[18] Mohammad, Y., Cemda, A.R., Siregar, S. (2022). Empowering regional development with quadruple helix creative industry model. J. Urban Dev. Manag., 1(1): 17-25. https://doi.org/10.56578/judm010103
[19] Chen, X., Zeng, Y., Cong, G., Qin, S., Xiang, Y., Dai, Y. (2015). On information coverage for location category-based point-of-interest recommendation. In Twenty-ninth AAAI Conference on Artificial Intelligence. https://doi.org/10.1609/aaai.v29i1.9191
[20] Cai, W., Wang, Y., Lv, R., Jin, Q. (2019). An efficient location recommendation scheme based on clustering and data fusion. Computers & Electrical Engineering, 77: 289-299. https://doi.org/10.1016/j.compeleceng.2019.06.006
[21] Li, H., Ge, Y., Hong, R., Zhu, H. (2016). Point-of-interest recommendations: Learning potential check-ins from friends. In Proceedings of the 22nd ACM SIGKDD International Conference on Knowledge Discovery and Data Mining, pp. 975-984. https://doi.org/10.1145/2939672.2939767
[22] Zhao, K., Cong, G., Sun, A. (2016). Annotating points of interest with geo-tagged tweets. In Proceedings of the 25th ACM International on Conference on Information and Knowledge Management, pp. 417-426. https://doi.org/10.1145/2983323.2983850
[23] To, D., Si, D., Chen, Y. (2019). Traveler's next activity predication with location-based social network data. In Proceedings of the 3rd ACM SIGSPATIAL International Workshop on Prediction of Human Mobility, pp. 15-23. https://doi.org/10.1145/3356995.3364540
[24] Likhyani, A., Padmanabhan, D., Bedathur, S., Mehta, S. (2015). Inferring and exploiting categories for next location prediction. In Proceedings of the 24th International Conference on World Wide Web, pp. 65-66. https://doi.org/10.1145/2740908.2742770
[25] Shem-Tov, I.B., Bekhor, S. (2020). Extracting travel demand for emergency situations using location-based social network data. Transportation Research Procedia, 45: 111-118. https://doi.org/10.1016/j.trpro.2020.02.094
[26] Islam, M.M. (2012). From government to E-governance: Public administration in the digital age: Public administration in the digital age. IGI Global.
[27] Silva, T.H., Celes, C.S.F.S., Neto, J., Mota, V., Cunha, F., Ferreira, A., Loureiro, A. (2016). Users in the urban sensing process: Challenges and research opportunities. Pervasive Computing: Next Generation Platforms for Intelligent Data Collection, 45-95. https://doi.org/10.1016/B978-0-12-803663-1.00003-6
[28] Zou, Z., Xie, X., Sha, C. (2015). Mining user behavior and similarity in location-based social networks. In 2015 Seventh International Symposium on Parallel Architectures, Algorithms and Programming (PAAP), pp. 167-171. https://doi.org/10.1109/PAAP.2015.40
[29] Wu, Z., Pan, S., Chen, F., Long, G., Zhang, C., Philip, S.Y. (2020). A comprehensive survey on graph neural networks. IEEE Transactions on Neural Networks and Learning Systems, 32(1): 4-24. https//doi.org/1048550/arXiv.1901.00596
[30] Hao, F., Zhang, J., Duan, Z., Zhao, L., Guo, L., Park, D.S. (2020). Urban area function zoning based on user relationships in location-based social networks. IEEE Access, 8: 23487-23495. https//doi.org/10.1109/ACCESS.2020.2970192
[31] Berzal, F., Blanco, I., Sánchez, D., Vila, M.A. (2001). A new framework to assess association rules. In International Symposium on Intelligent Data Analysis, pp. 95-104. https://doi.org/10.1007/3-540-44816-0_10
[32] Murali, T.M., Kasif, S. (2002). Extracting conserved gene expression motifs from gene expression data. In Biocomputing 2003, pp. 77-88. https://doi.org/10.1142/9789812776303_0008
[33] Liu, X., Liu, Y., Aberer, K., Miao, C. (2013). Personalized point-of-interest recommendation by mining users' preference transition. In Proceedings of the 22nd ACM International Conference on Information & Knowledge Management, pp. 733-738. https://doi.org/10.1145/2505515.2505639
[34] Hahsler, M. (2017). arulesViz: Interactive Visualization of Association Rules with R. R J., 9(2): 163. https://doi.org/10.32614/RJ-2017-047
[35] Almende, B.V., Thieurmel, B. (2017). Robert T. visNetwork: Network Visualization using ‘vis. js’ Library. 2019, R Packag. version, 2(9).
[36] Yang, L. (2003). Visualizing frequent item sets, association rules, and sequential patterns in parallel coordinates. In International Conference on Computational Science and Its Applications, pp. 21-30. https://doi.org/10.1007/3-540-44839-X_3