Pongpipat Saitong
© 2022 IIETA. This article is published by IIETA and is licensed under the CC BY 4.0 license (http://creativecommons.org/licenses/by/4.0/).
OPEN ACCESS
This study aimed to design, develop, and evaluate efficiency of a human-based “U-Blood App” prototype for blood unavailability in Thailand. This study adopted a mixed-method design. The results of the study revealed these key findings. First, the needs analysis of 32 key informants (50% males and a mean age of 40.6 years) indicated that the features of the User Experience (UE) and the User Interface (UI) should contain blood donor’s qualification, general information record of the blood donor’s health, blood donation appointment and notification schedule, the application download and installation, a simple guide for the application user, the hospital logo, and necessary information. Second, the evaluation by experts revealed that the quality of the prototype is high $(\bar{X}=4.79)$ and the quality of UI ( $\bar{X}=4.79)$ was higher than that of UE $(\bar{X}=4.70)$. Lastly, the end users of 65 samples (50.76\% females and a mean age of 48 years) are highly satisfied with the prototype $(\bar{X}=4.68)$. The findings advanced the understanding of the impacts of human factors on the development of smart phone application for blood donation. The overall results cannot be generalized in the long term. Future inquiry should work on this limitation.
application for blood donation, smartphone, prototype, efficiency evaluation
1.1 Rationale for the study
Traffic accidents have become a major concern for several countries. Thailand is one of the countries affected most by the accidents. Thailand was ranked the second in the world (behind Libya) for number of road accident deaths. The road accident deaths during the seven days around new year in the past twelve years are as follows: 347 (2010), 358 (2011), 321 (2012), 365 (2013), 366 (2014), 341 (2015), 380 (2016), 478 (2017), 423 (2018), 463 (2019), 373 (2020), and 392 (2021) [1]. The traffic accident deaths during the seven days around traditional Thai new year, also called Songkran Festival, are similar. The figures were limited only to two-week time. The number of injuries from traffic accidents have not been included. When consider the whole year statistics of traffic accident deaths and injuries, the concern seems to be critical. For example, in 2020, the mortality and injury rates from the traffic accidents in Thailand were 1,582 deaths and 100,949 injuries [2].
Due to high traffic accident and injury rates each year, health system in Thailand has demanded a huge amount of blood for healing and operation. Despite such high demands, the donated blood has been insufficient. In addition, the blood shortage is complicated due to unavailability of blood of a specific type. A is the main blood type in the north while B is the main blood type in the central part. Accordingly, the shortage of B might be found in the central part. Despite of calls for blood donation, chronic or seasonal blood shortages are still critical. Engaging potential donors and attracting new donors is also challenging. Therefore, it is needed for a blood center to use digital technologies for improving the entire blood supply chain and reducing the risk of blood availability.
Recent studies have proposed strategies to improve the donations in resource-limited areas. Alanzi and Alsaeed [3], May Rodrigues and Reibnitz [4] suggested that the strategies to attract donors and repeat donation should be innovative and respond to local environment. Cechetti et al. [5], Abbasi et al. [6] advocated the use of social media such as Facebook Messenger [7]. Gomes et al. [8] suggested campaigns and advertising methods as effective for the recruitment of new donors among undergraduate students. One innovative approach is the use of smartphone applications. A plethora of studies have attempted smartphone applications in blood donation such as life saver app [9], BDoor app-blood donation application using Android studio [10], automation of blood donation using data mining [11], mobile blood donation applications [12], and Android mobile app and web application system [13].
However, the studies usually focus on technology components. They “seem” to pay little attention to evaluation of human factors (e.g., positive attitude and behavioral intentions towards blood donation, interaction with innovations) over the application as a conversational agent or, when it comes to human cooperation, especially in case of blood donation as some studies (e.g., [14]) indicate that anxiety might negatively affect blood donation intention. However, other studies have shown that innovativeness is a key structure in user satisfaction and acceptance. It remains unclear how human factors affect smartphone applications in case of blood donation.
In this study, the factors (needs analysis of potential donors, expert opinion, and end user gratification) were included as key components for designing a user-centered smart phone prototype to facilitate and engage potential blood donors, especially millennials who are large in numbers and, hence, become the hope for blood safety supply. This main objective of this study was to evaluate a specific smartphone application designed for blood donation, and determine whether it meet the expert criteria and the end user’s needs. In addition, three specific objectives were to: (i) explore the potential blood donor needs analysis, and design, develop, and evaluate a smartphone application in blood donation based on the needs analysis, (ii) evaluate the prototype by experts, and (iii) evaluate the application by end users.
The structure of this paper is organized as follows. Section I (Introduction) provides background of the study and the research gap. Section II (Background of the Study) illustrates the prior research on key areas. Section III (Theoretical, Conceptual, and Research Framework). Section IV (Research Method) describes the research approach of this review (namely research design, samples and sample selection, instruments for data elicitation, data collection, data analysis, and reliability and content validity check). Section V (Results of the Study) describes the research findings based on the research questions. Section VI (Conclusion of the Study) presents key findings in relation to the research questions. Section VII (Discussion, Limitations of the Study, and Implications of the Study) highlights discussion implications of the key findings and suggestions for directions for future inquiries, briefly explains how this review is limited, interpret the significance of the findings of this study in light of the findings of the previous studies about the research problems and explain new understanding or insights about the research problems, and highlights implications of the key findings and suggestions for directions for future inquiries.
To provide in-depth understanding of the topic under this review, the next part provides literature review and prior study.
1.2 Literature review
1.2.1 Prior research on positive impacts of technology on blood donation intention
Several studies indicate positive impacts of technology on blood donation intention [15-18]. Technology has potentials to inform, instruct, and socialize such as an app to locate and list donors in the area [16] and a web-based application system which enable the donors to plan activities to meet their needs [17]. Technology also has potentials to persuade so it is a promising tool for raising awareness to foster desirable behaviors regarding blood donation process necessary to change the behavior in the target audience [18]. The designed and developed application as an agent may increase donations and help infrequent and new donors reduce fear associated with the donation [19, 20]. In addition, information and clarification during donor recruiting can reduce fears about the
Several studies indicate positive impacts of technology on blood donation intention [15-18]. Technology has potentials to inform, instruct, and socialize such as an app to locate and list donors in the area [16] and a web-based application system which enable the donors to plan activities to meet their needs [17]. Technology also has potentials to persuade so it is a promising tool for raising awareness to foster desirable behaviors regarding blood donation process necessary to change the behavior in the target audience [18]. The designed and developed application as an agent may increase donations and help infrequent and new donors reduce fear associated with the donation [19, 20]. In addition, information and clarification during donor recruiting can reduce fears about the safety of the process [21].
Even though technology has contributions to blood donation, it may be affected by the negative impact of human factors on their use of the application. The factors many determine the success and failure of blood donation. To minimize the negative impacts of the factors, it is necessary to understand the target users’ perception and attitudes towards the application.
1.2.2 Prior research on human factors on blood donation
Human factors may negatively influence blood donation behavior and intentions so it is necessary to understand the factors. Some studies have shown that fear of donation-associated stimuli is the most influential reason across various levels for donating or not donating blood [19, 20]. Enawgaw et al. [22] found that the reasons for not donating include fear of pain, medical inaccuracies in donating, and the lack of information on when, where and how to donate blood is the reason for not donating blood. Other studies have revealed that anxiety has negative impacts on blood donation intention. Murtagh and Katulamu [23] found the negative correlation between blood donation anxiety and intention was conciliated by moral abandonment.
In addition, factors like knowledge and demographic characteristics [24], knowledge and attitude [22], and lack of information in different stages of the donation system [21]. On demographic characteristics, genders had an impact on blood donation and women were inclined not to donate [25]. However, the conversational agent (e.g., an app.) is a more interesting and attractive alternative to encourage women to donate [26].
Lastly, motivation may negatively affect blood donation behavior and intentions. Padilla-Grrido et al. [27] found that in motivation, barriers, and choice of communication channels in terms of blood donation affect the youth blood donation campaign.
1.2.3 Prior research on suggestions
Several scholars have provided initiatives for blood donor agencies and public policy makers to transform blood donors, particularly millennials, to donate [28, 29]. Duh and Dabula [28] indicated that motivation, perception, awareness, friends and family had positive effects on attitude which may help predict the intention. Similarly, Martín‐Santana and Beerli‐Palacio [29] have shown that motivation is the most influential factor on the intention. In addition, experience as a donor is a key factor of future intention to donate. Donors and non-donors are considerably different in terms of behaviors. This study, therefore, suggested that it is needed to personally and frequently communicate with the donors to remind them to schedule their future donation, temporarily recall reluctant donors, elaborate on how donations affect donors and the society, and develop membership programs using current donors, as influencers, to persuade their peers, colleagues and family members. It is evident that the antecedents play a vital role in blood donation behavior and intentions. Solutions on this lie in appropriate designs.
1.2.4 Prior research on appropriate designs
Appropriate designs can reduce the negative impacts of human factors on the application. Several scholars (e.g., [29, 30]) provide approaches to this. Martín‐Santana and Beerli‐Palacio [29] suggested that interventions should focus on specific training programs that contribute to raise greater awareness and motivation to blood donation while [30] advocated interventions to follow up on people's opinions about donating blood will help blood collection agencies make strategic choices more effectively.
Several scholars suggest that it is also necessary to evaluate whether a tool designed meets the needs of the target user is necessary, especially when the tool is designed for medical purposes to determine if it is properly designed [28, 31, 32]. Lowdermilk [31] proposed that a questionnaire is effective for drawing blood donation knowledge. Similarly, a blood donation knowledge questionnaire is also potential for evaluating socio-psychology and blood donation intention [28].
Drawing upon the prior study, a theorectical and conceptual framework of the study and research questions were determined as follows.
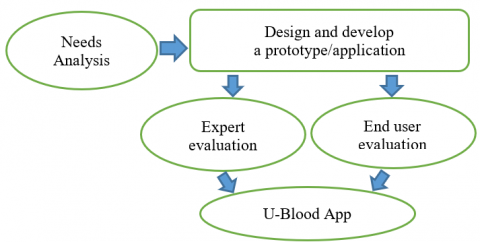
Research questions were (i)What features of the User’s Experience (UE) and the User’s Interface (UI) are likely to be? (ii) What is the expert evaluation, also called heuristic evaluation, on the efficiency of the developed U-Blood Application prototype? (iii) What are the users’ attitudes toward the efficiency of the application? In response to the research questions, the approach was designed as shown in Figure 1 below.
Figure 1. A theoretical and conceptual framework of the study
Figure 1 illustrates the theoretical and conceptual framework of this study. It began with needs analysis. Then a prototype was designed and develop in response to the needs analysis. The prototype was evaluated by experts and end users to get the U-Blood app.
2.1 Design of the study
This study was based on a mixed-method research design which aimed to draw a conclusion of the study from both qualitative and quantitative data based on triangulation for cross-checked purposes. This U-Blood App was specifically designed for Suthavej Hospital, Faculty of Medicine, Mahasarakham University (MSU). The hospital was chosen for these three main reasons. First, geographically, Suthavej Hospital is located in Mahasarakham province in northeastern Thailand. As forecasted in 2022, this region has the highest population among all regions. (Though this research was conducted in 2021, the application was developed for the future donation.) According to forecasted population in Thailand in 2022, the population classified by region in 2022 may be forecasted as follows: northeastern (18.23%), northern (10.98%), southern (9.31%), Bangkok Metropolitan Region (BMR) (8.42%), BMR peripheral area (7.36%), eastern (5.90%), western (3.52%), and central (3.09%) respectively (Statista.com, November 2021). In the northeastern region, there are 20 provinces out of the total 76 provinces, excluding Bangkok Metropolitan so it is a large region. Second, in terms of traffic, Mahasarakham province lies in central northeastern region. It is the route through other provinces in the region so the accident rate has been high. This province is 196 kilometers far from Nakhon Ratchasima Province, the most spacious and most populated province where is the gateway to all other provinces and has had the highest accident rate in the region. Also, it is located among five important provinces (namely Khon Kaen, Kalasin, Roi Et, Surin, and Buriram) and all provinces, except Kalasin, have more than one million. Lastly, in terms of numbers of potential blood donors, it is the provincial capital where is the home of two universities, MSU and Rajabhat Mahasarakham University. MSU is one of the largest universities in northeast Thailand with 39,269 students (2020). All five neighboring provinces are homes of universities in northeast Thailand. The numbers of young adults who are potential blood donors are high. For all aforementioned reasons, Suthavej Hospital, Faculty of Medicine, MSU, is therefore chosen for this study.
2.2 Population and samples
The population in this study was 75 people who received service from the hospital and had blood donated. The data were collected at Suthavej Hospital. Therefore, population and sample selection in this research could not be determined. Due to these constraints, simple random sampling, quota sampling, and consent of the samples were applied for data collection. Based on these criteria, the samples for needs analysis consisted of 64 blood donors, equally dividing into 32 males and 32 females to avoid gender biased. Their ages were divided as follows: (a) 17-25 years old (10 males and 11 females), (b) 26-35 years old (8 males and 8 females), (c) 36-45 years old (7 males and 6 females), (d) 46-55 years old (5 males and 6 females), and (e)56-65 years old (1 male and 2 female). The numbers of blood donation times were divided as follows: (a) 1-5 times (17 males and 11 females), (b) 6-10 donations (9 males and 6 females), (c) 11-20 times (7 males and 2 females), (d) 21-30 times (6 males and 2 females), and (e) more than 30 times (3 males and 1 female).
Samples in this study fell into three groups. Below are details of each group.
One group comprised 32 key informants for a needs analysis. To draw insights of needs analysis, all key informants had blood donated. These key informants were purposively selected based on this criterion, i.e., all had blood donated. There are both MSU students, staffs, and general public who received medical services from Suthavej Hospital where was the site for data collection during February 1-28, 2021. The demographic profiles of the key informants are as follows. Among the 32 key informants, there are males (50%, n.=16) and females (50%, n.=16) equally in order to avoid gender bias. Their ages vary and can be arranged from the lowest to the highest ages as follows: 17-25 years old (37.14 %, n.=13), 26–35 years old (25%, n.=8), 36-45 years old (18.75%, n.=6), 46-55 years old (9.37%, n.=3), and 56-65 years old (6.25%, n.=2). The numbers of times that the key informants had blood donated varied and could be arranged from the lowest to the highest number of times as follows: 1-5 times (46.87%, n.=15), 6-10 times (21.87%, n.=7), 11-20 times (15.62%, n.=5), 21-30 times (12.5%, n.=4), and more than 30 times (3.12%, n.=1).
Another group consisted of 5 experts who were purposively selected for their expertise, skills, and knowledge in the field related to this study as follows: a researcher and academic in mobile application development website development and the development of interactive media, user experience (UX) and user interface (UI) (Expert 1); a graphic design researcher and academic in website design, user interface (UI) design, and the development of multimedia media (Expert 2); a researcher and academic in game development and computer program development (Expert 3); a researcher and academic in the field of mobile application development and web application (Expert 4); and a researcher and academics in computer program development and electronic commerce (Expert 5).
The other group were 65 samples as determined by the sample size calculation of Krejcie & Morgan (1970) based on the population of 75 people who received medical services from Suthavej Hospital during May 8 - July 20, 2021. These samples were selected by simple random sampling. The demographic profiles of the key informants are as follows. Among the 32 key informants, there are males (49.23%, n.=32) and females (50.76%, n.=33) almost equally in order to avoid gender bias. Their ages vary and can be arranged from the lowest to the highest ages as follows: 17-25 years old (41.53 %, n.=27), 26–35 years old (21.53%, n.=14), 36-45 years old (26.15%, n.=17), 46-55 years old (7.69%, n.=5), and 56-65 years old (3.07%, n.=2). The numbers of times that the key informants had blood donated varied and could be arranged from the lowest to the highest number of times as follows: 1- 5 times (46.87%, n.=15), 6-10 times (21.87%, n.=7), 11-20 times (15.62%, n.=5), 21-30 times (12.5%, n.=4), and more than 30 times (3.12%, n.=1).
2.3 Instruments for data elicitation
Below are details of each instrument. First, an interview was designed for drawing insight of potential blood donors as a preliminary needs analysis. This study aimed to understand the target end users’ interaction factors. The insights were used for designing and developing a prototype. Second, a five-scale questionnaire was designed to draw expert evaluation of the efficiency of the developed prototype. It is composed of two parts: User Experience Design (UXD) and User Interface Design (UID). Lastly, a five-scale end user questionnaire aimed to draw end user evaluation of the efficiency of the application. It is composed of two parts: UXD and UID.
2.4 Data collection
The first stage, needs analysis, began with of user experience and user interface of design. This stage aimed to draw insights of users’ experience and their interface based on a human-centered design concept in order to understand what necessary information the would-be donors need before making a decision to donate (namely the blood donor’s qualification, general health data record, blood donation appointment schedule and notification, any of abnormality after having blood donated, an appropriate part for blood injection) and how the users perceived in-depth information which reflected their needs, moods, and motivation. The data provides background for designing and developing a user-friendly prototype application in the next stage.
The second stage, prototype design and development, involved creating, ideating, and making a work plan of designing and developing the prototype application. This stage comprised these steps. First, the researcher began with defining the necessary data, then generated as many ideas as possible, and finally collected the characters, qualifications, and any other essential components. Next, the researcher made a draft of the user interface on a software to test the application’s ease of use, designed the linkages amongst each component in the system, and summarized the moods, colors, and tones required for the application’s interface to design graphic images, controlling buttons, and messages appropriate for the users. The program codes were written to manage the back-end use so that the application would effectively function as planned.
The third stage, expert evaluation, the prototype application was verified by five experts in two aspects: UXD and UID. Each aspect has nine questions in the form of five-scale rating questionnaire. Each expert evaluated according to these criteria: 1 (strong disagree), 2 (disagree), 3 (neutral), 4 (agree), and 5 (strong agree). (See also the evaluation in Appendix 1 (UXD) and Appendix 2 (UID).
The last stage, end user evaluation of the application, the application was verified whether it worked for the end users and responded to their needs.
2.5 Data analysis
The qualitative data drawn from the interview of key informants were coded by three research assistants and compared for consensus. Specifically, the methods to encode qualitative data followed this coding scheme. All research assistants transcribed data and gathered the data hat shared similar or related concept. Next, they organized data items. Then, they manually coded, grouped and arranged the codes under appropriate nodes. Later, they recoded to ascertain the appropriateness of the codes and nodes. Lastly, they categorized, reasoned, conceptualizing and summarized the similar or related codes. The results of coded and recoded data from all three experts were compared for triangulated consensus. The quantitative data drawn from the expert evaluation and the end user evaluation questionnaire were analyzed by descriptive statistics (namely mean and standard deviation). For scoring procedure, 1 to 5 points were given to “strongly disagree”, “disagree”, “neutral’, “agree”, and “strongly agree”, respectively.
For reliability and validity check, the results of the interview were transcribed, coded and compared based on triangulation as mentioned earlier in the coding scheme. Each research assistant’s coded and recoded results representing each angle were compared and discussed till they all reached a consensus. The questionnaire was constructed in response to RQs and then assessed by the five reviewers for content validity check and the Item-Objective Congruence (IOC) evaluation. They are researchers and academics in educational communication technology and digital media production for education and creative media, in computer science web, application design, UX and UI, and in journalism writing for mass communication. The reliability check of the questionnaire was tried out and the results were tested by Alpha Cronbach's Coefficient as seen in the formula below:
$\alpha=\frac{n}{n-1}\left(1-\frac{\sum S_i^2}{S_t^2}\right)$ (1)
The two evaluation instruments – one for the experts while the other for end users – followed the same procedures. The alpha values were 0.78 and 0.90, indicating fairly high and reliable values respectively. The questionnaire results were interpreted according to these criteria: strongly disagree (1.00-1.50), disagree (average 1.51-2.50), neutral (average 2.51-3.50), agree (average 3.51-4.50), and strongly agree (average 4.51-5.00), respectively.
3.1 Needs analysis
On needs analysis, key informants agreed that the designed and developed application should contain the following information: blood donor’s qualification, general information record of the blood donor’s health, blood donation appointment and notification schedule, the application download and installation, a simple guide for the application user, the hospital’s logo, and additional information (namely specific information of the blood donor’s health, the blood donor’s healthcare privilege, the blood donor’s volunteer hours recording for student loan fund and income contingent loan). This information provided input for designing and developing a U-Blood application prototype as shown in the next part.
3.2 Designing and developing a U-Blood application prototype
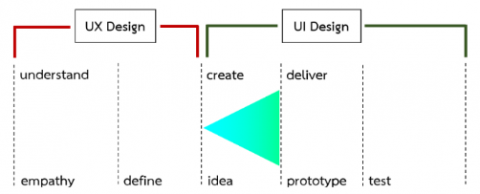
In designing and developing the U-Blood application prototype, this involves two stages: (a) UXD and (b) UID. Below are details of each stage.
3.2.1 UXD
UX Design focuses on user experience. The design adopted the design-thinking process which follows these steps.
Step 1 Data understanding and empathy
This step aimed to understand user ability to perceive and learn the in-depth data which revealed their need, moods, and motivation. This step can be photographically presented in Figure 2.
Figure 2. Data understanding and empathy
Step 2 Developing a human-centered design
This human-centered design aimed to allow a greater experience to its users. This design embraces various disciplines (namely user interface design, accessibility, usability, information architecture, and human computer interaction). This step can be photographically presented in Figure 3.
Figure 3. Human-centered design
Step 3 Defining and clarifying data
Defining and clarifying data to generate as many as ideas possible and assemble components for users to solve on their own. This step can be photographically presented in Figure 4.
Figure 4. Data definition and clarification
3.2.2 UID
UI Design focuses on what users might need to do. The design needs to ensure that the interface containing elements to facilitate easy access. It brings together concepts from idea creation, delivering a prototype, and prototype.
Step 4 Idea creation
This step can be photographically illustrated in Figure 5.
Figure 5. Idea creation
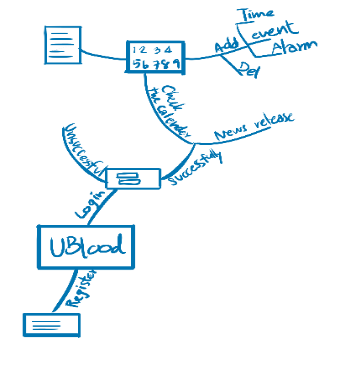
The idea creation can be photographically presented in a journey map that can be applied into the real situation and corresponding to the user needs analysis. This step can be photographically presented in a flowchart as illustrated in Figure 6.
The journey map can also be presented in a mind map as:
Figure 6. Flow chart of idea creation
Illustrated in Figure 7.
Step 5 Delivering the ideas
Delivering the ideas aims at developing a prototype. This step can be photographically illustrated in Figure 8.
Figure 7. Mind map of the journey map
Figure 8. Idea delivery to create a prototype
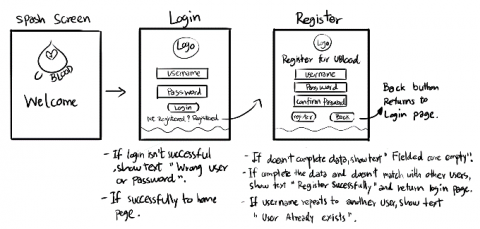
Step 6 Drafting user interface on paper
In applying the ideas to create the images and the front-end use, the draft was on paper to anticipate all components positioning on the screen. This step can be photographically illustrated in Figure 9.
Figure 9. Front-end use draft on paper
Step 7 Drafting user interface on Adobe XD
The paper draft was applied on Adobe XD and the user interface draft can be photographically illustrated in Figure 10.
Figure 10. User interface draft
The draft on the software above then needed to verify the ease of use and design the linkages amongst all parts within the system. To do so, the colors were defined in the next step.
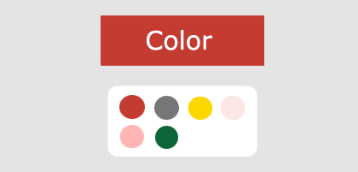
Step 8 Defining mood and color tone directions for user interface
To facilitate effective user interface, directions for moods and color tones were then defined. This step can be photographically illustrated in Figure 11.
Figure 11. Moods and color tones
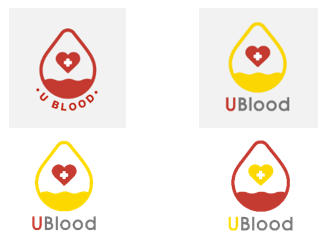
The color tone for the interface design was symbolically selected based on the following concepts. The Red Cross was symbolized by white and red and blood was represented by red while grey and yellow were the color of MSU where is the home of Suddhavej Hospital. Even though Thai is the official language, English was chosen for the purpose of international communication. Therefore, U-Blood stands as follows: U for university, specifically MSU, and Blood for blood donated for hospitals, specifically for Suddhavej Hospital. This color-tone defining process was developed step-by-step from steps 1 to 3 as illustrated in Figures 12-14.
Figure 12. U-blood app symbol design and concept (Step 1)
The concepts of U-Blood Application design (namely color choice, shapes, and messages) are defined as follows. First, all colors symbolize activities and agents involving blood donation. All colors are defined as follows. White background symbolizes the outfits of medical personnel. Red represents blood. Both colors are the emblems of a red cross is a sign of protection under the Geneva Conventions. Gray and yellow refer to the colors for Mahasarakham University. Second, all shapes are symbols. Heart shape symbolizes life. Blood droplet shape covering the heart indicates that each donated blood drop is important for life. The low blood volume that is unable to reach the heart stands for insufficiency of blood for needs and emergencies. The cross is the emblem of the Red Cross. Lastly, English, an international language, is preferred instead of Thai, an official language. The letter U stands for Mahasarakham University (MSU), the host of Suthavej Hospital. The term “blood” to connote a philanthropic concept of “save blood, save life” donated by students, staffs, faculty members, and the general public who have received medical service and make blood donation at the hospital.
Drawing upon the concepts mentioned above, the researcher developed and designed the symbols. In the initial step, six figures are illustrated below. In this step, the researcher developed a large droplet shape to cover the heart shape, indicating that each donated blood droplet is essential to life and there is also a shortage of blood for patients, indicated by low level of donated blood unable to reach the shape of the heart, signifying the chance of survival. Based on the concept, four figures are illustrated below.
Figure 13. U-blood app symbol design and concept (Step 2)
In this step, the colors of the blood droplet and the heart were signified by red. “U-BLOOD,” all in uppercase letters under the droplet, were chosen to ensure consistent font size and curved to accommodate the curved shape of the blood droplet. Then, the researcher adjusted the color of the letter U to yellow and the word BLOOD to gray, indicating the “U-BLOOD” application as a tool for communication between the blood donors and the hospital of MSU as shown in the Figure 14.
The aforementioned symbols and color tones were included in the developed U-Blood Application as shown in the application interface design in the next step.
Figure 14. U-Blood app symbol design and concept (Step 3)
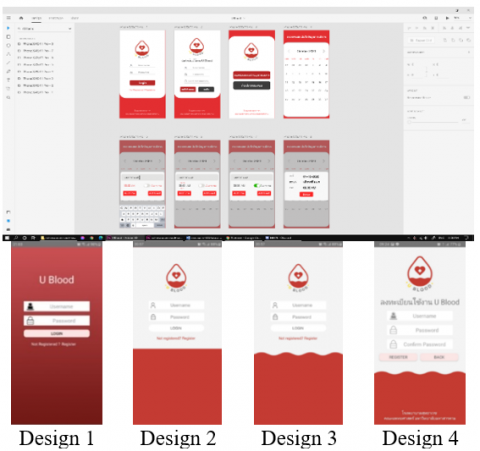
Step 9 Developing application interface design
In this step, the user interface draft positions the application’s buttons and appropriate color tones for the attractive display on smartphone. The items were grouped and word choices were carefully selected based on the user moods and feelings. Four designs were developed. After expert discussions on comparisons of all four designs, no. 4 was chosen for the application interface. The four designs are illustrated in Figure 15.
Figure 15. Comparisons of four designs for U-Blood application interface
Step 10 Revising the developed application interface design
Figure 16. Revision process of the prototype
Having developed application interface design, overall performances were then revised. The U-Blood application can be used to communicate effectively between the blood donors and the hospital. Adjust service to fit with the new normal by mitigating the communication process which helps save time for travelling to the hospital and the risks from Covid-19 contact. All these provide better blood donation service during Covid-19 and the new normal. As this application focused on the needs of donors or patients and planning process, using analysis of the information from the target group to design the user interface, it can respond to the users effectively. This effective response helps health service agencies apply the information from the analysis to develop other digital health innovations in other areas for more effective service which can enhance the health service system of the hospital as a whole and the national health service system. The revision process can be illustrated as seen in Figure 16.
After the prototype having revised, the next step was uploading the application on App Store.
Step 11 Uploading the application on App store
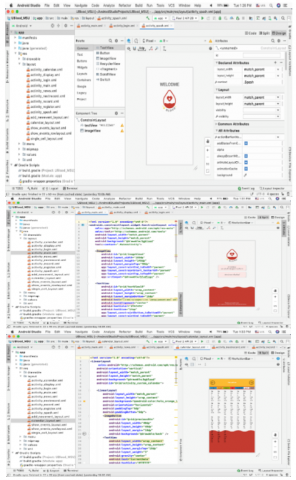
To achieve user experience and interface, it was necessary to write the program codes to manage the back-end operation system to ensure that the application system and management operate as planned. The program code writing on Adobe XD for operation system and management of the application can be illustrated as seen in Figure 17.
Figure 17. Program code writing on Adobe XD
Step 12 Creating the QR code for the application
This step dealt with creating the QR Code for U-Blood Application in preparation for trial in the next step. The application with QR Code download and installation can be photographically illustrated as seen in Figure 18.
Figure 18. Download and installation of U-Blood application
Step 13 Application testing
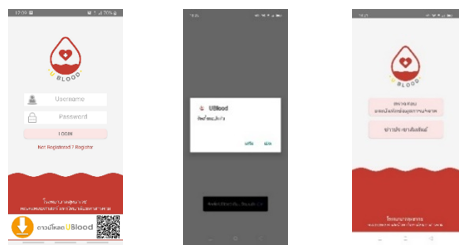
This step attempted trying out U-Blood Application with the end users to see if the prototype could perform all functions and in response to the user needs. If malfunctions were identified, they would be fixed later. The testing can be photographically illustrated as seen in Figure 19.
Figure 19. U-Blood application testing
Upon the completion of the designed and developed U-Blood Application prototype, the process involved the thirteen steps. To ensure the efficiency of the prototype, expert evaluation by usability specialists revealed in the results of the next research question.
3.3 Expert valuation of the U-Blood prototype
Table 1 shows mean scores and standard deviation of expert evaluation of U-Blood prototype. The grand total score was the high ($\bar{X}=4.79$, S.D. $=0.25$). This indicates that quality of the prototype is of high rank as the experts are highly satisfied with the overall performances of the prototype. Considering the expert evaluation of UXD and UID, the overall mean score and standards deviation of expert evaluation of UXD was high ( $\bar{X}$=4.70, S.D.=0.32). Similarly, the overall mean score and standards deviation of expert evaluation of UID was high ( $\bar{X}$=4.79, S.D.=0.25). This indicates that the experts are highly satisfied with the performances of UXD and UID. Between the two, they are more satisfied with UID than UXD.
3.4 End user evaluation of the U-Blood application
Table 2 shows mean scores and standard deviation of end user evaluation of the U-Blood efficiency. The mean score was the high ($\bar{X}$=4.68, S.D.=0.53). The mean scores of all items were arranged from the highest to the lowest as follows: the display design is universal and simply understandable ($\bar{X}$=4.81, S.D.=0.39), the application download and installation are convenient ($\bar{X}$=4.78, S.D.=0.54), the data and contents are responding to the user needs ($\bar{X}$=4.75, S.D.=0.43), the blood donation appointment calendar is available ($\bar{X}$=4.71, S.D.=0.51), the application is created with an attractive design ($\bar{X}$=4.71, S.D.=0.51), the functions are ranged from easy to difficult parts ($\bar{X}$=4.68, S.D.=0.52), the blood donation notification is available ($\bar{X}$=4.68, S.D.=0.58), the language use is simple and suitable ( $\bar{X}$=4.68, S.D.=0.46), the data and content are ranged in a proper order and suitable for use ($\bar{X}$=4.65, S.D.=0.64), the data and contents are appropriately arranged and easy to read on the display ($\bar{X}$=4.62, S.D.=0.65), the data can be rapidly downloaded on the application ($\bar{X}$=4.62, S.D.=0.54), the application design clearly signifies the uniqueness of Suddhavej Hospital, MSU ($\bar{X}$=4.59, S.D.=0.65), and the user general health information as a blood donor is systematically recorded ($\bar{X}$=4.56, S.D.=0.49), respectively. This indicates that efficiency of the application is of high rank as the end users are highly satisfied with the overall performances of the prototype.
Table 1. Mean scores and standard deviation of expert evaluation of U-Blood prototype
|
Expert evaluation of U-Blood prototype |
Mean |
|
UXD |
|
|
1. The application can be downloaded and installed easily via the QR Code. |
5.00 |
|
2. The application work smoothly without jamming. |
4.66 |
|
3. The linkage of each component in the application is correct and suitable. |
5.00 |
|
4. The application’s functions are arranged in a suitable order from easy to the difficult levels. |
4.33 |
|
5. The application functions influentially attract the users to perform what to do while using it. |
4.33 |
|
6. The data downloading speed on the application is suitable. |
5.00 |
|
7. The application’s content and data are correctly responding to the user’s needs. |
4.33 |
|
8. The application design is totally universal and simple. |
5.00 |
|
9. The application functions are convenient and easy for use. |
5.00 |
|
Total |
4.70 |
|
UID |
|
|
1. The application display is suitably composed without, graphic image, and space. |
5.00 |
|
2. The color, font and graphic images are selected appropriately. |
5.00 |
|
3. The size of font and graphic image is suitable selected and used. |
5.00 |
|
4. The color and background are properly selected to match the font and controlling buttons. |
4.66 |
|
5. The light and shade, depth, and convexity is suitably used for 3D controller. |
4.66 |
|
6. The functioning button and form-fill feature are suitably designed and simply usable for filling up. |
5.00 |
|
7. The contents are well-arranged and easy to read on the display. |
4.66 |
|
8. The similar features were listed in the same group. |
5.00 |
|
9. The language use is simple and suitable. |
5.00 |
|
Total |
4.88 |
|
Grand Total |
4.79 |
Table 2. Mean scores and standard deviation of end user evaluation of U-Blood efficiency
|
Topics of Evaluation |
Mean |
|
1. The application download and installation are convenient. |
4.78 |
|
2. The display design is universal and simply understandable. |
4.81 |
|
3. The functions are ranged from easy to difficult parts |
4.68 |
|
4. The data and contents are responding to the user needs. |
4.75 |
|
5. The user general health information as a blood donor is systematically recorded. |
4.56 |
|
6. The blood donation appointment calendar is available. |
4.71 |
|
7. The blood donation notification is available. |
4.68 |
|
8. The data and contents are appropriately arranged and easy to read on the display. |
4.62 |
|
9. The data and content are ranged in a proper order and suitable for use. |
4.65 |
|
10. The data can be rapidly downloaded on the application. |
4.62 |
|
11. The application is created with an attractive design. |
4.71 |
|
12. The language use is simple and suitable. |
4.68 |
|
13. The application design clearly signifies the uniqueness of Suddhavej Hospital, MSU. |
4.59 |
|
Total |
4.68 |
4.1 Conclusion
Three conclusions could be drawn from the study in respond to the RQs. Above all, the features of the User’s Experience (UE) and the User’s Interface (UI) should contain blood donor’s qualification, general information record of the blood donor’s health, blood donation appointment and notification schedule, the application download and installation, a simple guide for the application user, the hospital’s logo, and necessary additional information (namely specific information of the blood donor’s health, the blood donor’s healthcare privilege, the blood donor’s volunteer hours recording for student loan fund, and income contingent loan). The features were materials for designing and developing a U-Blood application prototype. The designing and developing a U-Blood application prototype consisted of UXD and UID. The user experience design dealt with these three steps (namely data understanding and empathy, developing a human-centered design, and defining and clarifying data). The user interface design involved these ten steps (namely idea creation, delivering the ideas, drafting user interface on paper, drafting user interface on Adobe XD, defining mood and color tone directions for user interface, developing application interface design, revising the developed application interface design, uploading the application on App store, creating the QR code for the application, and application testing).
In addition, to ensure the efficiency of the prototype, expert evaluation by usability specialists revealed in the results of the next research question. The quality of the prototype is of high rank as the experts are highly satisfied with the overall performances of the prototype. The quality of UID was higher than that of UXD. For UID, the experts are highly satisfied with these items: the application can be downloaded and installed easily via the QR Code, the linkage of each component in the application is correct and suitable, the data downloading speed on the application is suitable, the application design is totally universal and simple, the application functions are convenient and easy for use, and the application work smoothly without jamming. In addition, the experts are satisfied with these items: the application’s functions are arranged in a suitable order from easy to the difficult levels, the application’s functions influentially attract the users to perform what they wanted to do while using, the application’s content and data are correctly responding to the user’s needs. For UXD, the experts are highly satisfied with all items: the application display is suitably composed with font, graphic image, and space, the color, font and graphic images are selected appropriately, the size of font and graphic image is suitable selected and used, the functioning button and form-fill feature are suitably designed and simply usable for filling up, the similar features were listed in the same group, the language use is simple and suitable, the color and background are properly selected to match the font and controlling buttons, the light and shade, depth, and convexity is suitably used for 3D controller, and the contents are well-arranged and easy to read on the display.
Lastly, the end users are highly satisfied with the overall performances of the prototype. This means that the end users are satisfied with all items: the display design is universal and simply understandable, the application download and installation are convenient, the data and contents are responding to the user needs, the blood donation appointment calendar is available, the application is created with an attractive design, the functions are ranged from easy to difficult parts, the blood donation notification is available, the language use is simple and suitable, the data and content are ranged in a proper order and suitable for use, the data and contents are appropriately arranged and easy to read on the display, the data can be rapidly downloaded on the application, the application design clearly signifies the uniqueness of Suddhavej Hospital, MSU, and the user general health information as a blood donor is systematically recorded.
4.2 Discussion
The findings of this study were consistent with those of the prior study (e.g., [15-21]) that applications have positive impacts on blood donation intention. The needs analysis in this study indicated what the users demanded for blood donation. The information from the needs analysis was input for designing and developing a U-Blood mobile application prototype.
The needs analysis in this study helped reduce negative human factors on blood donation. The information drawn from the users in needs analysis helped understand the users’ attitudes and knowledge which are keys to success of the reasons for donating blood, like the findings of several studies [19, 20, 22].
Like the findings of the Ref. [29], the developed prototype in this study was designed appropriately based on the information from the needs analysis with the aim to raise greater awareness and motivation to blood donation and follow up on people's opinions about donating blood. The experts were highly satisfied with the efficiency of the prototype. In addition, the evaluation by the target users is needed as indicated by Lowdermilk [31] and Zucoloto and Martinez [32], the results of the end users evaluation through a questionnaire revealed the application meet their demands.
However, there are a few limitations in this study. The developed application may not be able to meet all of the users’ demands as revealed in the needs analysis. Although the overall results were positive and promising, they cannot be generalized in the long term. In addition, the developed application has not been able to monitor the condition of a human body as suggested by Nakano et al. [33] and communicate through the intersymbol interference (ISI) as suggested by Chang et al. [34]. Future inquiries should work on these limitations.
The author is grateful to Mahasarakham University for research fund.
Appendix 1 Expert evaluation of U-Blood prototype (UXD)
1–5 scores stand for “strongly disagree”, “disagree”, “neutral’, “agree”, and “strongly agree”, respectively.
|
Expert evaluation of U-Blood prototype |
1 |
2 |
3 |
4 |
5 |
|
1. The application can be downloaded and installed easily via the QR Code. |
|
|
|
|
|
|
2. The application work smoothly without jamming. |
|
|
|
|
|
|
3. The linkage of each component in the application is correct and suitable. |
|
|
|
|
|
|
4. The application’s functions are arranged in a suitable order from easy to the difficult levels. |
|
|
|
|
|
|
5. The application functions influentially attract the users to perform what to do while using it. |
|
|
|
|
|
|
6. The data downloading speed on the application is suitable. |
|
|
|
|
|
|
7. The application’s content and data are correctly responding to the user’s needs. |
|
|
|
|
|
|
8. The application design is totally universal and simple. |
|
|
|
|
|
|
9. The application functions are convenient and easy for use. |
|
|
|
|
|
Appendix 2 Expert evaluation of U-Blood prototype (UID)
1–5 scores stand for “strongly disagree”, “disagree”, “neutral’, “agree”, and “strongly agree”, respectively.
|
Expert evaluation of U-Blood prototype |
1 |
2 |
3 |
4 |
5 |
|
1. The application display is suitably composed with ont, graphic image, and space. |
|
|
|
|
|
|
2. The color, font and graphic images are selected appropriately. |
|
|
|
|
|
|
3. The size of font and graphic image is suitable selected and used. |
|
|
|
|
|
|
4. The color and background are properly selected to match the font and controlling buttons. |
|
|
|
|
|
|
5. The light and shade, depth, and convexity is suitably used for 3D controller. |
|
|
|
|
|
|
6. The functioning button and form-fill feature are suitably designed and simply usable for filling up. |
|
|
|
|
|
|
7. The contents are well-arranged and easy to read on the display. |
|
|
|
|
|
|
8. The similar features were listed in the same group. |
|
|
|
|
|
|
9. The language use is simple and suitable. |
|
|
|
|
|
[1] Thaiwebsites.com. (2022). Traffic Accident Statistics for Thailand. https://www.thaiwebsites.com/caraccidents.asp, accessed on 23 June 2022.
[2] Don't Drive Drunk Foundation. (2020). https://www.adsoftheworld.com/campaigns/beer-6be39e01-d907-4c9b-81d0-0bec0f94651b, accessed on 23 June 2022.
[3] Alanzi, T., Alsaeed, B. (2019). Use of social media in the blood donation process in Saudi Arabia. Journal of Blood Medicine, 10: 417. https://doi.org/10.2147/JBM.S217950
[4] May Rodrigues, R.S., Reibnitz, K.S. (2011). Strategies for attracting blood donors: An integrative literature review. Texto & Contexto Enfermagem, 20(2): 384-391. http://dx.doi.org/10.1590/S0104-07072011000200022
[5] Cechetti, N.P., Bellei, E.A., Biduski, D., Rodriguez, J.P.M., Roman, M.K., De Marchi, A.C.B. (2019). Developing and implementing a gamification method to improve user engagement: A case study with an m-Health application for hypertension monitoring. Telematics and Informatics, 41: 126-138. https://doi.org/10.1016/j.tele.2019.04.007
[6] Abbasi, R.A., Maqbool, O., Mushtaq, M., Aljohani, N.R., Daud, A., Alowibdi, J.S., Shahzad, B. (2018). Saving lives using social media: Analysis of the role of twitter for personal blood donation requests and dissemination. Telematics and Informatics, 35(4): 892-912. https://doi.org/10.1016/j.tele.2017.01.010
[7] Canadian Blood Services, Canadian blood services launches new tool to engage young donors. (2017). https://www.blood.ca/en/media/canadianbloodserviceslaunches-new-tool-engage-young-donors, accessed on 23 December 2019.
[8] Gomes, M.J., Nogueira, A.J., Antão, C., Teixeira, C. (2019). Motivations and attitudes towards the act of blood donation among undergraduate health science students. Transfusion and Apheresis Science, 58(2): 147-151. https://doi.org/10.1016/j.transci.2018.12.018
[9] Brislin, S.J., Venables, N.C., Drislane, L.E., Blonigen, D.M., Iacono, W.G., Tellegen, A., Edens, F., Patrick, C.J. (2017). Further validation of triarchic psychopathy scales from the Multidimensional Personality Questionnaire: Setting the stage for large-sample etiological studies. Assessment, 24(5): 575-590. https://doi.org/10.1177/1073191115621790
[10] Periyanayagi, S., Manikandan, A., Muthukrishnan, M., Ramakrishnan, M. (2021). BDoor app-blood donation application using android studio. In Journal of Physics: Conference Series, 1917(1): 012018. https://doi.org/10.1088/1742-6596/1917/1/012018
[11] Kamalesh, M.S., Chokkalingam, B., Arumugam, J., Sengottaiyan, G., Subramani, S., Shah, M.A. (2021). An intelligent real time pothole detection and warning system for automobile applications based on IoT technology. Journal of Applied Science and Engineering, 24(1): 77-81. http://dx.doi.org/10.6180/jase.202102_24(1).0010
[12] Ouhbi, S., Fernández-Alemán, J.L., Pozo, J.R., Bajta, M.E., Toval, A., Idri, A. (2015). Compliance of blood donation apps with mobile OS usability guidelines. Journal of Medical Systems, 39(6): 1-21. https://doi.org/10.1007/s10916-015-0243-1
[13] Saad, A.S.A., Christensen, L.R. (2019). Improving and supporting blood donation practices in khartoum, sudan blood banks through android mobile app and web application system. International Journal of Computer Science Trends and Technology, 7(2): 83-92.
[14] Chen, L., Zhou, Y., Zhang, S., Xiao, M. (2022). How anxiety relates to blood donation intention of non-donors: the roles of moral disengagement and mindfulness. The Journal of Social Psychology, 1-16. https://doi.org/10.1080/00224545.2021.2024121
[15] Lopes, T.O. (2021). Use of artificial intelligence in blood donation: A literature review. Hematology, Transfusion and Cell Therapy, 43: S355. https://doi.org/10.1016/j.htct.2021.10.603
[16] Brislin, M.A., Mayan, J.A., Canessane, R.A., Hamlin, M.A. (2017). Blood donation and life saver app. In 2017 2nd International Conference on Communication and Electronics Systems (ICCES), pp. 446-451. https://doi.org/10.1109/cesys.2017. 8321318
[17] Dutta, L., Maji, G., Ghosh, P., Sen, S. (2019). An integrated blood donation campaign management system. In Contemporary Advances in Innovative and Applicable Information Technology, pp. 133-143. https://doi.org/10.1007/978-981-13-1540-4_14.
[18] Ludolph, R., Schulz, P. J. (2015). Does regulatory fit lead to more effective health communication? A systematic review. Social Science & Medicine, 128: 142-150. https://doi.org/10.1016/j.socscimed.2015.01.021
[19] France, C.R., France, J.L., Himawan, L.K., Stephens, K.Y., Frame‐Brown, T.A., Venable, G.A., Menitove, J.E. (2013). How afraid are you of having blood drawn from your arm? A simple fear question predicts vasovagal reactions without causing them among high school donors. Transfusion, 53(2): 315-321. https://doi.org/10.1111/j.1537-2995.2012.03726.x
[20] France, C.R., France, J.L. (2018). Fear of donation‐related stimuli is reported across different levels of donation experience. Transfusion, 58(1): 113-120. https://doi.org/10.1111/trf.14382
[21] Pereira, J.R., Sousa, C.V., Matos, E.B.D., Rezende, L.B.O., Bueno, N.X., Dias, Á.M. (2016). To donate or not donate, that is the question: an analysis of the critical factors of blood donation. Ciencia & Saude Coletiva, 21(8): 2475-2484. https://doi.org/10.1590/1413-81232015218.24062015
[22] Enawgaw, B., Yalew, A., Shiferaw, E. (2019). Blood donors’ knowledge and attitude towards blood donation at North Gondar district blood bank, Northwest Ethiopia: A cross- sectional study. BMC Research Notes, 12(1): 1-6. https://doi.org/10.1186/s13104-019-4776-0
[23] Murtagh, C.M., Katulamu, C. (2021). Motivations and deterrents toward blood donation in Kampala, Uganda. Social Science & Medicine, 272: 113681. https://doi.org/10.1016/j.socscimed.2021.113681
[24] Eshak, E.S., Ghazawy, E.R., Rahman, A.E., Tarek, A., Hafez, S.M. (2019). Crossing the wide gap between positive attitude towards blood donation and its poor practice among university students: can knowledge and demographic characteristics help?! Journal of Public Health, 27(3): 329-337. https://doi.org/10.1007/s10389-018-0954-0
[25] Zucoloto, M.L., Gonçalez, T.T., Gilchrist, P.T., Custer, B., McFarland, W., Martinez, E.Z. (2019). Factors that contribute to blood donation behavior among primaryhealthcare users: A structural approach. Transfusion and Apheresis Science, 58(5): 663-668. https://doi.org/10.1016/j.transci.2019.08.020
[26] Roman, M.K., Bellei, E.A., Biduski, D., Pasqualotti, A., De Araujo, C.D.S.R., De Marchi, A.C.B. (2020). “Hey assistant, how can I become a donor?” The case of a conversational agent designed to engage people in blood donation. Journal of Biomedical Informatics, 107: 103461. https://doi.org/10.1016/j.jbi.2020.103461
[27] Padilla-Grrido, N., Fernández-Herrera, M.D., AguadoCorrea, F., Rabadán-Martín, I. (2021). Motivators, barriers and communication channels for blood donation in relation to students at a university in Spain. Transfusion and Apheresis Science, 60(6): 103270. https://doi.org/10.1016/j.transci.2021.103270
[28] Duh, H.I., Dabula, N. (2021). Millennials’ socio-psychology and blood donation intention developed from social media communications: A survey of university students. Telematics and Informatics, 58: 101534. https://doi.org/10.1016/j.tele.2020.101534
[29] Martín‐Santana, J.D., Beerli‐Palacio, A. (2013). Intention of future donations: a study of donors Versus non‐donors. Transfusion Medicine, 23(2): 77-86. https://doi.org/10.1111/tme.12005
[30] Ramondt, S., Kerkhof, P., Merz, E.M. (2021). Blood donation narratives on social media: A topic modeling study. Transfusion Medicine Reviews, 36(1): 58-65. https://doi.org/10.1016/j.tmrv.2021.10.001
[31] Lowdermilk, T. (2013). User-Centered Design: A Developer's Guide to Building User-Friendly Applications. O’Reilly Media, Inc.
[32] Zucoloto, M.L., Martinez, E.Z. (2018). Blood donation knowledge questionnaire (BDKQ- Brazil): Analysis of items and application in primary healthcare users. Hematology, Transfusion and Cell Therapy, 40(4): 368-376. https://doi.org/10.1016/j.htct.2018.03.006
[33] Nakano, T., Moore, M.J., Wei, F., Vasilakos, A.V., Shuai, J. (2012). Molecular communication and networking: Opportunities and challenges. IEEE Transactions on Nanobioscience, 11(2): 135-148. https://doi.org/10.1109/TNB.2012.2191570
[34] Chang, G., Lin, L., Yan, H. (2017). Adaptive detection and ISI mitigation for mobile molecular communication. IEEE Transactions on Nanobioscience, 17(1): 21-35. https://doi.org/10.1109/tnb.2017.2786229