Boonrit Pongsatitpat | Krittanon Prathepha | Jagraphon Obma | Worawat Sa-Ngiamvibool*
© 2022 IIETA. This article is published by IIETA and is licensed under the CC BY 4.0 license (http://creativecommons.org/licenses/by/4.0/).
OPEN ACCESS
This article presents the segmentation of the brain tumors in the MRI images by using the optimal morphology thresholding methods. The number of patients with brain diseases is increased. Therefore, the needs for MRI are increased. Accordingly, the accurate and quick segmentation and identification methods for the brain tumors are really necessary. These also include planning and diagnosis tools for the automatic segmentation of the brain tumors in the MRI images. The optimal morphology thresholding methods are new methods that can automatically solve problems and diagnose the diseases. These consist of the RGB to Grayscale conversion process, the image quality improvement process and the optimum thresholding process, respectively. By testing the methods with the MRI images, it was found that the proposed methods could automatically segment the brain tumors in the MRI images with the shapes similar to that from the public databases. The highest absolute error was 3.96%, and the accuracy was 98.00% as compared to the other methods.
brain tumors, threshold, morphology, segmentation, MRI images
Brain tumors are the abnormal tissues in brains that cause neurological and brain disorders leading to symptoms such as serious headache, dizziness, vomit and stroke as well as speaking, listening and visual problems. The brain tumors can change into cancers if the brain tumors are not treated. Primarily, the brain tumors are medically diagnosed. Thus, the algorithms for the automatic segmentation of the images applied to computerized tomography (CT) scan [1], positron emission tomography (PET) scan [2, 3] and magnetic resonance imaging (MRI) [4-12] for segmenting the images of the brain tumors from the images of CT, PET and MRI, respectively. There are preprocessing and post processing developments. The preprocessing developments include morphology that can enable users to improve data from the segmentation by themselves or automatically.
The CT scan images basically are medical images used for developing methods, especially for the segmentation of the brain tumors such as the automatic identification of the abnormal concentrations from the CT scan images. The proposed algorithms could identify the brain tumors in the CT scan images and correctlysegment3D areas of the brain tumors. The processing time could be reduced [1]. However, this identification method could not identify the brain tumors in the CT scan images with interferences and insignificant concentrations. Then, there were trends to develop the segmentation in optimal thresholding methods for the brain tumors from the positron emission tomography (PET) scan images with lower resolutions and inferences than the CT scan images. These included the identification of the optimal histogram by applying the Gaussian models for minimizing the number of functions [2] and the iteration method for removing the background images and having two grouping steps, respectively [3]. The histogram method was widely used and based on the probability of the gray value of a class and the consideration of the spatial data of medical image segmentations [2]. Nonetheless, the optimal histogram method applying the Gaussian models required abundant data in order to obtain optimal results and it had lower performance regarding the classification of problems. On the other hand, the iteration method under the classification of problems was efficient for identifying small tumors by relying on the intensities of the pixels in different images in order to segment and classify tumors according to the connections for eliminating positive areas that were not needed, respectively [3]. Then, all components of the images were divided into groups before using the fuzzy c-means clustering (FCM) method for the classification and the segmentation of the brain tumors in the images from the positron emission tomography (PET) scan. Nevertheless, the iteration method was appropriate for the images with high intensities.
Magnetic resonance imaging (MRI) is a tool with high resolutions and commonly used for identifying the abnormalities of tissues more efficiently than other imaging methods, for example, diagnosing, making treatment plans for and following up the brain tumors under the variety of imaging methods, selecting the thickness of slices and the features of MRI scanners [13]. Although the efficient segmentation and the identification of the brain tumors were not as important as treatments and plans; the segmentation and the identification were useful for evaluating and following up treatments, improving the efficiency of the identification with the color changes as well as the different brightness, contrast, sizes and locations of brainstems. These were challenging and useful for treatments. Generally, there were various methods including threshold level and morphological watershed segmentation. The threshold level based on white matters and gray matters is optimal in the case of the segmentation of the brain tumors from the MRI images with different brightness levels only, while the morphological watershed segmentation uses the MRI images of brains with similar brightness levels. Both methods required the MRI images without interferences, quite clear tumors and the color segmentation algorithms with K-means in order to convert the colored MRI images into grayscale images and to segment the tumors with the histogram-clustering method that can clearly differentiate the tumors [4]. Then, the color segmentation algorithms with K-means and the histogram-clustering method were applied to the MRI images of the 20 patients with the four types of tumors by considering and comparing the segmentation results of the anatomy images [14]. However, the accuracy and reliability of the brain tumors segmentation and its iteration were important problems of the applications in this algorithm. Therefore, the segmentation with the fuzzy c-means (FCM) and the neural networks were proposed for more accurately and reliably segmenting parts from the MRI images as well as preventing duplicated segmentations [5, 6]. There was also the feature extraction for identifying the brain tumors from the MRI images with the neuro fuzzy classifier [7]. Moreover, there was the improvement of the accuracy and the efficiency of the segmentation units with the support vector machine (SVM) [8, 15].
Nonetheless, the accuracy and reliability of the brain tumors segmentation as well as the feature extraction of the brain tumors from the MRI images with the learning methods must start from accurately segmenting the brain tumors under the variety of the imaging methods, the slice selection and the features of the MRI scanners. There are very few research studies presenting the segmentation methods for brain tumors [10]. There is only the application of the gray level co-occurrence matrix (GLCM) algorithm for differentiating the brightness of the pixels of the grayscale images with the four grayscale levels and the application of the probabilistic neural network (PNN) for segmenting the tumors from the unused parts [10]. There are also the adjustment of the brightness of the original MRI images with the histogram method for dispersing the brightness of colors and the morphological watershed method for segmenting the brain tumors from the MRI images [11].
To differentiate the brightness, adjust the brightness and segment the morphology of the MRI images; the experiences of users are important [16].
Hence, this article presents the segmentation methods for the brain tumors from the MRI images with the iterative Gaussian filtering method, the calculation of the variances and the means of the numbers of the pixels of the objects and backgrounds, the calculation of the appropriate segmentation points for the morphology and the erosion with the image enlargements for automatically improving the structures of the images of the brain tumors without relying on the experiences of users in order to correctly identify and specify the sizes of the brain tumors as well as to minimize the processing time for correctly and efficiently supporting physician’s diagnoses and treatments.
The segmentation methods for the brain tumors from the MRI images with the iterative Gaussian filtering method, the calculation of the variances and the means of the numbers of the pixels of the objects and backgrounds, the calculation of the appropriate segmentation points for the morphology and the erosion with the image enlargements for automatically improving the structures of the images of the brain tumors were applied to the four main processes: the RGB to Grayscale conversion process, the image quality improvement process and the optimum thresholding process and the optimum thresholding process, respectively, as shown in Figure 1. Particularly, the quality improvement process required the qualities of the images being tested to have the appropriate features for the uses. This image quality improvement process consists of the intensity manipulation technique, the global contrast enhancement technique and the noise removal technique. Based on their criteria of these techniques, the features of all images form database image are appropriate for the uses. However, the different images might have different brightness, contrast and darkness. Thus, the qualities of the images must be improved for the segmentation.
Figure 1. Proposed algorithm
2.1 MRI images database
The MRI images in the experiment were the images from the public database, https://ncigt.org/. The sizes of the images were different, the color depth was 24 bits, the color type was true color and the total number of the images was 100. The examples of the MRI images are in Figure 2.
Figure 2. The Examples of the MRI Images from the Public Database, https://ncigt.org/
As shown in Figure 2, the color images are converted into grayscale images for facilitate the analysis. Also, grayscale images are more suitable for certain techniques such as the intensity manipulation, the global contrast enhancement and the noise removal.
2.2 RGB to grayscale conversion process
The MRI images are RGB images. Thus, each coordinate of the images has the set values showing the value of R, the value G and the value of B. The images are converted into grayscale images for facilitating the analysis because each coordinate of the grayscale images has the color intensity from 0 to 255.As the grayscale is the simplest model since it defines colors using only one component that is lightness. Therefore, the RGB images are converted to grayscale using the weighted sum of the red, green and blue color components and assign it to corresponding location of RGB image.
2.3 Image quality improvement process
This process is the image quality improvement process including the intensity manipulation adjustment, the global contrast enhancement and the noise removal as show in Figure 3 in order to image the image qualities before the RGB to grayscale conversion process because the different images have the different light intensities, contrasts and darkness levels. Therefore, the image qualities must be optimal for the segmentation including the following subprocesses.
Figure 3. Image quality improvement process
2.3.1 Intensity manipulation
The intensity manipulation relies on the histogram equalization in order to flatten the probability distribution function (PDF). As a result, PDF for the intensity after the manipulation is close to be a uniform with the cumulative distribution function (CDF) as shown in Eq. (1).
$S_{k}=T\left(r_{k}\right)=\sum_{j=1}^{k} \frac{n_{j}}{n}$ (1)
where, rk, sk, k, nj and n are input intensity, processed intensity, the intensity range (e.g. 0.0-1.0), the frequency of intensity j and the sum of all frequencies, respectively. The histogram equalization equalized the intensities of the images in order to reveal the hidden details, especially in the areas with high densities. According to Figure 3, it could be seen that the images with the histogram equalization had the equalized intensities all over the images. Since, the histogram equalization could be a computer image preparing method utilized to progress contrast in images. This strategy as rule increments the global contrast of images when it usable represented by close contrast values. This allows for regions of lower local contrast to gain a higher contrast. In other words, there were almost all brightness levels. This equalization impaired the visibilities of the images or the visions of humans because the histogram equalization decreased the contrasts.
2.3.2 Global contrast enhancement
After the intensities or the brightness was equalized, the contrasts of the images were reduced. Hence, the global contrast enhancement was the methods that differentiate the colors of the intensities in order to enhance the contrasts of the objects or from the interested areas to the surrounding areas or the backgrounds as stated in Eq. (2).
$S_{k, g l o b a l}=T\left(r_{k}\right)=\frac{(L-1)}{M N} \sum_{j=0}^{k} n_{j}$ (2)
where, rk, Sk,global, k, nj and MN are input intensity, processed global intensity, the intensity range (0, 1, 2 … L-1), the frequency of intensity j and the number of all pixels, respectively. The contrasts were set by the ratio of the brightness and the intensity of the darkest point. This method was simple and quick. The results of the global contrast enhancement after the histogram equalization were shown in Figure 3. According to Figure 3, the global contrast enhancement affected the overall difference of the images. Unfortunately, the details of the images were clear and similar to the perceptions or human visions for differentiating objects.
2.3.3 Noise removal
The noises in the images must be erased some details in the images. As gaussian filter is a linear filter. It's usually used to blur the image or to reduce noises. Therefore, the noise removal with the gaussian filter could result in more details and good qualities because the filter could reduce noises without affecting the signals at different locations such as the gaps between convolutions by using the convolution method with the mask or kernel as stated in Eq. (3).
$g(x, y)=\omega * f(x, y)=\sum_{d x=-a}^{a} \sum_{d y=-b}^{b} \omega(d x, d y) f(x-d x, y-d y)$ (3)
where, g(x,y), f(x,y) and ω are the filtered image, the original image and the 3×3 filter kernel, respectively. Every element of the filter kernel is considered by -a≤dx≤a and -b≤dy≤b. The example of the image of the brain tumor after the noise removal is shown in the Figure 3.
2.4 Optimum thresholding
Generally, the histogram graphs of the brain tumors from the MRI images have more than one intensity of the objects that being segmented. This requires experiences to handle the graphs. Thus, this article presents the automatic thresholding (T) method that can optimally identify thresholds without requiring experiences. The mathematical basis for the method proposed is means of the grayscale values. Since, the mean is a basic feasible solution. It replied on finding the median of many segments and improved Otsu’s methods. It has the following steps.
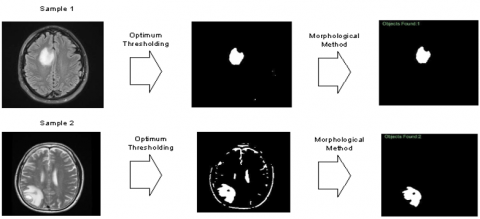
According to Figure 4, the automatic thresholding method only identified the optimal threshold that might be the correct threshold and resulted in undesirable segments of the brain tumors from the MRI images because there were only two group levels: white and black. Particularly, the pixels with the greyscale levels were lower than the optimal threshold would be considered as black. On the other hand, the pixels with the greyscale level were higher than the optimal threshold would be considered as white. Consequently, there were wanted and undesirable segments. These segment problems could be solved by applying the morphological methods [17] which especially using erosion in order to erase the undesirable segments and dilation for making the sizes of the images as similar as possible to that of the original images.
Figure 4. The example of the optimal thresholding method and the morphological methods
This section presents the comparison of the results from the optimal thresholding process method and the other methods as well as the measured the performance of the optimal thresholding method.
3.1 Experimental dataset
To test the optimal thresholding method, the data of the brain tumors from the 100 MRI images in the public database of the Ferenc Jolesz National Center for Advanced Technologies Image Guided Therapy Department of Radiology, Brigham and Women's Hospital, Harvard Medical School (https://ncigt.org/) were used. These included the images of the brain tumors and the images of the brain tumors which analyzed by the experts for the users to identify the locations and the sizes of the brain tumors. The processing tools consisted of a computer with Intel Core i7 2.80GHz CPU, 16 GB memory, Windows 10 operating system and MATLAB 2016a program.
3.2 Algorithm evaluation
There were many evaluation methods. The common measurement metrics were accuracy, specificity and sensitivity. The accuracy was the ratio of the number of the correct images with the brain tumors. The specificity was the proportion of correct images without the brain tumors. The sensitivity was the proportion of correct images with the brain tumors. Generally, the accuracy (Acc) was used for evaluating the segmentation of the brain tumors from the MRI images as stated in Eq. (4).
$\% A c c=\frac{T P+T N}{T P+F P+F N+T N} \times 100$ (4)
where, TP, FP, FN and TN are the true positive images, the false positive images, the false negative images and the true negative images, respectively.
Not only the accuracy, but the erroneous number of the pixels of the brain tumors was also another index of the performance. The number of the pixels of the brain tumors from the segmentation was counted and compared to that from the public database.
3.3 Performance on the proposed methods
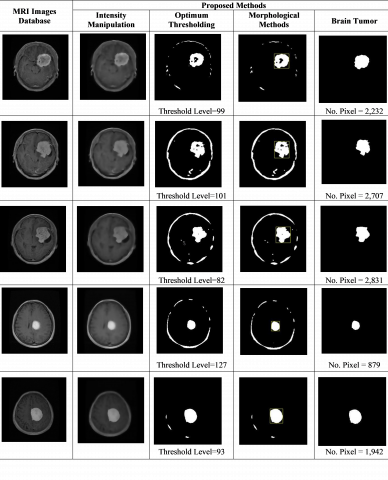
For testing each process of the optimal thresholding method of the brain tumors from the MRI images, five images were randomly selected from the public database in order to present the test results of the intensity manipulation, the optimum thresholding method and the morphological methods used to identify the brain tumors as shown in Figure 5.
Figure 5. The results from testing the optimal thresholding method
According to Figure 5, the intensity manipulation was the histogram equalization in order to make the intensities as close as possible to the uniform and to clearly affect the differences of the areas in the images that could reveal the details of the images and be similar to the perceptions or the visions of humans about differentiating objects. The optimum thresholding method was the main method that automatically and correctly identified the optimum thresholds without requiring experiences. As a result, the different thresholds were obtained (99 101 82 127 and 93 respectively). However, the optimal thresholds might not be the correct thresholds. Consequently, the undesirable parts of the segmentation might be obtained. Thus, it required the improvements with the morphological methods. Particularly, the erosion was needed in order to remove the undesirable parts from the images. Dilation was also needed in order to make the sizes of the images as close as possible to the original sizes. The numbers of the pixels of the brain tumors were different (2,232 2,707 2,831 879 and 1,942 respectively).
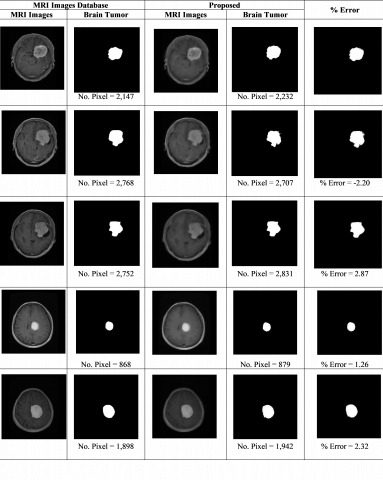
According to Figure 6, the erroneous numbers of the pixels of the brain tumors from the optimal thresholding method are shown and compared to the samples from the public database. It was found that the shapes of the brain tumors from the optimal thresholding method were similar to that from the public database. The numbers of the pixels of the brain tumors from the optimal thresholding method had the maximum absolute error of 3.96%.
Not only testing the optimal thresholding method and identifying the erroneous numbers of the pixels of the brain tumors from the optimal thresholding method, but Table 1 also shows the comparison of the accuracies (Acc) of the optimal thresholding method and the other methods. The proposed method could identify and segment the brain tumors from the 100 MRI images. The accuracy was 98%. By comparing it to the other methods, it was found that its accuracy was higher than that of the histogram [4], Morphology [18], Neuro Fuzzy Classifier [10] and Fuzzy C-means [8], respectively.
Figure 6. The erroneous numbers of the pixels of the brain tumors from the optimal thresholding method
Table 1. The results of the segmentation of the brain tumors by the proposed method and the other methods
|
Methods |
Authors |
Acc. (%) |
|
Histogram |
Chen et al. [4] |
94.13 |
|
Morphology |
Wisaeng and Sa-ngiamvibool [18] |
95.06 |
|
NeuroFuzzy Classifier |
Joshi et al. [10] |
95.81 |
|
Fuzzy C-means (FCM) |
Wisaeng and Sa-ngiamvibool [8] |
97.89 |
|
Optimum Morphology Thresholding |
This proposed |
98.00 |
A brain tumor is the abnormal mass of the tissues in brains that are mainly diagnosed from medical images. Therefore, this article proposed the algorithm for the automatic segmentation of the brain tumors from the MRI images by using the iterative Gaussian filtering method, the calculation of the variances and the means of the numbers of the pixels of the objects and backgrounds, the calculation of the appropriate segmentation points for the morphology and the erosion with the image enlargements for automatically improving the structures of the images of the brain tumors with the RGB to Grayscale conversion process, the image quality improvement process and the optimum thresholding process, respectively. As a result, the shapes of the brain tumors were similar to the samples which obtained from the public database. This is useful for evaluating treatments, improving the efficiency of searching for the tumors, and supporting the treatments with the color changes as well as the different brightness, contrasts, sizes and locations of brain components.
The authors are grateful to the Electrical and Computer Engineering Program, Faculty of Engineering, Mahasarakham University, Thailand, for his useful suggestions.
[1] Biratu, E.S., Schwenker, F., Ayano, Y.M., Debelee, T.G. (2021). A survey of brain tumor segmentation and classification algorithms. Journal of Imaging, 7(9): 179-192. https://doi.org/10.3390/jimaging7090179
[2] Chen, B., Qiu, F., Wu, B., Du, H. (2015). Image segmentation based on constrained spectral variance difference and edge penalty. Remote Sens, 7(5): 5980-6004. https://doi.org/10.3390/rs70505980
[3] Lian, C., Ruan, S., Denœux, T., Li, H., Vera, P. (2019). Joint tumor segmentation in PET-CT images using co-clustering and fusion based on belief functions. IEEE Trans Image Process, 28(2): 755-766. https://doi.org/10.1109/TIP.2018.2872908
[4] Chen, X., Wu, Y., Zhao, G., Wang, M., Gao, W., Zhang, Q., Lin, Y. (2019). Automatic histogram specification for glioma grading using multicenter data. Journal of Healthcare Engineering, 2019: 9414937. https://doi.org/10.1155/2019/9414937
[5] Wu, M.N., Lin, C.C., Chang, C.C. (2007). Brain tumor detection using color-based K-means clustering segmentation. Third International Conference on Intelligent Information Hiding and Multimedia Signal Processing, Kaohsiung, Taiwan, pp. 245-250. https://doi.org/10.1109/IIHMSP.2007.4457697
[6] Wisaeng, K., Sa-ngiamvibool, W. (2020). Detection of plant leaf diseases using K-mean++ intermeans thresholding algorithm, Journal of Computer Science, 16(9): 1237-1249.
[7] Manimegala, R., Priya, K., Ranjana, S. (2020). Brain cancer classification using artificial neural network. European Journal of Molecular & Clinical Medicine, 7(9): 1476-1485. https://doi.org/10.31838/ejmcm.07.09.159
[8] Wisaeng, K., Sa-ngiamvibool, W. (2018). Improved fuzzy C-means clustering in the process of exudates detection using mathematical morphology. Soft Computing, 22(8): 2753-2764. https://doi.org/10.1007/s00500-017-2532-8
[9] Rao, K.S., Sridhar, M. (2021). A tabu search algorithm for general threshold visual cryptography schemes. Ingénierie des Systèmes d’Information, 26(3): 329-335. https://doi.org/10.18280/isi.260310
[10] Joshi, D.M., Rana, D.N.K., Misra, V.M. (2010). Classification of brain cancer using artificial neural network. 2010 2nd International Conference on Electronic Computer Technology, Kuala Lumpur, Malaysia, pp. 112-116. https://doi.org/10.1109/ICECTECH.2010.5479975
[11] Sudharani, K., Sarma, T.C., Prasad, K.S. (2016). Advanced morphological technique for automatic brain tumor detection and evaluation of statistical parameters. Procedia Technology, 24: 1374-1387. https://doi.org/10.1016/j.protcy.2016.05.153
[12] Wisaeng, K., Sa-Ngiamvibool, W. (2018). Automatic detection and recognition of optic disk with maker-controlled watershed segmentation and mathematical morphology in color retinal images. Soft Computing, 22(19): 6329-6339. https://doi.org/10.1007/s00500-017-2681-9
[13] Yazdan-Shahmorad, A., Jahanian, H., Patel, S., Soltanian-Zadeh, H. (2007). Automatic brain tumor segmentation using tissue diffisivity characteristics. In 2007 4th IEEE International Symposium on Biomedical Imaging: From Nano to Macro, Arlington, VA, USA, pp. 780-783. https://doi.org/10.1109/ISBI.2007.356968
[14] Pergad, N.D., Kshitija, V.S. (2015). Brain MRI image classification using probabilistic neural network and tumor detection using image segmentation. International Journal of Advanced Research in Computer Engineering & Technology (IJARCET), 4(6): 2946-2951.
[15] Bahadure, N.B., Ray, A.K. (2017). Image analysis for Mri based brain tumor detection and feature extraction using biologically inspired BWT and SVM. International Journal of Biomedical Imaging, 1-12, https://doi.org/10.1155/2017/9749108
[16] Boonsivanon, K., Sa-Ngiamvibool, W. (2021). A SIFT description approach for non-uniform illumination and other invariants. Ingénierie des Systèmes d'Information, 26(6): 533-539. https://doi.org/10.18280/isi.260603
[17] Wisaeng, K., Sa-ngiamvibool, W. (2019). Exudates detection using morphology mean shift algorithm in retinal images. IEEE Access, 7: 11946-11958. https://doi.org/10.1109/ACCESS.2018.2890426
[18] Wisaeng, K., Sa-ngiamvibool, W. (2018). Automatic detection and recognition of optic disk with maker-controlled watershed segmentation and mathematical morphology in color retinal images. Soft Computing, 22: 6329-6339. https://doi.org/10.1007/s00500-017-2681-9