Janu Arlinwibowo | Heri Retnawati* | Badrun Kartowagiran
© 2021 IIETA. This article is published by IIETA and is licensed under the CC BY 4.0 license (http://creativecommons.org/licenses/by/4.0/).
OPEN ACCESS
Collaboration is an ability that develops in STEM learning and is very influential in 21st-century life. Thus, students' collaboration abilities must be detected properly. This study aims to produce a quality and easy-to-use instrument for assessing student collaboration skills in STEM classes. The research is development research that contains three steps, namely preliminary research, making prototypes, and conducting product evaluations. Methods of data collection using FGD and questionnaires. The FGD was carried out with experts to produce descriptive data and assessment instruments as well as questionnaires which were also development products with data in the form of graded scales 1, 2, 3, and 4. The study involved 187 junior high school students who took lessons in STEM classes. The instrument is a questionnaire with 4 graded answer choices. To ensure the quality of the instrument, the researcher conducted FGD and expert validation and proved the construct with CFA. The instrument profile was traced using the unidimensional graded response model (GRM) method of response analysis. The results showed that the final instrument containing 17 items was declared valid in terms of content and constructs, as well as reliable. The results of the item analysis show that all items have good sequential step parameters (b1 < b2 < b3), all items have a good discriminant index (0.995 ≤ ai ≤ 1.764), and the instrument is reliable for measuring students with an ability range of -6.15 < θ < 4.05. Thus, this instrument can define students' abilities well in a wide range of abilities.
collaboration ability, assessment scale, student, item response theory, STEM classes
Science, Technology, Engineering, and Mathematics (STEM) educational approaches have received increasing attention over the past decade [1]. The use of an integrated STEM curriculum provides opportunities to provide students with a more relevant experience [2]. The reason is that real-world problems are not fragmented in specific disciplines as taught in schools and to solve these problems people need skills that cross disciplines [3]. Science, Technology, Engineering, and Mathematics have strong links in real problems [4]. Thus, the STEM approach is used in various parts of the world to improve the quality of graduates [5-9].
Behind the positive impact of STEM implementation, there is a problem, namely the lack of instruments to measure learning achievement [10]. The assessment focuses on knowledge in one discipline [11] and on the domain of knowledge only. Thus, there are some moments and aspects that are left behind or not observed. Whereas STEM has a complex scientific domain coupled with collaboration and collaboration components [12].
Collaboration is a competency developed in learning with the STEM framework [13-15]. STEM learning is carried out through various complex activities that require teamwork [16]. Without teamwork, projects in STEM learning are difficult for students to complete [17]. Thus, collaboration skills can determine group success in STEM learning [18]. These group activities force students to practice their collaboration skills [19].
Collaboration is one of the competencies required to develop in the 21st century [20]. 21st-century skills represent characteristics that students must possess to overcome adversity and achieve success in post-secondary education and the workforce [21], and collaboration is one of the skills required. Even collaboration is a way to work in the 21st century [22]. This statement is based on the increasing complexity of problems so that one must be able to collaborate [23]. The work should be done by a team with complementary skills and roles [24, 25]. Thus, someone in the 21st century must understand competence as oneself and as a colleague [26].
Collaboration is a person's negotiating style in a team [27]. Collaboration is defined as an individual's competence in communicating with a team [28, 29], understanding the portion of work [30], adapting to friends [31], help and remind each other [32, 33], and contribute ideas to complete a project or work together [30, 34, 35].
Based on the description above, the collaboration ability of students in the learning process must be monitored properly, especially in learning with the STEM framework which in principle places collaboration as one aspect that must be developed. However, the current student collaboration ability assessment instrument has not been widely developed, if any, then the instrument is still not ideal. Many teachers conduct collaborative ability assessments using the observation method which is considered burdensome by teachers [36]. Observation instruments may be developed very well, but when implemented in the classroom, especially with a large number of students, the assessment technique has a low level of accuracy [37, 38]. In technical development, several instruments were found to measure students' collaboration abilities [16, 39-41] but there are several things that need to be criticized if it is to be directly applied to measure students' collaboration skills in STEM classes. First, the instrument was developed in general, which is not based on the context of STEM learning. Second, there are not many collaboration instruments that have been developed in stages by considering the content, the construction, and the quality of the items.
Thus, the aim of this research is to produce a quality student collaboration ability assessment instrument that is easy to use by teachers in STEM classrooms. The researcher chose to develop a questionnaire instrument to measure students' collaboration skills because with this instrument the data generated can provide a detailed profile for each student [42]. Researchers will also conduct a study of content [43], construct [44, 45], and item quality [46, 47] to ensure that the instrument is valid and consistent in measuring students' collaboration ability in STEM classes.
2.1 Research design
This research is a development research to produce an instrument for assessing student collaboration skills in STEM classes. The development process contains three steps, namely preliminary research, prototyping, and product evaluation [48]. Preliminary research was conducted to see field needs related to the product to be developed. The search was carried out by conducting literature studies, observations and interviews with practitioners. This initial study is used as the basis background the research. Prototyping is a product development process which according to the Ref. [49] contains elements of determining instruments, developing questions, and making instrument packages. The prototyping process produces a product draft which will then be validated for content, readability test, and small-scale test. The third step is product evaluation where the product will be tested on a larger scale. The data from the test results became the evaluation material which was analyzed in a construct and the character of the items. The results of the evaluation phase will produce a final product that can be implemented as a standard instrument.
2.2 Research participants criteria
The research was carried out from September 2020 – August 2021. The process of selecting participants was based on the school that held STEM learning during the pandemic. This condition is due to the fact that the majority of schools that carry out face-to-face meetings are able to organize STEM learning. The search found 4 schools that held STEM learning in the Provinces of the Special Region of Yogyakarta and Central Java. From the four schools, all classes that held STEM learning were taken, namely, 9 study groups consisting of 187 students. Selection All participants are students who are studying with a STEM framework. A questionnaire as the instrument of collaboration assessment was given to students at the end of the lesson.
2.3 Instrument development
The process of making items begins with collecting various theories related to the definition of collaboration. These various theories are elaborated and concluded into conceptual (latent) definitions. The conceptual definition of collaboration is reduced to an operational definition (a definition that can be measured). The operational definition is then used as the basis for developing indicators that can show students' collaboration abilities. The questionnaire items were developed based on 5 indicators, namely being able to communicate with the team, understanding the work portion, adapting to friends, helping and reminding each other, and contributing ideas. Each indicator is reduced to items of statements that make up the questionnaire instrument to measure collaboration capabilities.
The instrument consists of 20 items, namely 10 positive items and 9 negative items. Collaboration ability and students are given 4 response options to the given statement, namely SS = Strongly Agree, S = Agree, TS = Disagree, and STS = Strongly Disagree. The questionnaire chose to use the Likert scale because this scale is suitable for measuring human behaviors [45] such as collaboration ability. The reason for choosing 4 scales is so that the tendency of students' answers is clear towards agreeing or disagreeing. The instrument was then discussed in the FGD forum and validated by 5 experts which resulted in an average Aiken index of 0.95. Based on this index, the instrument has been proven to be content valid because the index value of Aiken is more than 0.75 [50].
2.4 Data analysis
The research data was collected through the questionnaire method, where the questionnaire was an instrument developed by the researcher. The first analysis is to test the adequacy of the sample using the KMO test. The KMO test is an initial assumption that must be proven before conducting factor analysis [51]. A KMO value above 0.5 indicates that the sample taken is adequate to continue in factor analysis [52, 53]. KMO values above 0.5 indicate that there is no diffusion in the correlation pattern so that the results of factor analysis can be interpreted. If the KMO result is less than 0.5, the factor analysis results does not necessarily result in a meaningful analysis [51].
Then, the instrument construct was analyzed based on the test results using confirmatory factor analysis (CFA) to confirm the suitability of the data with the theoretical construct as the basis for building the instrument. There are 3 requirements in the established CFA, namely meeting the model fit criteria, construct reliability, each manifest-path to significant latent, and standardized loading factor values.
Factor analysis was carried out with the help of LISREL software. The software was chosen because of its ability to identify complex relationships between variables. This software provides suggestions for modifying the construct to produce the appropriate construct to produce a match with the model.
The next step is to do item analysis using item response analysis. The instrument is a questionnaire with answer choices 1, 2, 3, 4 to produce polytomous data. Based on the characteristics of the data that shows the similarity of the distance between choices and each choice has a different level, the analysis model used is a graded response model [47, 54, 55] and the suitability of the data with the analysis model will be shown by the model. Plausible-Value Imputation Statistics or PV-Q1 [56].
Item response analysis was carried out with the help of the mirt package R software. The R application was chosen because it has the flexibility to analyze and display data. R also allows us to combine various packages to produce the required analytical output.
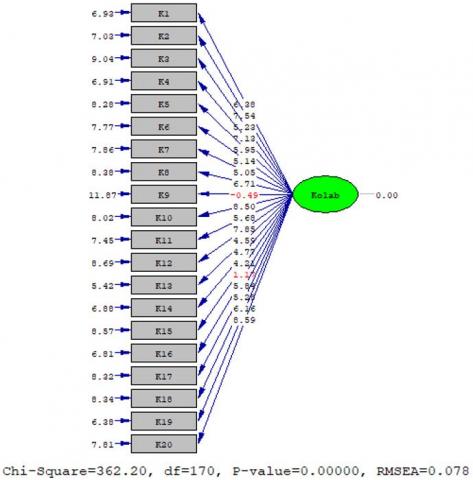
The construct validity of the questionnaire for assessing students' collaboration skills in learning mathematics with the STEM framework was proven by the confirmatory factor analysis (CFA). Confirmatory Factor Analysis aims to confirm the suitability of the factual data of the measurement results with the theory that forms the basis for the development of the instrument. Figure 1 shows that collaboration as latent is represented by various manifests. Items as manifest are derived based on expert definitions (in literature) related to collaboration. Based on the construct that has been designed, the collaboration ability questionnaire has a unidimensional nature or measures one latent, namely collaboration.
The data from the students' responses in doing the questionnaires were analyzed to prove the compatibility between theoretical and empirical constructs. The analysis process is carried out with the help of Lisrel software. Before conducting CFA, researchers must ensure the adequacy of the sample by conducting the KMO test, which is 0.781. Thus, the 187 samples in the trial met the assumption of data adequacy to be continued in factor analysis to prove the construct of the instrument because the KMO was more than 0.5 [53]
The construct of the instrument in accordance with the theory shows that there is one level of the latent variable (first-order), namely collaboration where the latent is translated into several manifests. The data were analyzed using Lisrel software with the construct as designed to produce the following results.
Figure 1. Preliminary CFA results
Based on Figure 1 above, according to RMSEA, it has shown the fit of the model because the value is < 0.8 but when viewed from the p-value, which is 0.0000, it is still very far from the model fit criteria, which is > 0.05. Thus, modification of the construct will be carried out by correlating the error covariance and removing items that do not have a significant relationship with latent or do not represent the latent variable. There were 3 questionnaire items that were omitted because statistically they could not show or represent latent, namely items K9, K15, and K16. The following is the result of the modification of the construct presented in Figure 2.
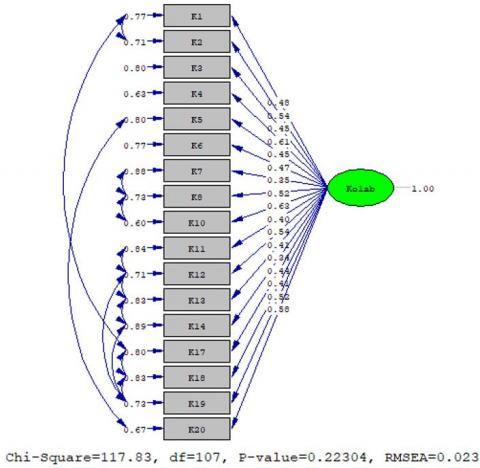
Figure 2. Standardize solution on modified construct
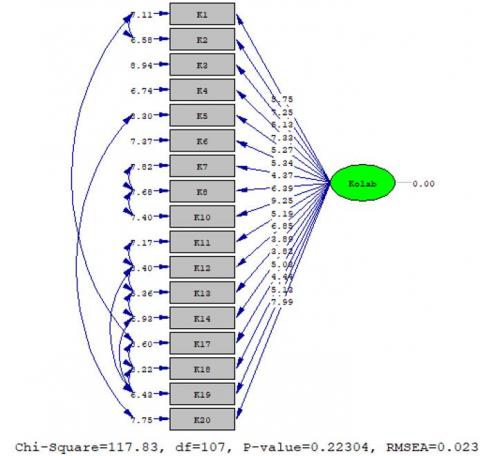
Figure 3. T-Value on modified construct
The constructs in Figure 2 and Figure 3 can be used as a basis for showing evidence of the construct validity of the student collaboration ability assessment instrument. All items show a significant relationship based on the T-value, which is above 1.96 (alpha = 5%). Then, the criterion that the manifest variable can represent the latent variable is the Standardized Loading Factor value of at least 0.3. Thus, it is proven that the construct in the collaborative ability assessment instrument is proven to be valid.
The next criterion used to ensure construct quality is reliability. The construct reliability index can be determined by considering the standardized loading factor value and standard error. The construct reliability coefficient is 0.836529 so that it meets the minimum standard of reliability.
Constructs that have been proven valid are used as the basis for conducting item analysis. The first step of the analysis is to prove the suitability of the analytical model, namely GRM, with the empirical data obtained by the researcher. The model fit test will use the Plausible-Value Imputation Statistics or PV-Q1 method. This method is suitable for instruments with a small number of the item. Chalmers & Ng [56] state that a model is said to be suitable when the p-value of PV-Q1 is more than 0.05. The suitability of each item with the model is presented in Table 1 below.
Based on the data value of p.PV_Q1 then all items show a value above 0.05 so that the empirical data has a match with the GRM analysis. Based on these facts, the next analysis process will be carried out with GRM analysis on the responses of 187 students when working on the student collaboration ability assessment instrument in the STEM class. Table 2 shows the parameter data of the items analyzed using the GRM model.
Table 1. Fit data with GRM
|
Item |
PV_Q1 |
df.PV_Q1 |
p.PV_Q1 |
|
K1 |
14.555 |
11.4 |
0.228 |
|
K2 |
8.566 |
5.9 |
0.192 |
|
K3 |
12.599 |
9.1 |
0.188 |
|
K4 |
8.063 |
5.867 |
0.222 |
|
K5 |
15.016 |
9.467 |
0.108 |
|
K6 |
14.902 |
7.033 |
0.038 |
|
K7 |
12.809 |
8.7 |
0.154 |
|
K8 |
7.89 |
5.833 |
0.231 |
|
K10 |
10.043 |
9.467 |
0.389 |
|
K11 |
13.158 |
8.567 |
0.133 |
|
K12 |
10.891 |
7.533 |
0.176 |
|
K13 |
7.362 |
4.233 |
0.134 |
|
K14 |
8.188 |
8.667 |
0.482 |
|
K17 |
16.842 |
13.467 |
0.233 |
|
K18 |
10.455 |
7.433 |
0.193 |
|
K19 |
6.538 |
2.8 |
0.076 |
|
K20 |
12.416 |
11.433 |
0.367 |
Table 2. Parameter items of student collaboration ability assessment instruments
|
Item |
a |
b1 |
b2 |
b3 |
|
K1 |
1.382 |
-2.094 |
-0.75 |
1.490 |
|
K2 |
1.487 |
-2.162 |
-1.439 |
1.434 |
|
K3 |
1.031 |
-4.807 |
-1.803 |
1.443 |
|
K4 |
1.764 |
-3.038 |
-1.681 |
0.690 |
|
K5 |
1.156 |
-2.596 |
-0.479 |
2.352 |
|
K6 |
1.112 |
-4.485 |
-2.257 |
1.067 |
|
K7 |
1.001 |
-4.225 |
-1.683 |
1.797 |
|
K8 |
1.439 |
-3.752 |
-1.589 |
1.303 |
|
K10 |
1.446 |
-2.612 |
-0.632 |
1.462 |
|
K11 |
1.073 |
-4.005 |
-2.141 |
0.983 |
|
K12 |
1.601 |
-3.213 |
-1.296 |
0.901 |
|
K13 |
1.32 |
-3.971 |
-2.657 |
0.97 |
|
K14 |
0.995 |
-4.997 |
-2.169 |
1.383 |
|
K17 |
1.202 |
-2.145 |
-0.26 |
1.661 |
|
K18 |
1.129 |
-3.193 |
-1.186 |
2.174 |
|
K19 |
1.627 |
-3.222 |
-1.963 |
1.251 |
|
K20 |
1.494 |
-1.917 |
-0.17 |
1.614 |
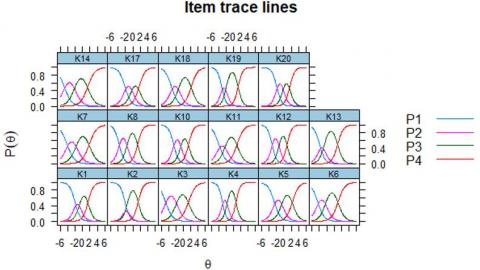
Based on the data in Table 2, it can be seen the value of each step parameter or the intersection of each curve symbolized by bi. Figure 4 displays a curve of the characteristics for each item as follows.
Figure 4. Items characteristic curve
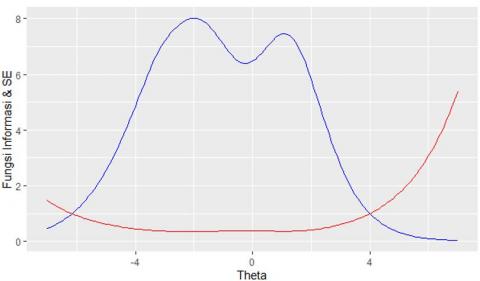
The next analysis related to the instrument profile is to see the value of the test information and the standard error of the test. The analysis will be used to determine the suitability of the instrument with students based on their abilities. Figure 5 will display a graphic image of the test information value and the standard error value of the test.
Figure 5. Information function curves and standard errors of collaboration ability instruments
The instrument for assessing students' collaboration abilities in STEM classes is the result of this study. The instrument is expected to be an accurate instrument in measuring students' collaboration skills and can be used easily. The product development process adopts the development model [48] and [49]. Development is carried out systematically (according to the development model) so that it can be implemented effectively and produces instruments that meet the criteria of validity, reliability, and have fairness in measuring students' abilities [57, 58] so that they can collect assessment data with the smallest possible error [49]
Validity is oriented towards meaningfulness [59] and usability [60]. The instrument is said to be valid if the instrument is accurate in accordance with the measurement objectives [43, 61]. The collaborative ability assessment instrument developed has proven its validity, both content and construct. Content validity is the most priority validity to be proven in instrument development [59] because a test sometimes looks valid but does not measure according to the purpose [57]. Thus, the verification of validity in the development of this instrument is carried out in stages and carefully in stages, namely FGD and filling out validation forms by experts. FGD is two-way communication between experts and researchers to review the developed instrument then the expert fills out the validation form. The results of filling in the validation form resulted in an average Aiken index of 0.95 which showed evidence of the validity of the contents of the instrument [62].
Constructively, the validity of the instrument was proven through confirmatory factor analysis [44, 45] which means that the trial data confirms the theory correctly [44, 57, 58]. Evidence of this validity is the statistical fit of the model, namely p-value > 0.05 and RMSEA < 0.08 [63], t-value > 1.96 with an error tolerance of 5% [64], and the loading factor in the standardized solution is at least 0.3 [62]. To meet these criteria, items K9, K15, and K16 were removed from the questionnaire.
The second condition that must be met by an instrument is reliability. Reliability refers to the measurement consistency attribute [65] in test replication [66]. The construct reliability index was 0.836529, exceeding the minimum standard of 0.7 [67, 68]. Thus, the instrument has sufficient stability when used as a measuring instrument [57, 69].
The analytical model chosen is the graded response model (GRM). The selection is based on the suitability of the instrument's character and GRM [54]. GRM is very suitable for polytomous instruments with characters having graded answer choices and the aim is to measure a person's attitude [47]. Then the results of the fit of the analysis model support the previous statement that the data is suitable for analysis with the GRM model [56].
The instrument has 4 answer choices so that it produces 3 step parameters symbolized by bi [54]. The value of bi is the intersection between the mn dan mn+1 category curves [70]. bi refers to a certain minimum ability to enter the higher category points [53]. The data in Table 2 shows that the values of b1, b2, and b3 for each item have a good order, namely b1 < b2 < b3 [47]. Thus, the difficulty level of each item has good quality and can represent the ability of the test takers well. Then, GRM is an analysis of the response of polytomous data items that take into account the parameter a (discriminant index). An item is said to be good if the value of a has a value between 0 to 2 [46]. Thus, all items of the collaboration ability assessment instrument have a discriminant index or ability to distinguish good student abilities, namely 0.995 ≤ ai ≤ 1.764.
Theta denoted by θ is a psychometric term in item response theory that indicates the student's ability to be measured, in this case, is collaboration ability. Based on the value of the information function and standard error shown in the curves in Figure 5, it is found that the intersection point of the two curves is around tetha -6.15 and 4.05. The intersection shows the theta the value of the information function and SE are at the same value. In the interval between -6.15 and 4.05 the value of the information function is greater than the SE so that the measurement accuracy is considered good [53], and the smaller the SE, the greater the reliability of the test [55]. Based on this information, the student collaboration ability assessment instrument is accurate to measure students' ability (θ) between these intervals.
The results of the development show that the instrument for assessing students' collaboration abilities in STEM classes is proven to be valid in terms of content and constructs. The instrument contains 5 aspects, namely the ability to communicate with the team, understand the work portion, adapt to friends, help and remind each other, and contribute thoughts. From the initial 20 items that made up the instrument, 3 of them were excluded from the constructed model, namely K9, K15, and K16 because statistically, they did not show that they were able to represent collaboration abilities. The reliability index shows the number 0.836529 so that it meets the minimum reliability requirements. Based on the results of factor analysis, it shows that the trial data fit when measuring one latent, namely collaboration ability, so that item analysis is carried out using a unidimensional graded response model (GRM). The results of the item response analysis show that the instrument has a good ability to detect student collaboration skills because: (1) all items have sequential step parameters (b1 < b2 < b3), (2) all items have a good discriminant index (0.995 ≤ ai ≤ 1.764), (3) a reliable instrument to measure students with a wide range of abilities (θ), namely -6.15 < θ < 4.05.
[1] Honey, M.A., Pearson, G., Schweingruber, H. (2014). STEM integration in K-12 education: Status, prospects, and an agenda for research. Washington, DC: Academies Press.
[2] Furner, J.M., Kumar, D.D. (2007). The mathematics and science integration argument: A stand for teacher education. Eurasia Journal of Mathematics, Science and Technology Education, 3(3): 185-189. https://doi.org/10.12973/ejmste/75397
[3] Beane, J.A. (1995). Curriculum integration and the disciplines of knowledge. Phi Delta Kappan, 76(8): 616-622. https://doi.org/10.4324/9780203817568.ch20
[4] Bicer, A., Capraro, R.M., Capraro, M.M. (2017). Integrated STEM assessment model. Eurasia Journal of Mathematics, Science and Technology Education, 13(7): 3959-3968. https://doi.org/10.12973/eurasia.2017.00766a
[5] Sumarni, W., Faizah, Z., Subali, B., Wiyanto, W., Ellianawati, E. (2020). The urgency of religious and cultural science in stem education: A meta data analysis. International Journal of Evaluation and Research in Education, 9(4): 1045-1054. https://doi.org/10.11591/ijere.v9i4.20462
[6] Wisudawati, A.W. (2018). Science technology engineering and mathematics (STEM) education aproach against a misroscopic representation skill in atom and molecule concept. International Journal of Chemistry Education Research, 2(1): 1-5.
[7] Putra, D.P.A. (2017). Educational game for STEM education in indonesia local wisdom. Japan Society for Science Education, 31(8): 97-100.
[8] Çevik, M. (2018). Proje Tabanli (PjT) Fen, Teknoloji, Mühendislik ve Matematik (STEM) egitiminin, meslek lisesi ögrencilerinin akademik basarilarina ve mesleki ilgilerine etkisi. Pegem Egitim ve Ogretim Dergisi, 8(2): 281-306. https://doi.org/10.14527/pegegog.2018.012
[9] Wan Husin, W., Mohamad Arsad, N., Othman, O., Halim, L., Rasul, M., Osman, K., Iksan, Z. (2016). Fostering students’ 21st century skills through project oriented problem based learning (POPBL) in integrated STEM education program. Asia-Pacific Forum on Science Learning and Teaching, 17(1): 1-19.
[10] Harwell, M., Moreno, M., Phillips, A., Guzey, S.S., Moore, T.J., Roehrig, G.H. (2015). A study of STEM assessments in engineering, science, and mathematics for elementary and middle school students. School Science and Mathematics, 115(2): 66-74. https://doi.org/10.1111/ssm.12105
[11] Arlinwibowo, J., Retnawati, H., Kartowagiran, B. (2020). The types of STEM education implementation in Indonesia. Journal of Xi’an University of Architecture & Technology, XII(VIII), 606-613.
[12] Gale, J., Alemdar, M., Lingle, J., Newton, S. (2020). Exploring critical components of an integrated STEM curriculum: An application of the innovation implementation framework. International Journal of STEM Education, 7(1): 1-17. https://doi.org/10.1186/s40594-020-0204-1.
[13] Walker, W.S., Moore, T.J., Guzey, S.S. (2018). Frameworks to develop integrated STEM curricula. K-12 STEM Education, 4(2): 331-339.
[14] Bybee, R.W. (2010). Advancing STEM education: A 2020 vision. Technology & Engineering Teacher, 70(1): 30-35.
[15] Arlinwibowo, J., Retnawati, H., Kartowagiran, B. (2021). How to integrate STEM education in the indonesian curriculum ? A Systematic Review. Materials of International Practical Internet Conference “Challenges of Science,” (Iv), 18-25. https://doi.org/https://doi.org/10.31643/2021.03
[16] Herro, D., Quigley, C., Andrews, J., Delacruz, G. (2017). Co-Measure: Developing an assessment for student collaboration in STEAM activities. International Journal of STEM Education, 4(1). https://doi.org/10.1186/s40594-017-0094-z
[17] Smith, M.K., Wood, W.B., Adams, W.K., Wieman, C., Knight, J.K., Guild, N., Su, T.T. (2009). Why peer discussion improves student performance on in-class concept questions. Science, 323(5910): 122-124. https://doi.org/10.1126/science.1165919
[18] Herro, D., Quigley, C. (2017). Exploring teachers’ perceptions of STEAM teaching through professional development: implications for teacher educators. Professional Development in Education, 43(3): 416-438. https://doi.org/10.1080/19415257.2016.1205507
[19] Arlinwibowo, J., Retnawati, H., Kartowagiran, B. (2020). Model penilaian capaian belajar matematika dengan framework STEM [Assessment model of learning achievement in mathematics with the STEM framework ]. Yogyakarta: UNY Press.
[20] Ariyana, Y., Pudjiastuti, A., Bestary, R., Zamroni. (2018). Buku pegangan pembelajaran berorientasi pada keterampilan berpikir tingkat tinggi [Learning handbook oriented to higher order thinking skills]. Jakarta: Kementerian Pendidikan dan Kebudayaan, Republik Indonesia.
[21] Ball, A., Joyce, H.D., Anderson-Butcher, D. (2016). Exploring 21st century skills and learning environments for middle school youth. International Journal of School Social Work, 1(1). https://doi.org/10.4148/2161-4148.1012
[22] Binkley, M., Erstad, O., Herman, J., Raizen, S., Ripley, M., Miller-Ricci, M., Rumble, M. (2012). Defining twenty-first century skills. In P. Griffin & E. Care (Eds.), Assessment and teaching of 21st century skills: Methods and approach (pp. 17-66). Dordrecht, the Netherlands: Springer.
[23] Wang, Q. (2010). Using online shared workspaces to support group collaborative learning. Computers and Education, 55(3): 1270-1276. https://doi.org/10.1016/j.compedu.2010.05.023
[24] Dede, C. (2010). Comparing frameworks for 21st century skills. In J. Bellanca & R. Brandt (Eds.), 21st century skills (pp. 51-76). Bloomington, IN: Solution Tree Press.
[25] Fraser, K., Hvolby, H.H. (2010). Effective teamworking: Can functional flexibility act as an enhancing factor? an Australian case study. Team Performance Management, 16(1-2): 74-94. https://doi.org/10.1108/13527591011028933
[26] van Laar, E., van Deursen, A.J.A.M., van Dijk, J.A.G.M., de Haan, J. (2020). Determinants of 21st-century skills and 21st-century digital skills for workers: A systematic literature review. SAGE Open, 10(1). https://doi.org/10.1177/2158244019900176
[27] Davis, J., Daniels, K. (2015). Effective DevOps: Building a culture of collaboration, affinity, and tooling at scale. Sebastopol, CA: O’Reilly Media Inc.
[28] Koenig, J.A. (2011). Assessing 21st Century Skills. Washington, DC: The National Academies Press.
[29] Trilling, B., Fadel, C. (2009). 21st Century Skills: Learning for Life in Our Time. San Francisco: Jossey Bass.
[30] Morze, N., Makhachashvili, R., Trybulska, E.S. (2016). The roadmap of collaboration skills from programmed teaching to E-learning. International Journal of Research in E-Learning, 2(1): 41-56.
[31] Laal, M., Laal, M., Kermanshahi, Z.K. (2012). 21st century learning; learning in collaboration. Procedia - Social and Behavioral Sciences, 47: 1696-1701. https://doi.org/10.1016/j.sbspro.2012.06.885.
[32] Gapinski, A.J. (2018). Assessment of effectiveness of teamwork skills learning in collaborative learning. The Journal of Management and Engineering Integration, 11(2): 1-15.
[33] Townsend, A.M., DeMarie, S.M., Hendrickson, A.R. (1998). Virtual teams: Technology and the workplace of the future. Academy of Management Executive, 12(3): 17-29. https://doi.org/10.5465/ame.1998.1109047
[34] Scannell, M. (2010). Big Book Ofconflict Resolution Games. NY: McGraw-Hill, Inc.
[35] Bushe, G.R. (2006). Sense making and the problems of learning from experience. In S. Schuman (Ed.), Creating a culture of collaboration: The international association of facilitators handbook (pp. 151-172). San Francisco: Jossey Bass.
[36] Retnawati, H., Hadi, S., Nugraha, A.C., Arlinwibowo, J., Sulistyaningsih, E., Djidu, H., … Iryanti, H.D. (2017). Implementing the computer-based national examination in Indonesian School: The challenges and strategies. Problems of Education in The 21st Century, 75(6): 612-633. https://doi.org/10.33225/pec/17.75.612
[37] Retnawati, H., Munadi, S., Arlinwibowo, J., Wulandari, N.F., Sulistyaningsih, E. (2017). Teachers’ difficulties in implementing thematic teaching and learning in elementary schools. The New Educational Review, 48(2): 201-212. https://doi.org/10.15804/tner.2017.48.2.16
[38] Zurqoni, Retnawati, H., Arlinwibowo, J., Apino, E. (2018). Strategy and implementation of character education in senior high schools and vocational high schools. Journal of Social Studies Education Research, 9(3): 370-397. https://doi.org/10.17499/jsser.01008
[39] Noviana, A., Abdurrahman, Rosidin, U., Herlina, K. (2019). Development and validation of collaboration and communication skills assessment instruments based on project-based learning. Journal of Gifted Education and Creativity, 6(2): 133-146.
[40] Orchard, C.A., King, G.A., Khalili, H., Bezzina, M.B. (2012). Assessment of interprofessional team collaboration scale (AITCS): Development and testing of the instrument. Journal of Continuing Education in the Health Professions, 32(1): 58-67. https://doi.org/10.1002/chp.21123
[41] Kennedy-Clark, S., Kearney, S., Galstaun, V. (2017). Using a collaborative assessment design to support student learning. Education Sciences, 7(80): 1-14. https://doi.org/10.3390/educsci7040080
[42] Miller, M.D., Linn, R.L., Grondlund, N.E. (2009). Measurement and Assessment in Teaching (10th ed.). Upper Sadle River, NJ: Pearson Education, Inc.
[43] Allen, M.J., Yen, W.M. (1979). Introduction to Measurement Theory. Belmont, CA: Wadsworth.
[44] Lester, P.E., Inman, D., Bishop, L.K. (2014). Handbook of Test and Measurement in Education and the Social Sciences. London: Rowman & Littlefield.
[45] Price, L.R. (2017). Psychometric Methods: Theory Into Practice. New York, NY: The Guilford Press.
[46] Hambleton, R.K., Swaminathan, H. (1985). Item Response Theory: Principles and Applications. NY: Springer Science and Business Media, LLC.
[47] Samejima, F. (1997). Graded Response Model. In W. J. van der Linden & R. K. Hambleton (Eds.), Handbook of Item Response Theory (pp. 85-100). https://doi.org/10.1201/b19166.
[48] Plomp, T. (2007). Educational design research: An introduction. In T. Plomp & N. Nieveen (Eds.), An Introduction to Educational Design Research (pp. 9-36). Shanghai: the East China Normal University.
[49] Lane, S., Raymond, M.R., Haladyna, T.M., Downing, S.M. (2016). Test development process. In S. Lane, M. R. Raymond, & T. M. Haladyna (Eds.), Handbook of test development (pp. 3-18). New York, NY: Routledge.
[50] Aiken, L.R. (1985). Three coefficients for analyzing the reliability, and validity of ratings. Educational and Psychological Measurement, 45: 131-142. https://doi.org/10.1177/0013164485451012
[51] Matore, E.M., Effendi, M., Khairani, A.Z., Adnan, R. (2019). Exploratory factor analysis (EFA) for adversity quotient (AQ) instrument among youth. Journal of Critical Reviews, 6(6): 234-242. https://doi.org/10.22159/jcr.06.06.33
[52] Reddy, L.S., Kulshrestha, P. (2019). Performing the KMO and bartlett’s test for factors estimating the warehouse efficiency, inventory and customer contentment for e-retail supply chain. International Journal for Research in Engineering Application & Management, 5(9): 1-13. https://doi.org/10.35291/2454-9150.2019.0531
[53] Retnawati, H. (2014). Teori respons butir dan penerapannya [Item response theory and its application]. Yogyakarta: Nuha Medika.
[54] Ostini, R., Nering, M.L. (2006). Polytomous Item Response Theory Models. CA: Sage Publications.
[55] DeMars, C. (2010). Item response theory. .Madison Avenue, New York: Oxford University Press, Inc.
[56] Chalmers, R.P., Ng, V. (2017). Plausible-Value imputation statistics for detecting item misfit. Applied Psychological Measurement, 41(5): 372-387. https://doi.org/10.1177/0146621617692079.
[57] Kubiszyn, T., Borich, G. (2003). Educational Testing and Measurement. New Jersey: John Wiley & Sons, Inc.
[58] Finch, W.H., French, B.F. (2019). Educational and Psychological Measurement. NY: Routledge.
[59] Gable, R.K. (1986). Instrumen Development in the Affective Domain. NY: Springer Science and Business Media, LLC.
[60] Nitko, A.J., Brookhart, S.M. (2011). Educational Assessment of Student. Boston, MA: Pearson Education, Inc.
[61] Reynolds, C.R., Livingston, R.B., Willson, V. (2010). Measurement and Assessment in Education. Upper Sadle River, NJ: Pearson Education, Inc.
[62] Retnawati, H. (2016). Analisis kuantitatif instrumen penelitian [Quantitative analysis of research instruments]. Yogyakarta: Parama Publishing.
[63] Thompson, B. (2004). Exploratory and confirmatory factor analysis: Understanding concepts ad application. https://doi.org/10.2478/s11600-010-0006-9
[64] Harrington, D. (2009). Confirmatory Factor Analysis. Oxford: Oxford University Press, Inc.
[65] Gregory, R.J. (2015). Psychological Testing: History, Principles, and Application (7th ed.). Harlow: Pearson Education, Inc.
[66] AERA. (2014). Standards for educational and psychological testing. Washington, DC: American Education Research Association.
[67] Nunnally, J.C., Bernstein, I.H. (1994). Psychometric theory (3rd ed.). NY: McGraw-Hill, Inc.
[68] Kurpius, S.E.R., Stafford, M.E. (2006). Testing and measurement: A user-friendly guide. Retrieved from http://library1.nida.ac.th/termpaper6/sd/2554/19755.pdf.
[69] Neukrug, E.S., Fawcett, R.C. (2015). Essentials of Testing and Assessment, Second Edition (3rd ed.). Stamford: Cengage Learning.
[70] Embretson, S.E., Reise, S.P. (2000). Item Response Theory for Psychologists. New Jersey: Lawrence Erlbaum Associates.