Riyadh Bouddou* | Farid Benhamida | Mekki Haba | Moussa Belgacem | Mohammed Amine Meziane
© 2020 IIETA. This article is published by IIETA and is licensed under the CC BY 4.0 license (http://creativecommons.org/licenses/by/4.0/).
OPEN ACCESS
In this paper, a bid-based dynamic economic dispatch (BBDED) problem is solved in the electricity market system under bidding strategies, including wind energy penetration using simulated annealing (SA) algorithm. The multi-objective dispatch model allows generating companies (GENCOs) and their customers to submit supply and demand bids to a market controller known as the independent system operator (ISO) and follow a bidding strategy. ISO is responsible for the market clearing and settlement to maximize the social profit and benefit for GENCOs and customers during trading periods. To study the effect and advantages of wind energy integration in the BBDED problem, the wind energy generation is computed using the forecasted wind speeds and included in the dispatch model. In this regard, the ISO's dispatch model is formulated as a bilevel nonlinear optimization problem. The higher-level is solving the market-clearing with and without wind energy, and the lower level is maximizing GENCO's social profit. The proposed SA algorithm is evaluated for optimality, convergence, robustness, and computational efficiency tested on an IEEE 30-bus test system. The simulation results are compared with those found using different algorithm-based approaches, considering various constraints like power balancing, generator limits, ramp rate limits, and transmission losses.
electricity market, dynamic economic dispatch, bidding strategies, wind energy, simulated annealing algorithm
Today, large power systems were affected by the integration of renewable power supply sources. As industries and communities grow, consumer demand for power supply is increasing every day. In this regard, both conventional energy resources, and renewable energy resources like wind energy, represent the primary options available to the government for providing electricity to consumers [1]. The wind energy level penetrating the electricity market is quickly growing worldwide, which is environmentally and economically sustainable. In 2018, the wind industry's capacity grew to 591 GW, increased by 9.6% from 2017 [2]. The deregulation of electricity systems leads to significant changes in the way electricity is traded. Consumers are autonomous in electricity market systems to select their electricity suppliers depending on different needs, unlike the monopolized systems. Deregulated electricity systems are based on competitive electricity markets comprising transactions between suppliers and consumers and ensuring policy rules and coordination to achieve competition and open access to market participants, unlike the monopolized systems. The goal of deregulation is to considerably reduce electricity prices by optimizing the electricity generation cost supplied to the consumer, which maximizes the social profit for the generating companies (GENCOs) while respecting the system's constraints, with no effect on its efficiency and protection. Wind energy is a renewable source that can achieve a high penetration level in modern deregulate electricity systems. Wind energy will cause additional uncertainties in the transaction due to the variability in wind speeds affecting the power system operation. To ensure robust wind energy trading in the electricity market, forecasted wind speeds, load forecasting, and power generation models to optimize market strategies and identify uncertainties are essential to ensure system reliability and economic benefits for GENCOs and customers [3, 4]. Dynamic economic dispatch (DED) is a significant optimization problem that studies the impact of wind energy integration. It is a highly constrained problem that obtains the optimized economic planning of the power generation units to satisfy the scheduled load in a specific period, taking into account various constraints, like power balance, unit capacity limits, and ramp rate limits. The DED problem is becoming complex and challenging to solve with the extensive incorporation of wind generators because of wind speed's uncertain nature [5, 6]. A DED that incorporates wind and photovoltaic power that deals with the stochastic and unpredictable nature of wind and solar energy generation while considering the differences between actual and predicted output power to achieve an optimized cost and optimal power dispatch is solved using a hybrid heuristic flower pollination algorithm with sequential quadratic programming [7]. A dynamic environmental economic dispatch (DEED) with wind energy penetration is solved using an enhanced multi-objective differential evolution algorithm (EMODE), which uses the superiority of feasible solution (FS) and non-dominated sorting (NDS) two selection strategies for improving the optimization effect [8]. Modeling of wind environment dynamic economic dispatch in power system is solved via an OLHBMO meta-heuristic method which is a combination between online learning and honey bee mating optimization (HBMO) algorithms, two neural networks are trained when reached to the predefined threshold by the current and previous position of solutions to optimize the fitness values [9]. The evolution of the deregulated electricity market and the rapid development of variable renewable energy resources have developed various electricity market models. These market models have become the tools used by economists, engineers, and electricity market planners to operate and plan market models for efficient electricity trading. In modelling the electricity market, fuel source, availability, operating cost, and generator constraints are not the only factors to be considered but also market operators, power bidding, market prices, and, most importantly, market-clearing, which is performed by the ISO [10]. For competitive electricity markets, bi-level optimization operation is used for capturing the interactions between the market operator and participants. Here, the objective of ISO is to ensure a balance between supply and demand. The bi-level optimization problem for ISO in its upper level is market-clearing, and the lower level is maximizing the social profit for participants [11].
In this regard, the ISO may perform a bid-based dynamic economic dispatch model based on the participants' bidding strategies to clear the day-ahead electricity market, allowing GENCOs to submit in advance supply bids with the lowest generation cost seeking for a maximum profit, and satisfying customers demand bids. Several researchers have proposed a variety of methods and algorithms such as isolation niche immune genetic algorithm (INIGA) [12], evolutionary algorithm (EA) [13], symbiotic organisms search (SOS) [14], multi-echelon (ME) [15], quadratic programming (QP) [16], genetic algorithm (GA) [17], competitive swarm optimizer (CSO) [18], and the predictor-corrector interior-point quadratic programming (PCIPQP) algorithm [19] to solve different BBDED problems. This paper aims to solve the BBDED problem using the simulated annealing algorithm (SA), which mimics the annealing process in metallurgy for approximating the global minima and maxima. Therefore, the proposed SA is feasible to solve the BBDED problem only if it yields optimal solutions using a probability technique that accepts and enhances candidate solutions and guides infeasible solutions to the feasible space. To study the wind energy penetration effect in the BBDED problem and analyse it on generation cost and social profit, the wind energy utilized in this study is determined according to the forecasted wind speeds.
The formulation of the BBDED mathematical model is presented as a bilevel problem of optimization. The higher level is the market-clearing, and the lowest level is the maximization of social profit, considering the minimization of the generation cost of generators. The objective function, including conventional power generators and wind energy generators, can be represented by the formula below.
$\text{MaxPF}\sum\limits_{t=1}^{T}{\left[ \sum\limits_{j=1}^{Nd}{B{{c}_{j}}({{d}_{j,t}})-\sum\limits_{i=1}^{Ng}{C{{g}_{i}}({{p}_{i,t}})+\sum\limits_{k=1}^{Nw}{C{{w}_{k}}({{p}_{k,t}})}}} \right]}$ (1)
$B{{c}_{j}}\left( {{d}_{j,t}} \right)={{a}_{dj}}{{d}_{j,t}}^{2}+{{b}_{dj}}{{d}_{j,t}}+{{c}_{dj}}$ (2)
$C{{g}_{i}}\left( {{p}_{i,t}} \right)={{a}_{gi}}{{p}_{i,t}}^{2}+{{b}_{gi}}{{p}_{i,t}}+{{c}_{gi}}$ (3)
$C{{w}_{k}}\left( {{p}_{k,t}} \right)={{d}_{k}}{{p}_{k,t}}$ (4)
where, Bcj(dj,t) and Cgi(pi,t) are the demand and supply bid functions of customers j and generator i, respectively; Cwk(pk,t) is the bid function of the wind generator k. dj,t is the demand bid amount of power for customer j at period t; pi,t is the supply bid amount of power for thermal generator i at period t; pw,t is the bid amount of wind generator w at period t. Nd is the customer's number; Ng is the number of thermal generators; Nw is the wind generator number. adj, bdj, and cdj are the bid demand function coefficients. agi, bgi, and cgi are the bid supply function coefficients; dk is the bid function coefficient of wind generator; t is the periods' number.
2.1 Bidding strategies in the electricity market
Bidding strategies can be implemented by setting the power capacity and price to be submitted as bids for each generator. The bidding strategies are either static or dynamic and generally depend on generation supply and the customer's demand. Each GENCO submits a supply bid in the electricity market, and each customer submits a demand bid to ISO. Usually, these bids are linked to an offered price and matched by the ISO. There are two components of the objective function. The first one is the customer benefit function. To achieve maximum benefit, the customer must implement a bidding strategy using the price bid coefficients (adj) and (bdj). The customers bidding strategy is implemented as High (H), Medium (M), and Low (L) bidding strategy according to the bid price coefficient. The authors have demonstrated through experiments and based on the literature, for high bidding strategy, (adj) ≥ 0.09, for medium bidding strategy, (adj) can be within the range of 0.05, and for low bidding strategy (adj) ≤ 0.01. For the bid coefficient (bdj), it is formed using the equation 0 < (bdj) < λm, where λm is the market-clearing energy price, which can be determined by intersecting the GENCOs and customers bid curves [20]. The second one is the cost function of generators, which represents the supply side. Each GENCO should develop a bidding strategy according to the marginal cost to maximize the profit [21].
2.2 Problem constraints
These constraints are particularly equality, inequality, and ramp-rate limits.
2.2.1 Equality constraints
It is known as the balance of active power flow between supply and demand in the power system, and it is given below.
$\sum\limits_{i=1}^{Ng}{{{p}_{i,t}}=}\sum\limits_{j=1}^{Nd}{{{d}_{j,t}}}+{{p}_{L}}$ (5)
The calculation of the exact real power loss is complex. When developing optimization models that include power loss, approximating formulas are often sufficient. One such approximation technique is the B-matrix power loss formula shown in (6). The use of the B-matrix approximation avoids the need to calculate the loss for each transmission line, as long as the structure of the power system remains relatively uniform. This approximation is effective for large variations in the system load.
${{P}_{L}}({{p}_{i,t}})=\sum\limits_{i=1}^{Ng}{\sum\limits_{j=1}^{Ng}{{{p}_{i,t}}{{B}_{i,j}}}}{{p}_{j,t}}+\sum\limits_{I=1}^{Ng}{{{B}_{i,0}}{{p}_{i,t}}}+{{B}_{0,0}}$ (6)
where, Bi,j is the matrix loss coefficient; Bi,0 represents the vector loss coefficient; B0,0 represents the constant of loss;
Loss coefficients formula derivation is based on the following four basic elements [22]: (1) The power factor for the generator busses remains constant. (2) The voltage angle at each voltage-controlled (PV) bus is constant. (3) The voltage amplitude at each PV bus is fixed. (4) The load current to total load current ratio remains constant. The coefficients lose significant precision when the calculations used to derive the loss formula are not correct. are violated. The coefficients of the polynomial loss equation are determined by the power flow solutions.
2.2.2 Inequality constraints
The conventional or wind generator is designed to produce electricity between a maximal and minimal secured range to prevent over-or under-generation during load satisfaction.
${{p}_{i,,t\min }}\le {{p}_{i,t}}\le {{p}_{i,t\max }}$ (7)
${{p}_{k,t\min }}\le {{p}_{k,t}}\le {{p}_{k,t\max }}$ (8)
The demand side is also limited between a maximal and a minimal power bid to balance with the supply side.
${{d}_{j,t\min }}\le {{d}_{j,t}}\le {{d}_{j,t\max }}$ (9)
2.2.3 Ramp-rate limit constraints
The output of a generator is limited by the ramp-rate limit. It represents the generated power variation, whether it increases (ramp-up) or decreases (ramp-down). It is therefore expressed in the unit of power output by the minute.
$R_{i}^{down}\le {{p}_{i,t}}-{{p}_{i,(t-1)}}\le R_{i}^{up}$ (10)
where, Ridown is the generator's maximal power decreasing capacity over a period; Riup is the generator's maximal power increasing capacity over a period;
2.3 Wind energy
Wind energy is one of the world's renewable energy source that has been largely used in the last decade. It has many benefits, like low investment cost as well as the absence of pollution. However, wind energy varies according to location and wind speed availability, leading to great uncertainty concerning the power produced. Wind speed has been calculated for the desired height according to the equation of power law [23].
$\frac{W{{s}_{h}}}{W{{s}_{10}}}={{\left( \frac{h}{10} \right)}^{N}}$ (11)
Wind energy generation varies mainly according to wind speeds, the air density, the area swept, and the generators' efficiency. The wind energy equation can be stated as follows:where, Wsh is the wind speed at a specific height h; Ws10 is the standard wind speed at the height of 10m; N is the hellman coefficient (0.143).
$WP=\frac{1}{2}.AD.a.e.Ws_{h}^{3}$ (12)
where, AD is the density of air in kg/m3 (1.225); a is the wind generator swept area in m2; e is the efficiency constant of the wind generator (0.49); Wsh3 is the wind speeds in m/s.
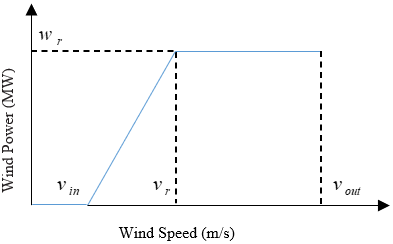
Wind speed is a value that is variable in this equation by ignoring minor non-linearities. The function between a given wind speed and power output can be represented in the curve shown in Figure 1.
Figure 1. Simple power curve for wind generator
The figure above shows that no power is produced at wind speeds lower than (Vin) or higher than (Vout) the power produced at wind speeds between (Vr) and (Vout) is equivalent at the wind turbine's rated output, for wind speed from (Vin) to (Vr), the power produced is a linear function.
Simulated annealing is a high-performance technique proposed in the optimization field in 1983 by Kirkpatrick Scott [24]. SA technique is based on the similarities between a minimization process in solving an optimization problem and the cooling of the molten metal. It is based on the annealing concept in metallurgy for improving the solid quality by searching for a minimum energy state. In the SA technique, physical annealing is simulated to find the global or near-global optimal solution for an optimization problem. A parameter T0, known as temperature, is set in this algorithm. At higher temperatures, liquid melted metal is slowly cooling down to a low temperature until it solidifies. The temperature level in the SA technique is similar to the number of iterations when solving an optimization problem. For each iteration, a solution candidate is then generated. The solution will be accepted and then utilized to generate a new candidate solution if it is a better one. In the case of a deteriorated solution, it will be accepted when its acceptance probability Pr (Δ) is higher than a random number generated between (0,1). The acceptance probability is expressed as follows:
${{P}_{r}}\left( \Delta \right)={1}/{\left( 1+\exp \left( \Delta /{{T}_{v}} \right) \right)}\;$ (13)
where, Δ is the level of deterioration from the solution that is new to the current solution, and T0 is the temperature level for generating this solution. Accepting a deteriorated solution in the process described above allows the simulated annealing for "jumping" out of the optimal local solution searching for the optimal global solution. In generating a new solution, the perturbation will be caused to the current one. The level of perturbation depends on the temperature at every iteration. The process of generating and testing the candidate solutions is performed for a given trial number to achieve the thermal equilibrium for every temperature. The SA technique, with a slowly cooling level, generally has a greater ability to search for the optimum solutions than a quickly cooling level. The following linear function controls the temperature decreasing iteratively [25].
${{T}_{v}}=\alpha _{{}}^{{}}{{T}_{0}}$ (14)
where, v is the number of iterations and ⍺ the temperature cooling factor, T0 represents the initial temperature, randomly chosen. The iteration process is over if there is no significantly improved solution after a predefined iterations number. It also can be finished when the maximal iteration number is attained. The proposed SA approach is presented in a flowchart shown in Figure 2.
Figure 2. The flowchart of the SA algorithm
The SA algorithm is implemented in MATLAB and used for solving the BBDED problem applied on an IEEE 30-bus test system, including 6 thermal units, 1 wind turbine, and 2 customers connected to 41 transmission lines. Each unit represents a generating company.
The generators' cost coefficients and minimum and maximum supplied power of GENCOs represent the supply-side bidding strategy. The customers' bids are submitted with a low strategy, medium strategy, and high strategy to represent the demand-side for two trading periods. The parameters of the proposed SA algorithm are presented in Table 1.
Table 1. Parameters of the simulated annealing algorithm
|
Parameters |
Constant values |
|
T0 |
300 °C |
|
α |
0.9 |
|
Maximal trials |
10.e3 |
|
TF |
0.10 °C |
Two cases are studied in this paper without and with wind power integration where GENCOs and customers bid price and quantity limits are presented in Table 2 and Table 3, respectively, and taken from [21].
Table 2. Bid data of generators
|
Gen |
cgi ($) |
bgi ($/MWh) |
agi ($/MWh2) |
Pmin (MW) |
Pmax (MW) |
Ridown (MW/h) |
Riup (MW/h) |
|
G1 |
0 |
2.0 |
0.00375 |
50 |
200 |
65 |
85 |
|
G2 |
0 |
1.75 |
0.01750 |
20 |
80 |
12 |
22 |
|
G3 |
0 |
1.0 |
0.00625 |
15 |
50 |
12 |
15 |
|
G4 |
0 |
3.25 |
0.00834 |
10 |
35 |
08 |
16 |
|
G5 |
0 |
3.0 |
0.0250 |
10 |
30 |
06 |
09 |
|
G6 |
0 |
3.0 |
0.0250 |
12 |
40 |
08 |
16 |
Table 3. Bid data of customers
|
|
Customer 1 Low/Medium/High |
Customer 2 Low/Medium/High |
|
adj ($/MWh2) |
-0.06/ 0.07/0.1 |
-0.08/0.05/0.09 |
|
bdj ($/MWh) |
20 |
15 |
|
cgi ($) |
0 |
0 |
|
Period 1 (Dmin to Dmax) (MW) |
100 to 150 |
50 to 100 |
|
Period 2 (Dmin to Dmax) (MW) |
20 to 70 |
100 to 200 |
Transmission losses are considered in both cases and represented using B-coefficients as follows [26]:
${{B}_{ij}}={{1}_{{}}}{{e}^{-3}}\left[ \begin{align} & \begin{matrix} \begin{matrix} \begin{matrix} \begin{matrix} \begin{matrix} 0.200 & 0.010 \\\end{matrix} & 0.015 \\ \end{matrix} & 0.005 \\ \end{matrix} & 0.00 \\ \end{matrix} & -0.030 \\ \end{matrix} \\ & \begin{matrix} \begin{matrix} \begin{matrix} \begin{matrix} 0.010 & 0.30 \\ \end{matrix} & -0.020 & 0.001 \\ \end{matrix} & 0.012 \\ \end{matrix} & 0.010 \\ \end{matrix} \\ & \begin{matrix} 0.015 & -0.02 & 0.100 & \begin{matrix} \begin{matrix} -0.01 & 0.010 \\ \end{matrix} & 0.008 \\ \end{matrix} \\ \end{matrix} \\ & \begin{matrix} 0.005 & 0.001 & \begin{matrix} -0.01 & 0.150 & 0.006 & 0.050 \\ \end{matrix} \\ \end{matrix} \\ & \begin{matrix} 0.000 & 0.012 & 0.010 & \begin{matrix} \begin{matrix} 0.006 & 0.250 \\ \end{matrix} & 0.020 \\ \end{matrix} \\ \end{matrix} \\ & \begin{matrix} \begin{matrix} \begin{matrix} \begin{matrix} -0.03 & 0.010 \\ \end{matrix} & 0.008 \\ \end{matrix} & 0.050 \\ \end{matrix} & 0.020 & 0.210 \\ \end{matrix} \\ \end{align} \right]$
4.1 Case 1: BBDED without wind energy integration
In this case, the BBDED problem is solved in the absence of wind energy under bidding strategies in two trading periods. GENCO's and customers' bid data and the transmission loss B-coefficients are taken in the simulated annealing algorithm as inputs.
The algorithm finds the optimized values of both supply and demand bidding quantities and calculating the generation costs, customers' benefits, and social profits. In low, medium, and high bidding strategies, the coefficients (adj) are assumed to be -0.06, 0.07, and 0.1 respectively for customer 1 and -0.08, 0.05, and 0.09, respectively for customer 2. The bidding coefficients (bdj) are taken 20 for customer 1 and 15 for customer 2 in all bidding strategies. In period 1, the customer 1 load demand is between a minimal of 100 MW and a maximal of 150 MW. The customer 2 load demand is between a minimal of 50 MW and a maximal of 100 MW. In period 2, the customer 1 demand is between a minimal of 20 MW and a maximal of 70 MW and the customer 2 demand is between a minimal of 100 MW and a maximal of 200 MW. The problem is treated as multi-objective, the minimization of generation cost, and the maximization of the social profit simultaneously. Table 4 and Figure 3 present the optimal dispatch results for both periods after the market-clearing under the three bidding strategies.
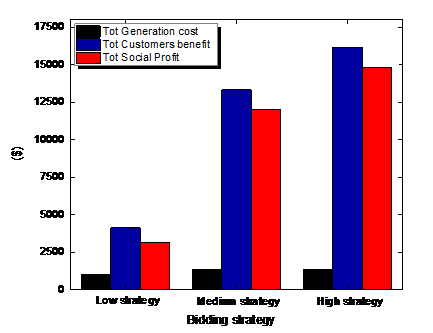
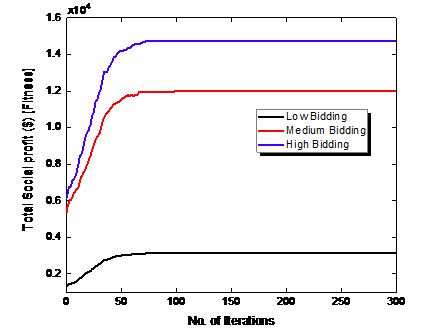
From Table 4, it can be seen for low bidding strategy that when the customers' demand decreased in period 2 with 176.83 MW compared to period 1 with 213.46 MW, the generation cost decreased from 520.65 \$ to 486.1 \$ by 34.55 \$ which affected the customers benefit that reduced from 2285.64 \$ to 1795.43 \$ by 490.21 \$. As a consequence, the social profit is decreased from 1764.98 \$ to 1309.21 \$ by 455.77 \$. In medium bidding strategy, the customers' demand is increased in period 2 with 270 MW compared to period 1 with 250 MW, the generation cost is increased from 639.18 \$ to 697.07 \$ by 57.89 \$, and the customers benefit also increased from 6575.00 \$ to 6743.00 \$, and that has affected the social profit which is maximized from 5935.81 \$ to 6045.92 \$ by 110.11 \$. In the high bidding strategy, the customers' demand is also increased from period 2 to period 1. The generation cost also increased from 639.08 \$ to 696.91 \$ by 57.83 \$ which is the same as in medium bidding strategy, but customers benefit increased significantly from 7650 \$ to 8490 \$ which has affected the social profit much more which is maximized from 7010.91 \$ to 7793.08 \$ by 782.17 \$. Figure 3 resume the simulation results and shows that the total social profit is maximized in the case of high strategy with 14803.99 \$, due to the higher received benefit with 16140 \$ when minimizing the generation cost to 1335.99 \$ comparing to medium and low bidding strategies where the customer can submit the maximum of his power demand due to the higher received benefit. Figure 4 presents the total social profit convergence under low, medium, and high bidding strategy.
The proposed method is compared for evaluation and validation to other known methods. Table 5 presents the simulation outcomes resulting from the SA algorithm compared to PSO, DE, SOS, and GA for IEEE 30-bus test system.
Table 4. Optimal bid-based dispatch results under bidding strategies
|
|
Low Bidding |
Medium Bidding |
High Bidding |
|||
|
Parameters |
Period 1 |
Period 2 |
Period 1 |
Period 2 |
Period 1 |
Period 2 |
|
P1(MW) |
88.81 |
50.01 |
91.79 |
112.56 |
91.92 |
112.89 |
|
P2(MW) |
58.41 |
80.00 |
80.00 |
80.00 |
80.00 |
80.00 |
|
P3(MW) |
37.01 |
17.39 |
50.00 |
50.00 |
50.00 |
50.00 |
|
P4(MW) |
10.06 |
10.00 |
10.00 |
10.26 |
10.00 |
10.02 |
|
P5(MW) |
10.06 |
10.00 |
10.06 |
10.00 |
10.06 |
10.01 |
|
P6(MW) |
12.00 |
12.01 |
12.19 |
12.13 |
12.06 |
12.03 |
|
Total Generation (MW) |
216.38 |
179.43 |
254.05 |
274.95 |
254.06 |
274.97 |
|
Customer 1 |
132.01 |
70.00 |
150.00 |
70.00 |
150.00 |
70.00 |
|
Customer 2 |
81.45 |
106.83 |
100.00 |
200.00 |
100.00 |
200.00 |
|
Total Demand (MW) |
213.46 |
176.83 |
250.00 |
270.00 |
250.00 |
270.00 |
|
System losses (MW) |
2.92 |
2.60 |
4.05 |
4.95 |
4.06 |
4.97 |
|
Generation cost ($) |
520.65 |
486.21 |
639.18 |
697.07 |
639.08 |
696.91 |
|
Customers benefit ($) |
2285.64 |
1795.43 |
6575.00 |
6743.00 |
7650.00 |
8490.00 |
|
Social profit ($) |
1764.98 |
1309.21 |
5935.81 |
6045.92 |
7010.91 |
7793.08 |
Figure 3. Comparison of results under bidding strategies
Figure 4. Social profit convergence characteristics
Table 5. Results comparison with different approaches
|
Bidding Strategies |
Approaches |
Total Gen cost ($) |
Total Customers benefit ($) |
Total Social profit ($) |
|
Low Bidding Strategy |
DE [20] |
989.72 |
4101.3 |
3111.50 |
|
PSO [20] |
1851.0 |
3483.8 |
1632.80 |
|
|
SOS [27] |
901.6 |
4101.3 |
3199.60 |
|
|
GA [17] |
1021.95 |
4073.37 |
3051.41 |
|
|
SA |
1006.86 |
4081.07 |
3074.19 |
|
|
Medium Bidding Strategy |
DE [20] |
1431.5 |
13318 |
11886.50 |
|
PSO [20] |
1928.2 |
12141 |
10213.00 |
|
|
SOS [27] |
1369.9 |
13318 |
11948.00 |
|
|
GA [17] |
1337.63 |
13318 |
11980.35 |
|
|
SA |
1336.25 |
13318 |
11981.73 |
|
|
High Bidding Strategy |
DE [20] |
1431.5 |
16140 |
14708.5 |
|
PSO [20] |
1793.1 |
15570.5 |
13777 |
|
|
SOS [27] |
1369.2 |
16140 |
14770.7 |
|
|
GA [17] |
1336.43 |
16140 |
14803.55 |
|
|
SA |
1335.99 |
16140 |
14803.99 |
It is noticed from Table 4 that the SOS algorithm has performed better than the compared algorithms by achieving the maximum total social profit with 3199.60 \$ which is higher than PSO, DE, GA, and the proposed SA algorithms by 1566.8 \$, 88.1 \$, 148.19 \$, and 125.41 \$, respectively just for low bidding strategy. On the other hand, for a medium bidding strategy, the proposed SA algorithm has achieved the maximum total social profit with 11981.73 \$ which is higher than PSO, DE, SOS, and GA by 1768.73 \$, 95.23 \$, 33\$.73\$, and 1.38 \$ respectively. As a consequence of a higher received customers benefit and a minimized generation cost compared to other algorithms. In the high bidding strategy, the proposed SA has outperformed the other algorithms by achieving a maximal profit of 14803.99 \$ which is higher than PSO, DE, SOS, and GA by 1026.99 \$, 95 \$, 33.29 \$, and 0.44 \$ respectively due to the higher obtained customers benefit and the minimized generation cost compared to the other algorithms.
4.2 Case 2: BBDED with wind energy integration
To study the wind energy integration effect on the BBDED problem, two results are compared, the generation cost and the social profit of participants, to show the wind energy integration's economic impact. The BBDED problem is solved with wind energy integration. The case of the high bidding strategy is considered for the investigation of the effect of wind energy injection during the electricity market trading periods. The wind energy generator output is computed using the Eq. (12) considering a linear wind speed variation from 4.17m/s to 6.67 m/s, which is forecasted in a short duration (4 hours) for the height of 10 m by using the historical forecasted wind speed data set from a meteorological wind station [28, 29]. The level of wind energy penetration is computed according to the maximum wind energy (Pw = 64.865 MW) injected in the system with wind speed variation and estimated with 4 levels: 25 %, 50 %, 75%, and 100% Pw [30], as given in Table 6.
Table 6. Forecasted wind speed data
|
Hour |
Average wind Penetration level (%) |
Wind speed at 10 m height (m/s) |
Wind energy (MW) |
|
1 |
25 |
4.17 |
15.835 |
|
2 |
50 |
5.28 |
32.185 |
|
3 |
75 |
6.11 |
49.965 |
|
4 |
100 |
6.67 |
64.865 |
Table 7. Results with wind power variation under high bidding strategy
|
Pw (%) |
25 % |
50 % |
75 % |
100 % |
||||
|
Parameters |
Period 1 |
Period 2 |
Period 1 |
Period 2 |
Period 1 |
Period 2 |
Period 1 |
Period 2 |
|
P1(MW) |
75.55 |
95.63 |
58.57 |
79.07 |
50.14 |
60.81 |
50.04 |
50.00 |
|
P2(MW) |
80.00 |
80.00 |
80.00 |
80.00 |
80.00 |
80.00 |
80.00 |
80.00 |
|
P3(MW) |
50.00 |
50.00 |
50.00 |
50.00 |
50.00 |
50.00 |
50.00 |
50.00 |
|
P4(MW) |
10.00 |
10.44 |
10.08 |
10.19 |
10.03 |
10.00 |
10.02 |
10.04 |
|
P5(MW) |
10.05 |
10.12 |
10.11 |
10.05 |
10.12 |
10.23 |
10.02 |
10.01 |
|
P6(MW) |
12.02 |
12.16 |
12.00 |
12.07 |
12.03 |
12.01 |
12.06 |
12.00 |
|
Total Generation (MW) |
253.47 |
274.21 |
252.97 |
273.59 |
252.77 |
273.03 |
252.76 |
272.76 |
|
Customer 1 |
150.00 |
70.00 |
150.00 |
70.00 |
150.00 |
70.00 |
150.00 |
70.00 |
|
Customer 2 |
100.00 |
200.00 |
100.00 |
200.00 |
100.00 |
200.00 |
100.00 |
200.00 |
|
Total Demand (MW) |
250.00 |
270.00 |
250.00 |
270.00 |
250.00 |
270.00 |
250.00 |
270.00 |
|
System losses (MW) |
3.47 |
4.21 |
2.97 |
3.59 |
2.77 |
3.03 |
2.76 |
2.76 |
|
Generation cost ($) |
607.00 |
663.10 |
577.99 |
629.97 |
563.81 |
596.98 |
539.08 |
578.51 |
|
Customers benefit ($) |
7650.00 |
8490 |
7650.00 |
8490.00 |
7650.00 |
8490.00 |
7650.00 |
8490.00 |
|
Social profit ($) |
7042.24 |
7826.89 |
7072.00 |
7860.02 |
7086.18 |
7893.01 |
7110.91 |
7911.48 |
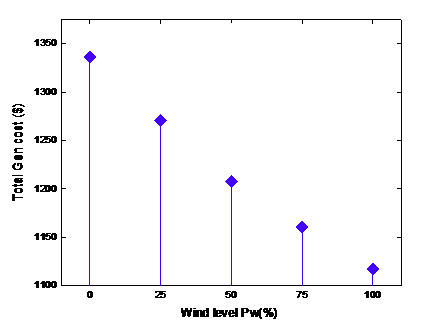
The wind generator's cost coefficient is calculated from the equivalent coefficient of the conventional unit, with 37.55% [31, 32]. The bid-based dispatch was carried out for each wind speed, considering the discussed constraints in Eq. (5)-(10). In this case, two outcomes are simultaneously optimized as objective functions, minimizing the total generation cost and maximizing the total social profit with the wind speed/energy variation. The customers' load demand is kept as in the previous case. The simulation results are illustrated in Table 7, Figures 5 and 6 after the trading periods.
Figure 5. Total generation cost with wind power penetration
Figure 6. Total social profit with wind energy penetration
From Table 7, Figure 5, and Figure 6, it is noticed that, when the injection of wind energy generation is increased, the thermal generators' power is continuously reduced, which leads to the minimization of total generation cost. If the wind generator works with 25% of its power injection, we can save 1270.1 \$ of total generation cost with a 14869.13 \$ of total social profit. If the wind generator works with 100%, we can save 1117.59 \$ of the total generation cost with 15022.39 \$ of the total social profit. The customer benefit is kept higher and not affected by wind energy injection than system losses, which are decreased in all cases. Therefore, social profit is significantly maximized due to the minimization in the generation cost of thermal generators when wind energy is increased, as shown in Table 8, which compares the two study cases outcomes.
Table 8. Results comparison of two study cases
|
Case |
Without wind energy |
With wind energy |
|
Total Generation cost ($) |
1335.99 |
1117.59 |
|
Total Customers benefit ($) |
16140 |
16140 |
|
Total Social profit ($) |
14803.99 |
15022.39 |
|
System losses (MW) |
9.03 |
5.52 |
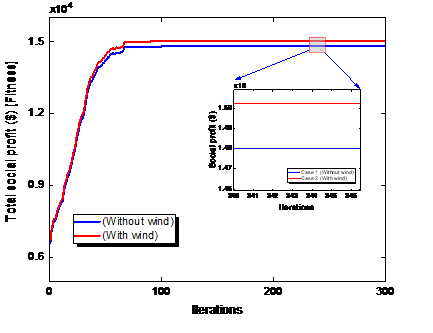
Table 8 shows that the BBDED solution using the SA algorithm, including wind energy, reduces thermal generators' output, transmission system losses, and the total cost of generation, which leads to a maximum social profit for the generating companies and an improved benefit for the customers. Figure 7 depicts the convergence curves of the proposed SA algorithm solution for both study cases.
Figure 7. Social profit convergence curve comparison with and without wind energy
In this paper, a BBDED, including wind energy using an efficient SA algorithm is solved. An IEEE 30-bus test system with 6 units has been used to test and validate the proposed algorithm under various complex constraints such as power balance constraint, transmission line losses, generation limits, and ramp rate limits which are satisfied with the proposed SA. Fast convergence is achieved by treating the solutions with a higher precision probabilistic technique. Thus, the SA algorithm presented and implemented in this paper produces the best possible solutions for the BBDED problem with wind energy integration. In the first part of this paper, a comparison between bidding strategies is made, and it is shown that social profit is maximized when GENCOs and customers submit bids under a high bidding strategy, while the SA algorithm has succeeded in minimizing the generation cost and maximizing the social profit effectively compared to other heuristic algorithms. In the second part, the effect of wind energy is studied in the dispatching model. The BBDED with wind energy integration shows a better performance in minimizing the generation cost and system losses, leading to significantly maximized social profit, confirming the benefits of integrating renewables into electrical systems.
Future work includes the integration of flexible alternating current transmission (FACT) devices in the BBDED problem in an integrated wind-thermal power system.
[1] Khaloie, H., Abdollahi, A., Shafie-Khah, M., Siano, P., Nojavan, S., Anvari-Moghaddam, A., Catalão, J.P. (2020). Co-optimized bidding strategy of an integrated wind-thermal-photovoltaic system in deregulated electricity market under uncertainties. Journal of Cleaner Production, 242: 118434. http://dx.doi.org/10.1016/j.jclepro.2019.118434
[2] Cao, D., Hu, W., Xu, X., Dragičević, T., Huang, Q., Liu, Z., Chen, Z., Blaabjerg, F. (2020). Bidding strategy for trading wind energy and purchasing reserve of wind power producer–A DRL based approach. International Journal of Electrical Power & Energy Systems, 117: 105648. https://doi.org/10.1016/j.ijepes.2019.105648
[3] Shah, D., Chatterjee, S. (2020). A comprehensive review on day-ahead electricity market and important features of world's major electric power exchanges. International Transactions on Electrical Energy Systems, 30(7): e12360. http://dx.doi.org/10.1002/2050-7038.12360
[4] Chinmoy, L., Iniyan, S., Goic, R. (2019). Modeling wind power investments, policies and social benefits for deregulated electricity market–a review. Applied Energy, 242: 364-377. http://dx.doi.org/10.1016/j.apenergy.2019.03.088
[5] Jadoun, V.K., Pandey, V.C., Gupta, N., Niazi, K.R., Swarnkar, A. (2018). Integration of renewable energy sources in dynamic economic load dispatch problem using an improved fireworks algorithm. IET Renewable Power Generation, 12(9): 1004-1011. http://dx.doi.org/10.1049/iet-rpg.2017.0744
[6] Zhou, Y., Shi, L., Ni, Y. (2019). An improved scenario reduction technique and its application in dynamic economic dispatch incorporating wind power. 2019 IEEE Innovative Smart Grid Technologies-Asia, pp. 3168-3178. http://dx.doi.org/10.1109/ISGT-Asia.2019.8881144
[7] Abid, A., Malik, T.N., Abid, F., Sajjad, I.A. (2020). Dynamic economic dispatch incorporating photovoltaic and wind generation using hybrid FPA with SQP. IETE Journal of Research, 66(2): 204-213. http://dx.doi.org/10.1080/03772063.2018.1483748
[8] Bai, Y., Wu, X., Xia, A. (2020). An enhanced multi-objective differential evolution algorithm for dynamic environmental economic dispatch of power system with wind power. Energy Science & Engineering, 1-14. https://doi.org/10.1002/ese3.827
[9] Ghasemi, A., Gheydi, M., Golkar, M.J., Eslami, M. (2016). Modeling of Wind/Environment/Economic Dispatch in power system and solving via an online learning meta-heuristic method. Applied Soft Computing, 43: 454-468. http://dx.doi.org/10.1016/j.asoc.2016.02.046
[10] Geetha, K., Deve, V.S., Keerthivasan, K. (2015). Design of economic dispatch model for Gencos with thermal and wind powered generators. International Journal of Electrical Power & Energy Systems, 68: 222-232. http://dx.doi.org/10.1016/j.ijepes.2014.12.069
[11] Palit, D., Chakraborty, N. (2019). Optimal bidding in emission constrained economic dispatch. International Journal of Environmental Science and Technology, 16(12): 7953-7972. http://dx.doi.org/10.1007/s13762-018-2160-6
[12] Liao, G.C. (2012). Integrated isolation niche and immune genetic algorithm for solving bid-based dynamic economic dispatch. International Journal of Electrical Power & Energy Systems, 42(1): 264-275. http://dx.doi.org/10.1016/j.ijepes.2012.03.005
[13] Orike, S., Corne, D. (2013). An evolutionary algorithm for bid-based dynamic economic load dispatch in a deregulated electricity market. 2013 13th UK Workshop on Computational Intelligence, Guildford, UK, pp. 313-320. http://dx.doi.org/10.1109/UKCI.2013.6651322
[14] Tiwari, A., Pandit, M., Dubey, H.M. (2017). Profit maximization through bid based dynamic power dispatch using symbiotic organism search. Journal of Information and Computing Science, 12(1): 003-013. http://www.worldacademicunion.com/journal/1746-7659JIC/jicvol12no1paper01.
[15] Santosa, B., Rusdiansyah, A. (2018, April). Cost analysis of an electricity supply chain using modification of price based dynamic economic dispatch in wheeling transaction scheme. Materials Science and Engineering Conference Series, 337(1): 012009. http://dx.doi.org/10.1088/1757-899X/337/1/012009
[16] Nwulu, N. (2017). Emission constrained bid based dynamic economic dispatch using quadratic programming. IEEE 2017 International Conference on Energy, Communication, Data Analytics, and Soft Computing, India, pp. 213-216. http://dx.doi.org/10.1109/ICECDS.2017.8389806
[17] Salhi, Y., Benhamida, F., Ziane, I., Graa, A. (2017). The dynamic economic load dispatch in electricity market using genetic algorithm. Electrotehnica, Electronica, Automatica, 65(2): 54-59. http://www.eea-journal.ro/ro/d/5/p/EEA65_2_8.
[18] Sahoo, M., Rani, N., Malakar, T. (2020, July). A solution of bid-based dynamic economic load dispatch using competitive swarm optimizer approach. In IEEE Students Conference on Engineering & Systems, India, pp. 1-6. http://dx.doi.org/10.1109/SCES50439.2020.9236697
[19] Lin, W.M., Chen, S.J. (2002). Bid-based dynamic economic dispatch with an efficient interior point algorithm. International Journal of Electrical Power & Energy Systems, 24(1): 51-57. https://doi.org/10.1016/s0142-0615(01)00007-2
[20] Rampriya, B., Mahadevan, K., Kannan, S. (2012). Application of differential evolution to dynamic economic dispatch problem with transmission losses under various bidding strategies in electricity markets. Journal of Electrical Engineering & Technology, 7(5): 681-688. http://dx.doi.org/10.5370/JEET.2012.7.5.681
[21] Wen, F., David, A.K. (2001). Optimal bidding strategies and modeling of imperfect information among competitive generators. IEEE Transactions on Power Systems, 16(1): 15-21. http://dx.doi.org/10.1109/59.910776
[22] Huang, W.T., Yao, K.C., Chen, M.K., Wang, F.Y., Zhu, C.H., Chang, Y.R., Lee, Y.D., Ho, Y.H. (2018). Derivation and application of a new transmission loss formula for power system economic dispatch. Energies, 11(2): 417. http://dx.doi.org/10.3390/en11020417
[23] El-Shimy, M. (2010). Optimal site matching of wind turbine generator: Case study of the Gulf of Suez region in Egypt. Renewable Energy, 35(8): 1870-1878. http://dx.doi.org/10.1016/j.renene.2009.12.013
[24] Kirkpatrick, S., Gelatt, C.D., Vecchi, M.P. (1983). Optimization by simulated annealing. Science, 220(4598): 671-680. http://dx.doi.org/10.1126/science.220.4598.671
[25] Bouddou, R., Benhamida, F., Zeggai, A., Ziane, I., Belgacem, M. (2020) The dynamic economic dispatch in an integrated wind-thermal electricity market using simulated annealing algorithm. Przeglad Elektrotechniczny, 96(11): 55-60. http://dx.doi.org/10.15199/48.2020.11.12
[26] Dhillon, J., Kumar, P., Jain, S.K. (2018). Optimal power dispatch solution through multi objective formulation. In IEEE International Conference on Intelligent Circuits and Systems, India, pp. 378-381. http://dx.doi.org/10.1109/ICICS.2018.00083
[27] Tiwari, A., Pandit, M. (2016). Bid based economic load dispatch using symbiotic organisms search algorithm. In IEEE 2016 International Conference on Engineering and Technology, India, pp. 1073-1078. http://dx.doi.org/10.1109/ICETECH.2016.7569414
[28] Dawn, S., Tiwari, P.K., Goswami, A.K. (2017). An approach for efficient assessment of the performance of double auction competitive power market under variable imbalance cost due to high uncertain wind penetration. Renewable Energy, 108: 230-243. http://dx.doi.org/10.1016/j.renene.2017.02.061
[29] Database: World temperatures-weather around the world. https://www.timeanddate.com/weather/, accessed on Jan. 21, 2020.
[30] Ziane, I., Benhamida, F., Graa, A. (2016). Renewable energy impact in the environmental/economic dispatch using simulated annealing algorithm. Electrotehnica, Electronica, Automatica, 64(2): 177.
[31] Roy, S. (2012). Inclusion of short duration wind variations in economic load dispatch. IEEE Transactions on Sustainable Energy, 3(2): 265-273. http://dx.doi.org/10.1109/TSTE.2011.2179954
[32] Bouddou, R., Benhamida, F., Zeggai, A., Belgacem, M., Khatir, M. (2020). Integration of wind power generation into a double-sided competitive electricity market for profit and social welfare maximization. 2020 International Conference on Electrical and Information Technologies, Moroco, pp. 1-6. http://dx.doi.org/10.1109/ICEIT48248.2020.9113173