Yasser Abd Djawad* | Hamza Rehman | Oslan Jumadi | Muhammad Tufail | Shahzad Anwar | Nathalie Bourgougnon
© 2020 IIETA. This article is published by IIETA and is licensed under the CC BY 4.0 license (http://creativecommons.org/licenses/by/4.0/).
OPEN ACCESS
Determination of nitrogen levels in plants is essential for variable rate fertilizer application in precision agriculture. In the past, several techniques have been developed for nitrogen concentration estimation in plants and crops employing vision system, however, they are computationally expensive and hence requires a considerable amount of time to produce accurate results. The technique developed in this work the determination of nitrogen levels in plants could be achieved effectively in real-time time by advance image processing techniques, machine visions and support vector machine (SVM) with MATLAB. The developed technique processes leaf’s colored image via examining it Red, Green and Blue (RGB) values and compares them with standard intensity levels. The experimental results show effectiveness of the developed technique and accurately detect low or high concentration levels in corn. In addition, this method depends on two techniques for a final result, i.e. color intensity and SVM. If the answer is not similar between the two techniques the process will be repeated until the detection is similar. This study could be applied to a variety of crops, since this technique does not require large collection of data for training and special expertise for its on-field application.
nitrogen level, colour intensity, image processing
Crops growth is influenced by two variables, namely genetic variables and environmental variables. Nutrients availability in soil is one of the key environmental variable and Nitrogen (N) is one of important nutrient for growth. N-content in crops plays an important role in photosynthesis and can increase crops yield. However, excess N elements in crops could cause a number of problems too, such as plant collapse due to large leaf size, increased production costs and environmental problems due to N2O gas emissions [1, 2].
Corn (Zea Mays L.), like other crops, also requires nitrogen nutrients for its growth. To provide additional nitrogen nutrients, nitrogen fertilizer is applied. Nitrogen provision as fertilizer is based on soil condition and crops need. In order to measure the nutrient content of crops, Soil Plant Analysis Development (SPAD) is employed by looking at the chlorophyll content of the leaves. Furthermore, researchers incorporate an alternative method by observing the leaf colour. Leaf colour could possess information related to level of N fertilization for a crop [3-6].
Various crops have been targeted in literature incorporating vision based techniques. Deficiency and excess of N in soybean leaf were investigated using the RGB and HSI models [3]. Similarly, experiments have conducted using various methods such Fourier and Wavelet transforms to extract colour and texture of the tomato leaves [7]. Corn leaf has been investigated using Dark Green Colour Index (DGCI) [8]. Nitrogen status of rice leaf was studied using segmentation technique [5].
Plants defects were examined using pattern recognition techniques utilizing leaf surface texture [9, 10]. In this study we move a step ahead from determining defects and plants disease to determining the level of fertility of a plant by examining its nitrogen level [11]. The proposed algorithm overcomes the traditional way of manually examining plants and uses an automated system using image processing techniques. The following four techniques are widely used for examination of nitrogen in plants [12].
Chemical Test method: determines nitrogen in plants by the use of chemical analysis which is mostly time consuming and expensive [9]. The method requires expensive chemicals and a team of trained laboratory technician to perform experimentation, after which an expert would rule out the result. This process takes up weeks and therefore the plant condition may have changed while the test is being performed.
SPAD Meter: measures transmission of light through leaves and has been proved as an industry standard for measurement [10, 11, 13, 14]. However, there are several factors that may compromise the measurement accuracy such as plant growth stage, environment condition, and presence of pests etc. [15]. Despite its good result the method has a limitation, i.e. very time consuming expensive and depends on many external factors.
Normalized Difference Vegetation Index (NVDI): method could be used to measure plant activity such as photosynthesis which also leads to chlorophyll and nitrogen content. This technique is based on measurements taken through a satellite system [16, 17]. This makes the system expensive, complicated and complex.
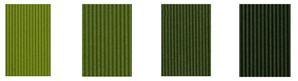
Leaf color chart: has replaced the SPAD chlorophyll meter for plant nitrogen level examination. This technique is simple and inexpensive to use and uses a strip that contains color from yellowish to dark green. There are generally four or more color shades [18]. The green chart is usually used as a reference state of the plant showing low or high concentration as shown in Figure 1. This method involves the use of computer vision and automated techniques. This method saves the cost and effort involved in sending experts to manually observe the plant, take samples and send it off to the laborites for further testing. to come to the concussion of the hydrogen level which is very time consuming and expensive, as many farmers may not be able to afford a botany expert and lab tests. During the process, chances are, that the plans may have bad effect due to imbalance of nitrogen thus an automated technique will give an edge to the previous old techniques in identifying the level of nitrogen. Therefore, this method was used in this study.
Figure 1. Leaf color chart
2.1 Data collection and design of experiment
The field experiment site was laid in the Cereal Crops Research Institute, Maros, South Sulawesi, Indonesia (4°58'55.3"S, 119°34'28.2"E). The area is located in a tropical climate zone. Climate is classified as Af based on the Köppen-Geiger climate classification system. Average temperature is 29℃ and average rainfall is 347 mm/month. The soil at the experiment site was an alluvial soil type. The texture of field soil was 8% sand, 54% silt, 38% clay which belongs to texture classified as silty clay loam [19].
The site for experiments was divided into two corn fields. One field was fertilized with extracted algae (Algae field) and another field was fertilized with polymer (Polymer field). Algae field consisted of the following characteristic: (1) controlled corn that did not receive any treatment with any fertilizer, (2) corn fertilized using NPK, and (3) corn fertilized using 30% extracted algae; 60% extracted algae; and 90% extracted algae. Polymer field consisted of: (1) controlled corn that did not receive any treatment with any fertilizer, (2) corn fertilized using NPK, and (3) corn fertilized using polymer (without zeolite), polymer zeolite 15% and polymer zeolite 30%. The amount of N was 150 kg/ hectare and P and K were 50 kg/hectare respectively. Fertilizer was given once at the beginning of planting. However, in this study focused on leaves that are fertilized with algae and polymer. Three months after plantation, leaves were cut and gathered for each sample. Leaves were cut into three sections: base of leaf, middle leaf and leaf shoots. The leaves were scanned using a Canon L120 having resolution of 400 dpi and were saved in PNG (Portable Network Graphics) file-format.
The most important experiments conducted was on the unsupervised machine learning algorithm, Support Vector Machine, for training and teaching the algorithm to accuracy discriminate between high and low level of nitrogen. For this purposed, the scanned images were stored to create a database. The database provided with verity data points and training points for the classifier to train on. The three layers, i.e. based on leaf, middle of leaf and leaf shoots were used to determine the accuracy of the machine learning technique. This section of experiments was conducting in three section, first to determining level of nitrogen in the base of the leaf, then the middle and in the end the leaf shot. Since these images were provided in section, it was compared if all three section were classified in the same group or different group. The classier was tested and experimented on nine thousand images in the experimented site before it could be used outside the experiment filed.
Subsequent to a detailed review about slandered accuracy rate, the classifier was used to determine new samples. This step was performed to evaluate the accuracy of the SVM for new and unfamiliar cases. The SVM proved to properly identify new cases and unfamiliar cases. The new and unfamiliar cases were stored in the database, in this way the database will have new data points to train on and the evaluation process will be updated and more robust. The final result is compared with the universal chart and the answer feature by the classifier.
2.2 Description of the image processing algorithm
Previously developed methods have been proven to be time consuming and expensive, an automated method that uses non-intrusive computer vision techniques has always been a better alternative.
For performing computer vision and image processing techniques, MATLAB R2019 was used. The most basic reason for choosing this software was based on its strong and powerful control and image processing toolbox and solving any problem by convert data into matrix form and then performing operation on them.
The PNG images recorded previously provided raw data and was processed employing a tool. Features and points were extracted from the input images. The pre-processing of color scanned images included: (i) smoothing of images, (ii) noise removal, and (iii) image pixilation. The reason to pixelate images is to reduce extra load on the processor ensuring its real-time performance and faster response. Mathematical equations (as listed following), were introduced for calculation for the process of feature extraction for improved processing. These features are enormous importance for the classifier to properly detect the level of nitrogen in an image. Eq. (1) was used for smoothing the image.
$c(x, y)=\frac{1}{K} \Sigma_{(s, t) \in S_{x, y}} c(s, t)$ (1)
Here K is number of pixel in neighborhood having a center of x,y and Sx,y defines set of coordinates defining neighborhood K(x,y). As the images provide were RGB, three versions of the equations were generated,
$c(x, y)=\frac{1}{K} \Sigma_{(s, t) \in S_{x, y}} R(s, t)$ (2)
$c(x, y)=\frac{1}{K} \Sigma_{(s, t) \in S_{x, y}} G(s, t)$ (3)
$c(x, y)=\frac{1}{K} \Sigma_{(s, t) \in S_{x, y}} B(s, t)$ (4)
where, R, G, B stand for Red, Green, Blue, respectively. Subsequent to color intensity detection, a machine learning classifier is also implemented for determining the state of the plant. For this, a dataset was generated and then provided to unsupervised learning classifier, support vector machine, for detecting the state of the plant. The SVM worked on the dataset to train on data points. The SVM works fast and accurately due to the kernel trick, which are the option known for pattern recognition. If the universal chart and the classifier do not give the same answer, then the process will repeat until both answers are similar. This process ensures accurate answer.
Figure 2. Experimentation flowchart
Figure 2 shows the chart used for nitrogen detection to classify plants with high (Type 2) or low (Type 1) nitrogen level. Results of classification are given in Figure 3. The experimental results show that the color intensity levels (each having a unique however similar pattern) have enough information to set a base for further development. Variation in color intensity can be related to the changes in nitrogen levels. Light green shows lack of nitrogen whereas dark green shows access of nitrogen.
Figure 3. Concentration level of nitrogen
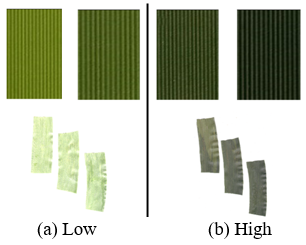
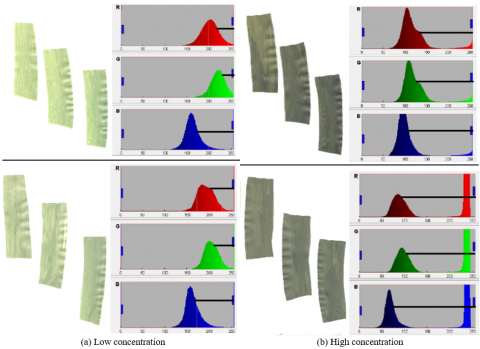
In this section, the pre-processed leaf images were closely examined and multiple histograms of RGB scales are generated to observe similarity. Two sets of histograms corresponding to low and high concentration of nitrogen are shown in Figure 4.
Table 1 shows information (ranges) extracted from these histograms.
Figure 4. Two level of nitrogen concentrations based on corn leaf colour
Table 1. Level of nitrogen concentration level based on RGB
|
Colour / concentration |
Low |
High |
|
Red |
140-250 |
1st spike: 50-130, 2nd spike 200-250 |
|
Green |
100-230 |
1st spike: 40-130, 2nd spike: 200-250 |
|
Blue |
150-250 |
1st spike: 50-140, 2nd spike 200-250 |
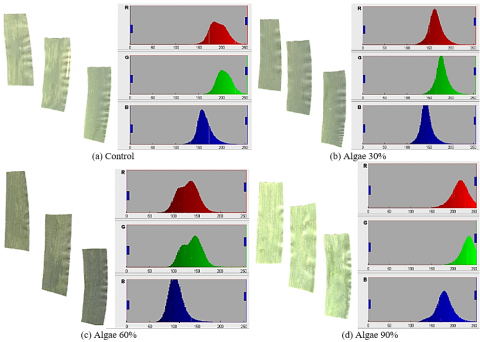
Figure 5. Low level nitrogen concentration of corn fertilized by extract of algae
Two sets of experiments were performed, the first experiment involved manual comparison of the leaf with the green chart to identify the nitrogen level of a plant. The samples were grouped into two sets i.e. high and low nitrogen. The results were saved along with samples. The same experiment was performed using scanned image. The nitrogen level was categorized as high or low based on the given algorithm. After the results as shown in Figure 5, another data set was created to store all the generated results. These results were compared with the manual reading. It was found that computation gave the same results as the green chart up to 95%. There were more than one thousand samples that were used in the experiment before reaching a final accuracy rate. The green chart was then increased into the algorithm for better understanding and categorization of the result as shown in Figure 6.
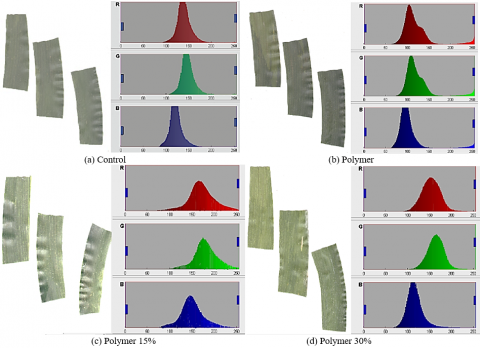
Figure 6. High level nitrogen concentration of corn fertilized by polymer
The function of nitrogen in general is to stimulate plant growth and give the leaf a green color. The darker the green color on the leaves the more is the elemental nitrogen absorbed by the plant. In cereal plants, high nitrogen uptake can increase crop yields [20].
By using computer vision techniques, differences in the greenness of leaf color can be detected which are divided into 2 levels, namely low and high. This nitrogen level is based on a combination of Red, Green and Blue colors that form a bright or dark green color. Low levels of nitrogen found in corn fertilized with algae and darker leaf colors or higher nitrogen levels are found in corn fertilized with polymer. This indicates that the algae fertilized corn does not contain large amounts of nitrogen to be absorbed by plants. Instead, corn fertilized with polymers contains enough nitrogen to be absorbed by plants as seen in darker green leaves. The same thing is experienced by plants fertilized with NPK.
Figure 7. Difference between the graph peaks for low and high level concentration of nitrogen
As a comparison, nitrogen measurements using the Kjeldahl technique were also carried out in this study. The results in Table 2 shows that there are differences in measurement results for the corn fertilized with algae and polymer. The corn fertilized using polymers shows higher nitrogen levels when compared to corn fertilized with algae. In addition, the correlation of both measurement using Pearson correlation coefficient formula was used and it shows that there is strong positive correlation of both method which is shown by numbers 0.973 for low level concentration and 0.999 for high level concentration as shown on Table 3. This reveals that both measurements are correlated.
Table 2. Measurement nitrogen level of corn fertilized by algae and polymer fertilizer using Kjeldahl technique
|
Nitrogen concentration (%) |
|||
|
Control |
Algae (30%) |
Algae (60%) |
Algae (90%) |
|
1.67 |
1.56 |
1.66 |
1.9 |
|
Control |
Polymer |
Polymer (15%) |
Polymer (30%) |
|
1.67 |
1.99 |
2.12 |
2.27 |
Table 3. Pearson correlation coefficients between image processing technique and Kjeldahl technique
|
Level/Colour |
Red |
Green |
Blue |
|
Low |
0.973 |
0.973 |
0.973 |
|
High |
0.999 |
0.999 |
0.999 |
Figure 4 shows the graphical representation of differences between high and low level of nitrogen. However, Figure 7 represents the difference between these graphs by using a backline. As shown in the graph, the spikes start from 50-80 rang. While that of low level starts after 100. The nitrogen level when low, the spikes starts at a higher value and when the nitrogen is high the spikes start at a smaller value.
Determining nitrogen level of a plant was a time inefficient process and not cost effective. This paper presents a time effecting and cost effecting technique for detection of nitrogen content in corn leaves by image procession and machine vison techniques, which been carried out by employing colour intensity levels in corn leaves. The technique used in this study uses existing leaf references to determine low or high nitrogen content. Leaf images obtained are processed to obtain the colour intensity of R, G and B in the leaves. The results of this colour intensity are compared with existing standard reference colours. Results show that the developed technique can accurately detect low or high nitrogen levels in corn leaves. Low nitrogen levels are indicated by leaves that are given algae fertilizer and high nitrogen levels are indicated by corn fertilized with NPK and polymer.
Currently how this technique could be deployed having limited computation power and in real time, acquiring similar result is in progress.
This work is supported by the Director General of Scientific and Technological Development and Advancement, Ministry of National Education, the Republic of Indonesia, batch No. 042.06.1.401516/2019.
|
c |
feature extraction variable |
|
K |
centre of the pixel |
|
Sx,y |
set of coordinates defining neighborhood K(x,y) |
|
t |
time |
[1] Stuart, D., Schewe, R.L., McDermott, M. (2014). Reducing nitrogen fertilizer application as a climate change mitigation strategy: Understanding farmer decision-making and potential barriers to change in the US. Land Use Policy, 36: 210-218. https://doi.org/10.1016/j.landusepol.2013.08.011
[2] Fagodiya, R.K., Pathak, H., Kumar, A., Bhatia, A., Jain, N. (2017). Global temperature change potential of nitrogen use in agriculture: A 50-year assessment. Scientific Reports, 7: 44928. https://dx.doi.org/10.1038/srep44928
[3] Ma, L., Fang, J.L., Chen, Y.H., Gong, S.P. (2010). Color analysis of leaf images of deficiencies and excess nitrogen content in soybean leaves. In 2010 International Conference on E-Product E-Service and E-Entertainment, Henan, China, pp. 1-3. https://doi.org/10.1109/ICEEE.2010.5661235
[4] Lee, K.J., Lee, B.W. (2013). Estimation of rice growth and nitrogen nutrition status using color digital camera image analysis. European Journal of Agronomy, 48: 57-65. https://doi.org/10.1016/j.eja.2013.02.011
[5] Wang, Y., Wang, D.J., Zhang, G., Wang, J. (2013). Estimating nitrogen status of rice using the image segmentation of G-R thresholding method. Field Crops Research, 149: 33-39. https://doi.org/10.1016/j.fcr.2013.04.007
[6] Sun, Y.Y., Zhu, S.C., Yang, X., Weston, M.V., Wang, K., Shen, Z.Q., Xu, H.W., Chen, L.S. (2018). Nitrogen diagnosis based on dynamic characteristics of rice leaf image. PLOS ONE, 13(4). https://doi.org/10.1371/journal.pone.0196298
[7] Xu, G., Zhang, F.L., Shah, S.G., Ye, Y.Q., Mao, H.P. (2011). Use of leaf color images to identify nitrogen and potassium deficient tomatoes. Pattern Recognition Letters, 32(11): 1584-1590. https://doi.org/10.1016/j.patrec.2011.04.020
[8] Rorie, R.L., Purcell, L.C., Karcher, D.E., King, C.A. (2011). The Assessment of leaf nitrogen in corn from digital images. Crop Science, 51(5): 2174-2180. https://doi.org/10.2135/cropsci2010.12.0699
[9] Ulissi, V., Antonucci, F., Benincasa, P., Farneselli, M., Tosti, G., Guiducci, M., Tei, F., Costa, C., Pallottino, F., Pari, L., Menesatti, P. (2011). Nitrogen concentration estimation in tomato leaves by VIS-NIR non-destructive spectroscopy. Sensors (Basel, Switzerland), 11(6): 6411-6424. https://doi.org/10.2135/cropsci2010.12.0699
[10] Farneselli, M., Benincasa, P., Tei, F. (2010). Validation of N nutrional status tools for processing tomato. Acta Horticulturae, 852: 227-232. https://doi.org/10.17660/ActaHortic.2010.852.27
[11] Singandhupe, R.B., Rao, G.G.S.N., Patil, N.G., Brahmanand, P.S. (2003). Fertigation studies and irrigation scheduling in drip irrigation system in tomato crop (Lycopersicon esculentum L.). European Journal of Agronomy, 19(2): 327-340. https://doi.org/10.1016/S1161-0301(02)00077-1
[12] Padasali, V.A., Sunagar, V.B., Kattimani, P.A., Hiremath, N.V. (2014). Estimation of nitrogen content in leaves using image processing. In Proceedings of International Conference on Advances in Engineering & Technology, Goa, India, pp. 25-28.
[13] Lemaire, G., Jeuffroy, M.H., Gastal, F. (2008). Diagnosis tool for plant and crop N status in vegetative stage: Theory and practices for crop N management. European Journal of Agronomy, 28(4): 614-624. https://doi.org/10.1016/j.eja.2008.01.005
[14] Sandoval-Villa, M., Guertal, E.A., Wood, C.W. (2000). Tomato leaf chlorophyll meter readings as affected by variety, nitrogen form, and nighttime nutrient solution strength. Journal of Plant Nutrition, 23(5): 649-661. https://doi.org/10.1080/01904160009382047
[15] Gianquinto, G., Sambo, P., Borsato, D. (2006). Determination of SPAD threshold values for the optimisation of nitrogen supply in processing tomato. Acta Horticulturae, 700: 159-166. https://doi.org/10.17660/ActaHortic.2006.700.26
[16] Han, S., Hendrickson, L.L., Ni, B. (2002). Comparison of satellite and artial imagery for detecting leaf chlorophyl content in corn. Transactions of the ASAE, 45(4). https://doi.org/10.13031/2013.9932
[17] Pettorelli, N. (2013). The Normalized Difference Vegetation Index. Oxford University Press.
[18] Sudhalakshmi, C., Velu, V., Thiyagarajan, T.M. (2008). Leaf colour chart for nitrogen management in rice - a review. Agricultural Review, 29(4): 306-310.
[19] Jumadi, O., Hala, Y., Iriany, R.N., Makkulawu, A.T., Baba, J., Inubushi, K. (2020). Combined effects of nitrification inhibitor and zeolite on greenhouse gas fluxes and corn growth. Environmental Science and Pollution Research, 27(2): 2087-2095. https://doi.org/10.1007/s11356-019-06776-6
[20] Mengel, K., Hutsch, B., Kane, Y. (2006). Nitrogen fertilizer application rates on cereal crops according to available mineral and organic soil nitrogen. European Journal of Agronomy, 24(4): 343-348. https://doi.org/10.1016/j.eja.2005.12.001