Milap Sharma* | Krishan K. Kataria | Narendra M. Suri | Suman Kant
© 2020 IIETA. This article is published by IIETA and is licensed under the CC BY 4.0 license (http://creativecommons.org/licenses/by/4.0/).
OPEN ACCESS
Foundry workers are exposed to numerous health hazards, which includes respirable dust exposure as a prominent health issue. Apart from metallic dust, respirable crystalline silica (RCS) is generated during the fettling operation, which is very hazardous and a leading cause for silicosis. Evaluation and control of such hazards deserve particular attention in order to reduce the dust exposure level upto the permissible limits. In present study, an attempt was made to propose a low-cost design control intervention utilizing sensor based intelligence (ATmega328P microcontroller and an optical dust-sensor, SHARP GP2Y1010AU0F) for monitoring the dust exposure, followed by virtual ergonomics approach in CATIAV5R20. The proposed device was tested under several operating conditions. The results indicated that the prototype was sensitive to dust, having higher average dust density values under the dust haze weather condition (arithmetic mean (AM): 0.2590 mg/m3, geometric mean (GM): 0.2350 mg/m3) and fettling work-section (AM: 0.2550 mg/m3, GM: 0.2164 mg/m3) respectively, as compared to other conditions. Also, biomechanics analysis yielded the spine compression values lesser than the recommended limits, validating that the proposed fettling booth models could be considered as suggestive engineering control measures in conjunction with the designed prototype, so as to minimize the respirable dust exposure levels.
dust exposure, respirable crystalline silica, foundry, respiratory diseases, workers’ health, sensor, control measures
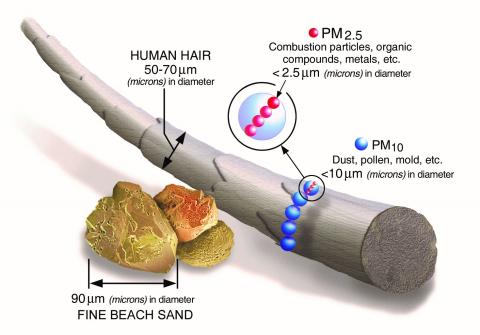
Foundry workers are exposed to numerous health hazards, which includes dust exposure as one of the major factors. Silica dust is generated during the mixing, molding, shakeout, and fettling operations. The sand being cleaned from the castings during fettling operation may also present a silica hazard [1]. Prolonged exposure to excessive concentrations of dust may cause severe lung diseases such as asthma, silicosis and so on [2]. Metallic dust is produced during the grinding and surface cleaning tasks, which could also result in respiratory problems among workers. Evaluation and control of dust hazards deserve particular attention in order to decrease the exposure level. Based on previous research studies, workers have reported respiratory discomfort due to the poor air quality in the foundry work environment [3, 4]. The presence of particulate matter (PM) in the air may cause serious health problems. PM particles (Figure 1 describes size comparison of PM particles) contains microscopic solids or liquid droplets that are so small that they can be inhaled deep into our lungs and may even get into our bloodstream [5]. Exposure to such particles can affect both our lungs and heart; which can cause various health issues like irregular heartbeat, asthma, and decreased lung function [6]. So, there is a need for providing dust preventive control monitoring to improve the air quality conditions in the foundry work environment [7, 8]. Excessive dust is generated during the fettling operation, which also includes respirable crystalline silica (RCS), a leading cause for silicosis [9].
Figure 1. Size comparison of PM particles [5] (Image courtesy: United States environmental protection agency; accessed on 15 June, 2019)
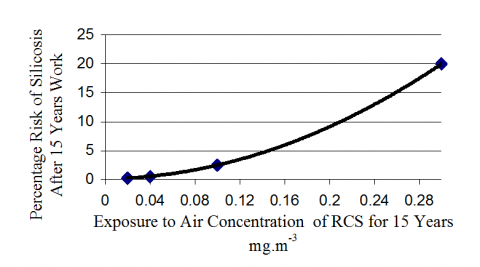
RCS is very hazardous, as respirable dust (invisible fine dust) can get deep into our lungs and may cause irreversible lung damage leading to permanent disability and even death. Silicosis is an evil outcome of RCS, causing small hard nodules of scar tissue to develop in the lungs which could be observed during chest X-ray [3, 10]. Silicosis usually takes some years to develop, with main symptoms as cough and difficulty in breathing. Workers exposed to RCS, are at increased risk of developing silicosis which may further lead to severe health related diseases such as tuberculosis, kidney disease, arthritis, and lung cancer [10]. Other severe health issues like chronic obstructive pulmonary disease (COPD) may also be considered attributable to RCS, which interferes with the lungs air movement, causing symptoms like breathlessness, cough, and sputum (phlegm) [10-12]. Due to this occupational respiratory-risk severity, National occupational health and safety commission (NOHSC) in 2004, reduced the existing exposure limit for RCS from 0.2 mg/m3 to 0.1 mg/m3 (eight-hour time-weighted average, International Organisation for Standardization (ISO)) [9]. Figure 2 describes the RCS concentration exposure effect on the percentage risk for developing silicosis after 15 years, which indicates that even RCS concentration less than the permissible limit (0.1 mg/m3), may be sufficient in developing silicosis risk during long term exposure [6, 9].
Figure 2. Effect of long-term RCS exposure on developing silicosis risk [6, 9] (Image courtesy: Health and safety laboratory (HSL), UK; accessed on 15 April, 2020)
1.2 Health surveillance
Health surveillance may be essential in analysing the prevailing health issues among foundry workers exposed to excessive dust and early detection of respiratory problems like breathing issues, lung damage, etc. Surveillance techniques may include subjective as well as medical assessments like breathing symptoms enquiries (using questionnaire), chest x-rays at regular intervals, annual health check-ups, and lung function assessment [11, 13].
1.3 Engineering control interventions
Engineering control interventions may be considered as an effective and important measure for dust exposure control [9, 14]. Gressel examined the effectiveness of local exhaust ventilation system in controlling the silica dust exposure during grinding and surface cleaning operation in a foundry, which resulted in significant reduction of the dust exposure by 59% to 79% [15]. Another literature study, suggested local exhaust ventilation and wet methods as effective/major engineering controls in dust exposure reduction [16]. Apart from this, workers’ discipline and awareness (taking preventive measures such as wearing respiratory protective equipment (RPE), following health guidelines, etc.) are also crucial factors in implementing these design interventions. By utilizing proper ergonomic design principles, interventions are possible that may suit the targeted audience [17-21]. Also, workers’ training in using the controls correctly is essential for minimizing the dust exposure level.
1.4 Intervention purpose
Fettling workers are mostly affected by numerous risk factors like awkward postures, excessive use of hand held vibrating tools, manual work demands and poor work conditions which may lead to musculoskeletal disorders [18]. Apart from this, dust hazard is another prominent risk factor present among the exposed workers, which leads to respiratory health issues. From manual observations also, it was observed that the foundry work environment is very much prone to respiratory hazards. So, the purpose is to provide a suitable design control intervention for controlling and monitoring the dust exposure, particularly RCS. The present study considered two different perspectives, in which sensor based intelligence have been utilized in providing a feasible low cost dust-control intervention, which may be beneficial in controlling the RCS dust exposure level followed by virtual ergonomics approach, in which proposed dust extraction booth design CAD models were analysed in CATIAV5R20. The proposed CAD models could be considered as suggestive engineering control measures in conjunction with the sensor based dust-control prototype, with emphasis on minimizing the respirable dust exposure level. The proposed intervention particularly targets the fettling work-section of foundry industry.
2.1 Proposed design intervention
The proposed design intervention is combination of two different concepts, i.e. (i) sensor based approach, in which a low-cost dust control monitoring device was designed using Uno R3 microcontroller and an optical dust sensor. The goal for designing this product was to improve the air quality conditions in the fettling section of small scale foundry industry, so as to provide a safer work environment for the workers involved in fettling work task (ii) computer aided design (CAD) modelling, involving 3D-CAD models of fettling dust extraction booth with local exhaust ventilation (LEV) system, governed by the low-cost dust control monitoring prototype. The proposed 3D-CAD models were further validated using the virtual ergonomics approach based on the biomechanics and vision analysis. The purpose of the dust extraction booth is to collect and contain the dust contaminants/particulate matter as close as possible to working zone, and extract it away from the worker decisively, so as to keep the dust exposures below the permissible limits.
2.2 Prototype development
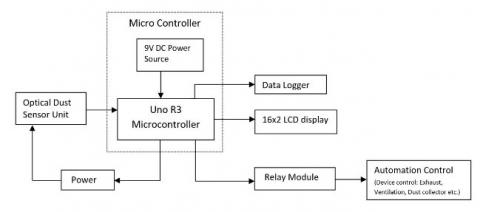
The system includes the implementation of Uno R3 microcontroller and an optical dust sensor; measuring dust density (in mg/m3) with respect to the sensor output voltage. As the communication between the microcontroller and sensor is established, data coming from the sensor is sent to the microcontroller for further processing. With the help of written program code, data is converted into useful information and used as input for the LCD display module, to display the dust density values. Figure 3 shows the illustration of the stage-I prototype system, developed for detecting the dust density. The system consists of an optical dust sensor, a microcontroller board, and laptop. The optical dust sensor unit senses the reflected light from dust particles in air, then input data is processed with the help of the written program code for the microcontroller and the output is displayed on the serial monitor via USB communication. The power required for the microcontroller board and sensor unit is provided by the laptop via USB cable. To make the system more compact, a stage-II prototype model was developed; which includes the LCD display (16x2 LCD display), 9v DC power source, data logging module, and a 5V relay module for automation control purposes. Figure 4 describes the schematic diagram for stage-II prototype.
Figure 3. Illustration of stage-I prototype
Figure 4. Illustration of stage-II prototype
2.3 Hardware and setup
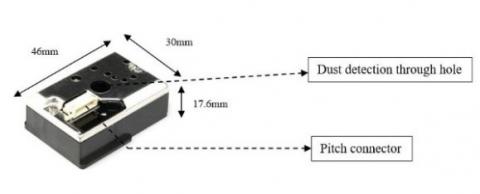
UNO R3 microcontroller board (based on the ATmega328P microcontroller) was selected and utilized for the implementation of the prototype. This version was chosen because of several reasons such as low cost, easily available than other versions, and open-source software applicability. The board is equipped with sets of digital and analog input/output (I/O) pins that may be interfaced to various circuits. It is programmable using the Arduino IDE (integrated development environment) software via USB cable. Uno R3 board can be powered by using an USB cable or by connecting an external 9 volt battery [22]. SHARP GP2Y1010AU0F (shown in Figure 5) is a compact and lightweight optical air quality sensor (having low current consumption “20mA max”, powered with up to “7V DC”), with ability to recognize dust particles in air [23]. It consists of a light emitting diode with phototransistor (light detector) which are arranged diagonally, allowing it to detect the reflected light ray from dust particles present in air. A lens and slit is positioned in between the emitting diode and detector (photodiode), to detect the light ray reflection (while detecting dust) efficiently. The detection area of the device is where those two optical axes cross each other. It generates a voltage output based on amplifying the current signal proportional to the amount of reflected light. The measured dust density value is proportional to the output analog voltage. Time required for the sensor unit to be ready to detect dust (once the system is turned on) is less than 1 second, based on the dust sensor datasheets [24]. Several research studies have also utilized SHARP optical dust sensor for PM monitoring purposes, which yielded better correlation results with the standard PM monitoring equipment’s [25, 26]. One study performed a comparative analysis among three different low cost optical PM sensors and concluded SHARP GP2Y1010AU0F sensor as a better alternative for low cost dust monitoring [27].
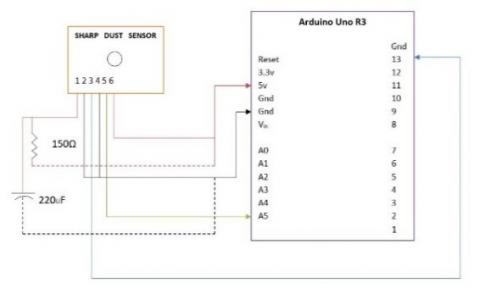
Figure 6 depicts the schematic interface circuit diagram for the microcontroller and the dust sensor unit. The sensor unit has 6 pins (ranging from 1 to 6), which are connected with the microcontroller by using a mating pitch connector. Pin 1 (V-LED) of the sensor connects to the 5V terminal of the Arduino board with a resistor of 150 Ω in between and a 220uF capacitor is connected between the interfaces. Pin 2 (LED-Gnd) and pin 4 (S-Gnd) of the sensor unit are two ground (Gnd) terminals which are connected to the Gnd pin of the microcontroller. Pin 3 (LED) connects to the digital pin 13 of the microcontroller board. The pin 5 (VO) connects to the analog input pin A5 and pin 6 (Vcc) connects to the 5V terminal. A 16x2 LCD display (with potentiometer) was further integrated in the device assembly. The hardware and the components were mounted on a PCB circuit plate to make it as single compact unit.
Figure 5. Sharp (GP2Y1010AU0F) optical dust sensor
Figure 6. Schematic diagram for microcontroller and dust sensor unit interface
2.4 Device assembly
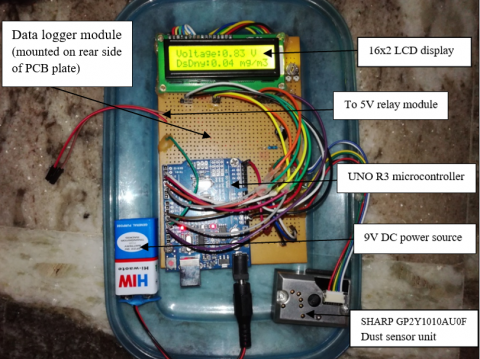
In the initial stage, the product assembly was carried on a breadboard and the output results were displayed on the Arduino serial monitor window via USB communication. In the final stage, the hardware and the components were essentially assembled and soldered on a printed circuit board (PCB) as shown in Figure 7; to make it more compact (before they could be functional), which includes the microcontroller board, 9v dc power source, dust sensor unit, data logger module (mounted on rear side of PCB plate) and connection to relay module, which can be used for automation control.
2.5 Software section
The main logic of the written code consisted of essential parts, such that each of them performs a particular duty. Combination of these parts allow reading the data from sensor and the microcontroller eventually displaying them on the LCD module for further processing.
Figure 7. Prototype assembly
Few electronics blogs and websites were utilized, while constructing the respective code [23-25]. The code is constructed in Arduino IDE Genuino 1.8.2. Below are the descriptions of some essential parts of the code:
#include <LiquidCrystal.h> // include the library code for 16x2 LCD
int measurePin = A5; // Sharp dust sensor pin 5 (Vo) is defined as measure pin attached to analog pin A5 of microcontroller.
int ledPower = 13; // Sharp dust sensor pin 3 (LED) is defined as led power attached to digital pin13 of microcontroller.
int relayPin = 8; // 5v relay module input pin is defined as relay pin attached to the digital pin 8 of microcontroller.
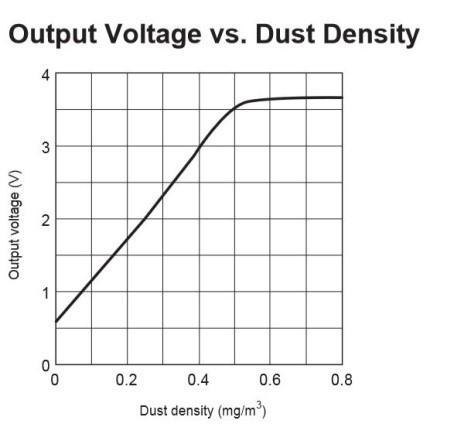
Figure 8. Dust density characteristics of GP2Y1010AU0F (sharp dust sensor datasheet) [23]
The dust density equation written in the code was developed based on output voltage (V) versus dust density (mg/m3) graph (Figure 8) provided in the sharp dust sensor datasheet [23]. A linear equation was calculated based on the graph values to approximate the mg/m3 values. The general slope intercept form equation was used to derive the linear equation based on the graph values to approximate the mg/m3 values.
$Y=m X+b ;$ represents the slope intercept form (1)
where, “Y” is the output/calculated voltage (in volts), “X” is dust density (in mg/m3), “m” is slope, and “b” is Y-intercept.
$\mathrm{m}=\frac{(\mathrm{y} 2-\mathrm{y} 1)}{(\mathrm{x} 2-\mathrm{x} 1)}$ (2)
$\mathrm{b}=\mathrm{Y}-\mathrm{mX}$ (3)
From the slope and Y-intercept value; the equation is given as:
$X=\frac{1}{m}(Y-b)$ (4)
This gives the equation as:
Dust density $=\{(0.17 *$ calcVoltage $)-0.1\}$ (5)
Based on the above mentioned Eq. (5), the maximum yielded value for dust density is 0.54 mg/m3, which is a limitation of this study, as the dust density may be more than 0.54 mg/m3. However, the study objective is devoted to respirable dust control automation depending on the RCS permissible limits (0.1 mg/m3), which may be fulfilled based on the derived equation also.
2.6 Proposed fettling booth design
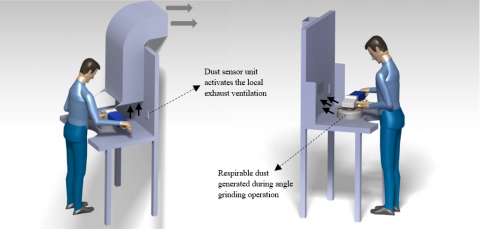
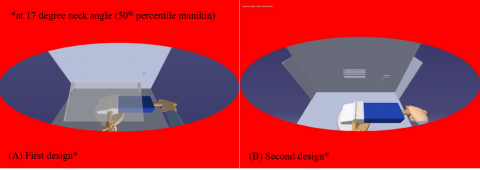
The proposed dust extraction booth designs were created using Solidworks 2015 software. Two designs were suggested (Figure 9, 10) and further analyzed via single action biomechanics analysis and vision analysis using CATIAV5R20 ergonomic design and analysis module. Collaborating the dust monitoring prototype with the suggested booth design may be considered as feasible design solution for dust control automation in fettling section of the foundry. As the respirable dust level exceeds the permissible limit, the dust monitoring device will activate the local exhaust ventilation, which collects the dust contaminants and extract it away from the worker decisively, so as to keep the dust exposures below the permissible limits.
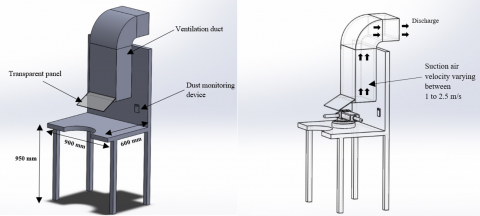
Based on the recommended HSE guidelines, while fettling small castings, a suction air velocity varying between 1 and 2.5 metres per second must be maintained into the extracted booth [13, 14]. The dust extraction system may include several components such as air filters located between the exhaust and hood (inlet enclosure), exhaust fan (to provide air flow), and ducts (for transporting the clean discharged air to the outside surroundings safely) [13]. As engineering control measure, local exhaust ventilation (LEV) system may be recommended in the fettling section of the foundry, specifically during angle grinding operation [11, 17]. The LEV system would then provide a way to extract the contaminant out of the fettling booth and away from the breathing zone of the worker. Automated LEV system may effectively be used in many fettling work tasks (dressing and grinding operations), which are generally affected by higher level of RCS exposures.
Figure 9. Proposed first design for fettling dust extraction booth
Figure 10. Proposed second design for fettling dust extraction booth
3.1 Dust monitoring using prototype
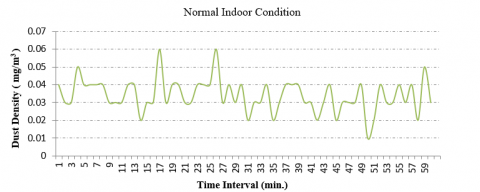
To check the dust sensitivity of the device; the prototype was tested under several conditions for 1 hour time period each, with an average dust density reading taken for every minute (while recording readings at every 5 second time interval, thus generating 12 readings every minute). So, a total of 60 average minute readings were recorded for 1 hour time period under each condition separately. Microsoft excel was used to plot these readings on a graph (Figure 11-16) and the hourly average value for each condition was calculated. The device was tested under five different conditions i.e. normal indoor condition, CNC workshop condition, outdoor condition, dust haze weather condition [28] at Punjab engineering college, Chandigarh and fettling work- environment condition (in a foundry unit located nearby Chandigarh, India).
Figure 11. Dust density variation with respect to time (normal indoor condition)
Figure 12. Dust density variation with respect to time (CNC workshop)
Figure 13. Dust density variation with respect to time (outdoor condition)
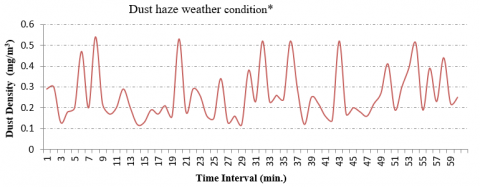
Figure 14. Dust density variation with respect to time (dust haze weather condition) *14th June, 2018 [28]
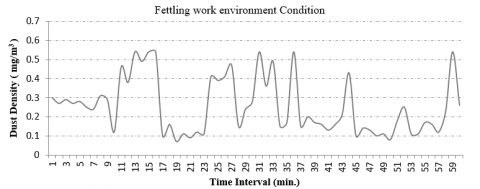
Figure 15. Dust density variation with respect to time (fettling work condition)
The comparison of dust density variations under different conditions is shown in Figure 16. From the results, it was found that the dust density values change significantly under different conditions. For normal indoor condition, the average dust density value is found to be as; arithmetic mean (AM) 0.0340 mg/m3 and geometric mean (GM) 0.0326 mg/m3, which is AM: 0.0421 mg/m3 and GM: 0.0391 mg/m3 under CNC workshop condition (as described in Table 1). For outdoor condition; the average dust density is AM: 0.0671 mg/m3, GM: 0.0650 mg/m3; whereas under dust haze weather condition the average value for dust density is AM: 0.2590 mg/m3, GM: 0.2350 mg/m3 and under fettling work section the average value is AM: 0.2550 mg/m3, GM: 0.2164 mg/m3. Based on these results, it may be concluded that the proposed intervention is sensitive to dust under different operating conditions and could effectively be used for monitoring the dust values in the fettling work environment.
Figure 16. Comparison of dust density variation results for different conditions
Table 1. Hourly-average dust density values (mg/m3) under different conditions
|
Sr. No. |
Condition |
Dust density (mg/m3) |
|
|
AM |
GM |
||
|
1. |
Normal indoor |
0.0340 |
0.0326 |
|
2. |
CNC workshop |
0.0421 |
0.0391 |
|
3. |
Outdoor |
0.0671 |
0.0650 |
|
4. |
Dust haze weather |
0.2590 |
0.2350 |
|
5. |
Fettling work section |
0.2550 |
0.2164 |
|
AM: arithmetic mean; GM: geometric mean |
|||
3.2 Virtual ergonomics
Digital human modelling (user-defined anthropometric population) for foundry workers based on the previous study [18] has been utilized for analysing the proposed booth design models as shown in Figure 17, which were further validated using biomechanics and vision analysis. Biomechanics results (shown in Table 2) yielded the spine compression force values (in newtons (N)) and spine moment (in newton-meters (N-m)) on the fourth lumbar- fifth lumbar (L4-L5) vertebrae, which were found lesser than the recommended limit values (NIOSH action limit value: 3433 N) [29]. Also, vision analysis results (shown in Figure 18) showed appropriate match for the foundry manikin with respect to the fettling booth model, while performing a grinding work task. The vision analysis provided satisfactory match with the designed model, as reported in another study, in which vision analysis was used to validate the design of a multipurpose workstation [30].
Table 2. Biomechanics analysis results at five different population percentiles
|
Sr. No. |
Population percentiles |
L4-L5 spine compression Force (N) |
L4-L5 spine moment (N-m) |
|
1. |
5th percentile |
1353 |
40 |
|
2. |
25th percentile |
1433 |
45 |
|
3. |
50th percentile |
1653 |
55 |
|
4. |
75th percentile |
1790 |
61 |
|
5. |
95th percentile |
2087 |
74 |
Figure 17. Illustration for proposed design intervention
Figure 18. Vision analysis results in CATIAV5R20
In foundry work environment, excessive dust prevalence exhibits a major health hazard, much prone to respiratory health issues among workers. Prolonged exposure to excessive dust concentrations, may cause various lung diseases such as asthma, silicosis, chronic obstructive pulmonary disease (COPD), and even lung cancer. Engineering control design interventions may be considered as an effective and important control measure in reducing the dust exposure levels to desired permissible limits. The study results concluded that the proposed design intervention may effectively be used for monitoring the dust values in the fettling work environment of a foundry. It may be used to control and automate various electric appliances; like exhaust fans, dust collector equipment, etc. based on the permissible dust limit values. The results revealed that the dust density values change significantly under different environmental conditions, which gives a clear indication, that the designed prototype is sensitive to dust under different conditions and may effectively be used for monitoring the dust values in the fettling work environment. The development cost for this prototype is around 24$ USD, which makes it a low cost and effective solution for monitoring the air quality and automation purposes. The proposed dust extraction booth designs may be considered as suggestive engineering control measures; in conjunction with the dust control automation prototype, so as to minimize the respirable dust exposure levels, particularly respirable crystalline silica (RCS), which is very hazardous and leading cause for silicosis.
|
L4-L5 |
fourth lumbar- fifth lumbar vertebrae |
|
NIOSH |
National institute for occupational safety and health |
|
RCS AM |
respirable crystalline silica arithmetic mean |
|
GM |
geometric mean |
|
PM |
particulate matter |
|
LEV |
local exhaust ventilation |
[1] Trice, M.F. (1940). The foundry dust hazard and its control. American Journal of Public Health and the Nations Health, 30(7): 760-765. https://ajph.aphapublications.org/doi/pdfplus/10.2105/AJPH.30.7.760.
[2] Woerfel, P.F., Niven, R.M.L., Cherry, N.M. (1997). Lung function and respiratory symptoms in foundry workers. The Annals of Occupational Hygiene, 41(S1): 363-367. https://www.sciencedirect.com/science/article/abs/pii/S000348789780066X.
[3] Rosenman, K.D., Reilly, M.J., Rice, C., Hertzberg, V., Tseng, C.Y., Anderson, H.A. (1996). Silicosis among foundry workers: Implication for the need to revise the OSHA standard. American Journal of Epidemiology, 144(9): 890-900. https://doi.org/10.1093/oxfordjournals.aje.a009023
[4] Susihono, W., Adiatmika, I.P.G. (2020). Assessment of inhaled dust by workers and suspended dust for pollution control change and ergonomic intervention in metal casting industry: A cross-sectional study. Heliyon, 6(5): e04067. https://doi.org/10.1016/j.heliyon.2020.e04067
[5] Particulate Matter (PM) Basics. http://www.epa.gov/pm-pollution/particulate-matter-pm-basics#effects/, accessed on June 15, 2019.
[6] Warren, N. (2017). Current picture of health risks and exposure to respirable crystalline silica in Great Britain. HSL: HSE’s Health & Safety Laboratory. http://www.hsl.gov.uk/media/1220125/afternoon%20rcs%20master%20v2.pdf/, accessed on April 15, 2020.
[7] Johnston, J.R. (1999). Hazard prevention and control in the work environment: Airborne dust (No. WHO/SDE/OEH/99.14). Protection of the Human Environment Occupational Health and Environmental Health Series, Geneva, 1999, World Health Organization WHO/SDE/OEH/99.14: English only, The Annals of Occupational Hygiene, 44(5): 405. https://doi.org/10.1093/annhyg/44.5.405
[8] Tong, R., Cheng, M., Ma, X., Yang, Y., Liu, Y., Li, J. (2019). Quantitative health risk assessment of inhalation exposure to automobile foundry dust. Environmental Geochemistry and Health, 41(5): 2179-2193. https://doi.org/10.1007/s10653-019-00277-8
[9] Controlling silica exposure during fettling of castings. http://diamondenv.wordpress.com/2011/09/30/controlling-silica-exposure-during-fettling-of-castings/, accessed on April 15, 2020.
[10] Martinelli, K. (2020). What is Respirable Crystalline Silica (RCS) Dust and why is it Dangerous. http://www.highspeedtraining.co.uk/hub/respirable-crystalline-silica-dust/, accessed on July 15, 2020.
[11] Control of exposure to silica dust: A guide for employees. Health and safety executive (HSE). http://www.hse.gov.uk/pubns/indg463.pdf, accessed on April 11, 2020.
[12] Brooks, R. (2014). OSHA Cites Grede for Silica Dust Exposure. http://www.foundrymag.com/molds-cores/article/21928163/osha-cites-grede-for-silica -dust-exposure, accessed on April 11, 2020.
[13] Fettling large castings-Respiratory protective equipment (RPE). COSHH essentials for foundries-Silica. http://www.hse.gov.uk/coshh/essentials/, accessed on April 11, 2020.
[14] Fettling small castings-Engineering control. COSHH essentials for foundries-Silica. http://www.hse.gov.uk/coshh/essentials/, accessed on April 11, 2020.
[15] Gressel, M.G. (1997). An evaluation of a local exhaust ventilation control system for a foundry casting-cleaning operation. American Industrial Hygiene Association Journal, 58(5): 354-358. https://doi.org/10.1080/15428119791012711
[16] Flynn, M.R., Susi, P. (2003). Engineering controls for selected silica and dust exposures in the construction industry--a review. Applied Occupational and Environmental Hygiene, 18(4): 268-277. https://doi.org/10.1080/10473220301406
[17] Hussin, N.B., Ibrahim, D.B., Ahmad, F.N.B., Yahya, N.H.B.M., Hashim, S.M.B. (2015). Improving indoor air quality using local exhaust ventilation (LEV). Jurnal Teknologi, 76(6). https://doi.org/10.11113/jt.v76.5665
[18] Sharma, M., Kataria, K.K., Kant, S., Suri, N.M. (2020). Ergonomic assessment of a fettling operation in foundry based on digital human modeling and statistical analysis. In Optimization Methods in Engineering, 481-502. https://doi.org/10.1007/978-981-15-4550-4_30
[19] Alam, M. S., Muthiah, A., Salve, U.R. (2019). Thermal comfort of the kitchen in pantry cars on Indian railways. Instrumentation Mesure Métrologie, 18(5): 465-477. https://doi.org/10.18280/i2m.180506
[20] Alam, M.S., Muthiah, A., Salve, U.R. (2020). Appraisal of thermal comfort in non-air-conditioned and air-conditioned railway pantry car kitchens. International Journal of Integrated Engineering, 12(8): 318-327.
https://publisher.uthm.edu.my/ojs/index.php/ijie/article/view/5071.
[21] Alam, M.S., Muthiah, A., Salve, U.R. (2020). Thermal comfort study in Indian railway pantry cars kitchen. Instrumentation Mesure Métrologie, 19(4): 289-295. https://doi.org/10.18280/i2m.190406
[22] Arduino Uno Rev3. http://store.arduino.cc/usa/arduino-uno-rev3, accessed on Jan. 26, 2019.
[23] GP2Y1010AU0F-Compact Optical Dust Sensor datasheet. http://www.sparkfun.com/datasheets/Sensors/gp2y1010au_e.pdf, accessed on Feb. 11, 2018.
[24] Application note of Sharp dust sensor GP2Y1010AU0F. http://global.sharp/products/device/lineup/data/pdf/datasheet/gp2y1010au_appl_e.pdf, accessed on Feb. 12, 2018.
[25] Nafis, C. (2012). Air Quality Monitoring. http://www.howmuchsnow.com/arduino/airquality/, accessed on June 11, 2018.
[26] Sousan, S., Koehler, K., Thomas, G., Park, J.H., Hillman, M., Halterman, A., Peters, T.M. (2016). Inter-comparison of low-cost sensors for measuring the mass concentration of occupational aerosols. Aerosol Science and Technology, 50(5): 462-473. https://doi.org/10.1080/ 02786826.2016.1162901
[27] Wang, Y., Li, J., Jing, H., Zhang, Q., Jiang, J., Biswas, P. (2015). Laboratory evaluation and calibration of three low-cost particle sensors for particulate matter measurement. Aerosol Science and Technology, 49(11): 1063-1077. https://doi.org/10.1080/02786826.2015.1100710
[28] Singh, R. Mufti, I. (2018). News article. Hindustan Times-Chandigarh. Dusty haze grounds all 33 flights expected to clear after rain today. http://www.hindustantimes.com/punjab/chandigarh-dusty-haze-grounds-all-33-flights-expected-to-clear-after-rain-today/story-eLLpgdEOg3cPNymiexrBEK.html, accessed on July 20, 2020.
[29] Waters, T.R., Putz-Anderson, V., Garg, A., Fine, L.J. (1993). Revised NIOSH equation for the design and evaluation of manual lifting tasks. Ergonomics, 36(7): 749-776. https://doi.org/10.1080/00140139308967940
[30] Jadhav, G.S., Arunachalam, M., Salve, U.R. (2020). Ergonomics and efficient workplace design for hand-sewn footwear artisans in Kolhapur, India. Work, 66(4): 849-860. https://doi.org/10.3233/WOR-203230