Bruno Martins* | Adélia Nunes | Miguel Sousa
© 2022 IIETA. This article is published by IIETA and is licensed under the CC BY 4.0 license (http://creativecommons.org/licenses/by/4.0/).
OPEN ACCESS
Porto region (PR) is located on the northern coast of Portugal characterised by a complex set of risks occurrence. With the purpose of understanding what factors determine risk perception, a questionnaire entitled “Risk Perception in PR” was applied to 244 subjects. Analysis of variance (ANOVA) was performed. The results indicated that certain socio-demographic characteristics of the respondents’ education and age correlated with risk perception. The study also shows statistical differences between the groups in relation to how the risk is communicated. These findings can help decision makers to improve effective risk communication policies and risk reduction strategies.
risk perception, risk communication, Porto region (PR), Portugal
Modern cities developed in the wake of the upheaval of the industrial revolution and the economic, social, technological and political changes that took place from the mid-eighteenth century until the middle of the following century [1]. Currently, cities are seen as centres par excellence for incubating progressive ideas, designs and new formulations for products and services. They are also connecting points for global networks, where the economy can find resources and partners that link them to new markets. Associated with the growth of the urban population over recent decades, a series of sprawling urban households and conurbations have appeared. Sometimes much larger and with a larger population than the original cities, they are recognised in the term "metropolitan area", which very often exceeds their administrative limits.
Cities are generally regarded as areas of greater risk, basically because they have the potential for suffering greater damage. This includes potential victims (including deaths and injuries, with different levels of severity), displaced people and people suffering psychological harm. Economic, material, environmental, and functional damage are likely to be more severe since they are estimated in monetary sums or strategic values, according to the various elements exposed to risk. Such sums and values will correspond to the market cost of their recovery/restoration which must take into account not only the nature and features of the damaged element, but other factors, too, that could influence this cost, such as other direct and indirect economic losses that result from the cessation of operability, activity or work [2].
Interest in the study of risks has mainly grown since the second half of the 1950s, partly because of the increase in disasters but also thanks to higher economic and social costs generated not only by human and economic losses, but also by the recovery and reconstruction of the affected areas [3]. At the same time, the growing importance of analysing the behaviour of communities in relation to risk is acknowledged. In this regard, in addition to the elements present in the risk areas (people and their assets and possessions) that are subject to possible loss, it is also important to consider the level and extent of the damage that these exposed elements could suffer. Such damage would be associated with their intrinsic characteristics and their degree of protection, as well as the ability to both anticipate and respond to risk [4]. The idea of population involvement in risk management is consequently reinforced [5], going beyond a view that sees crises as merely technical issues and ignoring the importance of community involvement, in particular how the public perceives them [6]. Perception thus plays a major part in motivating individuals to take action to avoid, mitigate, adapt to, or even ignore risks [7]. According to Wachinger et al. [7] risk perception is the process of collecting, selecting, and interpreting signals about the uncertain impacts of events and it involves multiple influencing factors in a very complex framework [8]. But risk perception depends on an individual’s subjective judgement and evaluation of a specific risk [9] which can be perceived as potentially dangerous by one person, whilst it may be considered safe by someone else. Risk management, then, is the modulated mental models and the psychological mechanisms that people use when they judge, evaluate, tolerate, and react to risks [10]. Furthermore, it is how individuals and communities perceive the complex and varied factors which interfere in risk perception. These certainly include social media and capital, media influence, personal experience, values, worldviews, and the influence of individual adaptation strategy through learning from past events and education [11-13]. We can thus say that risk communication is a social process by which people become informed about hazards, are influenced towards behavioural change and can participate in decision making about risk issues in an informed manner [14, 15]. According to Covello [16], risk communication is a two-way process between the communicator(s) and the recipients of the messages in a process of exchanging information among interested parties about the nature, magnitude, significance, or control of a risk. Other definitions emphasize the importance of risk management [17], the need for dialogue between communicators and stakeholders [18], and the necessity of ongoing risk monitoring [19]. Other authors have emphasized the emergency management efforts [20] and the crisis and emergency risk communication [21], where supports pre-crisis communication is classified as a method to increase the effectiveness of the response stages and reduce harm in the resolution stages [22]. In this context, pre-crisis communication is directed to the public and response community to provide risk messages, warning, and guidance regarding preparation. Strategies include building alliances, developing consensus recommendations, and testing messages with specific publics [23]. Effective risk communication requires understanding where the public is coming from in order to convince them to prepare better for risks. Mental models provide a framework to understand pre-existing public perceptions of less-familiar and higher-dread risks and what communication messages, and the way of disseminations, can be developed and tested to improve awareness, understanding, and preparedness [24, 25].
This work sets out to identify the main risks, perceived as most important because they are present in the Porto region (PR), and to identify the relationships between the factors that generally influence this perception, especially the socio-economic and demographic characteristics of the population (sex, age, education, income). It is also intended to understand how people living in the PR perceive the support of public entities in crisis situations, which bodies are responsible for pre-crisis communication, and the most effective way to disseminate risk messages in crisis situation. It is assumed that knowledge and understanding of these factors will help to inform decision makers better with respect to the type of variables they should consider when conceptualising risk communication strategies, to make them more efficient by including them in plans and preventive measures to combat and mitigate natural risks.
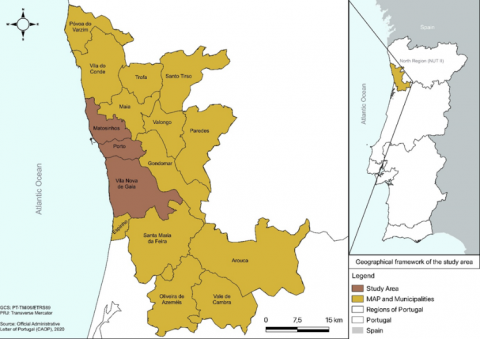
The municipalities of Matosinhos, Porto and Vila Nova de Gaia are part of the Metropolitan Area of Porto (MAP), a region on the northern coast of Portugal. Together, these three municipalities cover a total area of 271 km2, which represents approximately 13% of the total area of the MAP. In terms of population, the three municipalities have even greater importance, with 715,367 inhabitants, which amounts to 42% of the total population of the MAP (Figure 1) [26, 27].
In terms of economic activity, the tertiary sector predominates in the study, although in some points of Vila Nova de Gaia and Matosinhos there are also industrial areas, with emphasis on the petrochemical industry in Matosinhos, although recently deactivated. As regards the morphology of the terrain, the area in question is heterogeneous, the gentle slopes of the coastal area contrasting with the interior of the municipalities. However, it is in Vila Nova de Gaia that the differences in morphology are particularly obvious, with steep slopes in some parts, especially in the area near the River Douro. For all these contrasts, the area under study is characterised by a complex spectrum of collective risks. The various emergency planning and risk analysis documents, such as the National Risk Assessment of the National Authority for Emergency and Civil Protection or the municipal civil protection emergency plans confirm exactly this premise. Coastal phenomena, such as overtopping waves, have also more often in recent years, notably in Matosinhos and Vila Nova de Gaia [28]. In the context of natural hazards, Vila Nova de Gaia has also suffered some episodes of land movement linked to heavy rainfall and the steep slopes in the locality [28].
Figure 1. Porto region localization
There is also periodic flooding in the Douro area, particularly affecting the municipalities of Vila Nova de Gaia and Porto. Since there is a very significant human presence, technological risks are also much in evidence, including road, rail, sea, river, or air travel accidents which may or may not involve hazardous materials. The risks inherent to hazardous materials are very significant as the PR covers several Seveso industries, mainly in the municipality of Matosinhos, along with several industries that handle or store materials of this nature. Finally, the risk of urban and industrial fire is also very significant in all of the municipalities under analysis, mainly because of the high population density in these locations [29].
3.1 Questionnaire design
The questionnaire entitled Perception of risks and communication in the Porto Region (PR) was randomly applied to 248 residents in the PR in April and May 2020. Online surveys are an instrumental methodology widely used in the study of risk perception [29]. From the total, 244 questionnaires were validated. According to the Survey system sample size calculator (https://www.surveysystem.com/sscalc.htm), for a resident population of about 700 000 inhabitants, the confidence interval obtained was 6.27 (a confidence level higher than 90%). Several authors [30] also consider the need for quantitative structuring of the results observed on the ground, to define and systematise response structures and patterns. Keeping the proposed objectives in mind, the questionnaire is disimproved into five parts (Figure 2).
Figure 2. Components of the perception of risks and communication in the PR questionnaire
The PR covers several Seveso industries, mainly in the municipality of Matosinhos, along with several industries that handle or store materials of this nature. Finally, the risk of urban and industrial fire is also very significant in all of the municipalities under analysis, mainly because of the high population density in these locations. In the first, “Subjects’ Characterisation Data”, information about the sex, age, academic education, and income" of the respondents is considered. In the second part respondent’s population was asked to evaluate the risk, for 13 different typologies, considering the harmful consequences probability, or expected losses (deaths, injuries, property, livelihoods, economic activity disrupted or environment damaged) resulting from interactions between natural or human induced hazards and vulnerable conditions”.
They were classified using a qualitative scale, ranging from zero/minimum to maximum on a scale of 1 to 5 where: 1 - zero/minimum; 2 - low; 3 - moderate; 4 - high; 5 – maximum. The third part, called “Risk communication”, was intended to identify which bodies are responsible for risk communication. Four bodies were considered (central government, municipal councils, Portuguese Environment Agency, and civil defence authority). In keeping with the second part of the questionnaire, these had to be classified using a qualitative scale, ranging from “not responsible” to “very responsible” on a scale of 1 to 5 where: 1 - not responsible; 2 - not very responsible; 3 - responsible; 4 - quite responsible; 5 - very responsible.
The fourth part entitled “Forms of warning in crisis situation” was intended to analyse what respondents considered to be the most effective way of warning people in crisis situations. They were classified using a qualitative scale, ranging from "not at all effective" to "very effective" on a scale of 1 to 5 where: 1 - not at all effective; 2 - not very effective; 3 - effective; 4 - quite effective; 5 - very effective, the forms being short message service (SMS), megaphone around the streets, radios, and sirens.
Finally, the fifth part, entitled “Support from government entities in the event of crisis”, considered the support from municipal councils, central government, civil defence authority, and insurance companies, which the respondents had to classify using a qualitative scale, ranging from “no support at all” to “a great deal of support” on a scale of 1 to 5 in which: 1 - no support at al.; 2 - not much support; 3 - supported; 4 - quite a lot of support; 5 - a great deal of support.
The questionnaires were applied online with the collaboration of some Universities, City Councils and Schools, through the respective social networks (Facebook and WhatsApp), since they were applied during the month of March 2020, in a pandemic situation and with a declared state of emergency in Portugal. Due to these constraints, it is expected that certain population groups were not covered in a representative way.
Cronbach's α test was applied to measure the internal reliability (consistency) of the multiple Likert scale for the different items used in the survey [31]. Internal consistency describes the extent to which all the items in a test measure the same concept or construct, and so it is connected to the inter‐relatedness of the items within the test [32]. Cronbach's α reliability coefficient ranges from 0 to 1. The closer Cronbach's α coefficient is to 1.0, the greater the internal consistency of the items on the scale. The α coefficient obtained for the 21 analysed items is 0.886, suggesting that the data have a high internal consistency.
3.2 Statistical analysis
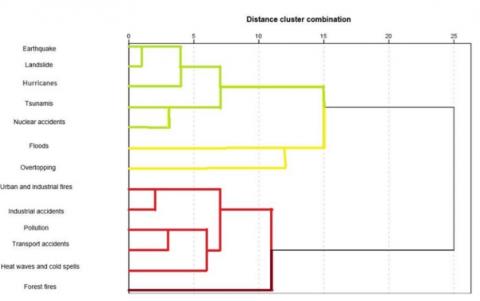
Next, to detect homogenous groups in the collected data, the cluster analysis approach was used, in other words, a multivariate approach. Indeed, hierarchical cluster analysis is one of the methods used to measure the hierarchy of the proximity between objects, which in this case are risks. The average linkage technique was used to achieve this. Some of the characteristics of this method are lower sensitivity to noise than shown by nearest-neighbour chain methods, and complete-linkage clusterings, presentation of good results for Euclidean distances and other distances, and a tendency to form groups with a number of similar elements. The dendrogram is thus the diagrammatic representation of the proximity matrix among samples, given that it organises the risks according to their similarity or dissimilarity, as perceived by the respondents.
Various statistical methods were used to estimate the impact of particular factors on risk perception. In most cases they included correlation analysis [33], independent samples t-tests [34], one-way analysis of variance ANOVA [35]. Quantitative statistics were primarily used to describe and summarise the features of the socio-demographic characteristics of the respondents (age, gender, education, and income). Analysis of variance (ANOVA) was then performed to examine the mean ranks of two or more independent variables with the null hypothesis of equality. Analysis of variance (ANOVA) was then used to identify whether or not there were any statistically significant differences between the impact factors on risk perception.
4.1 Characteristics of the respondents
The study sample consisted of 244 individuals living in 3 municipalities that are part of PR, Porto, Matosinhos and Vila Nova de Gaia. Of these, 54.6% are male and 45.4% female. Regarding the age range of the respondents, 39.1% are aged between 18 and 35 years, followed by 24.6% who are aged between 36 and 50 years, and 21.1% aged between 0 and 18 years old. Finally, individuals over the age of 51 represent only 15.3%, and are the least representative of the sample. Most of the individuals who make up the sample (40.1%) have a higher education. In the rest of the sample, 24.1% of the respondents were found to have a basic level of education (up to the 9th year of schooling) and 35.8% had secondary education (up to the 12th year of schooling).
4.2 Public risk perception
The systematisation of the qualitative and quantitative distribution of the probability of manifestation of the different risks perceived by residents in the Porto region (PR) made it possible to draw various conclusions. In general, the perception of respondents with respect to the spatial dimension of risks, in terms of their probability of occurrence, fluctuated between low and moderate, for around 67% of the respondents. In general, anthropogenic and mixed risks are more perceived than natural risks.
Geophysical risks are notable for the minimal to low likelihood of occurrence. Such risks include the risk of tsunamis and earthquakes. In addition to these risks, the risks of overtopping, storms, and mass movements are also considered low (Figure 3). The risk of nuclear accident is perceived to be zero or very low. With a dominant classification in the class of moderate manifestation, we have the risk of floods, heat and cold waves. Finally, in the high category, the risks of forest fire, urban and industrial fires, industrial accidents, accidents associated with different modes of transport and, finally, the risk of pollution were considered.
In line with these results, the results derived from the kurtosis value for the different risks, suggest a platykurtic distribution for the risks of overtopping (b2 = -1.335), forest fires (b2 = -1.049), industrial accidents (b2 = -0.737) and flood risk (b2 = -0.536). However, those whose distribution is closer to normal are the risks of nuclear accidents (b2 = 2.482, tsunamis (b2 = 0.635) and earthquakes (b2 = 0.239).
The application of hierarchical cluster analysis identified two groups of risks. The first includes the risks of urban and industrial fires, industrial accidents, pollution, accidents associated with different modes of transport, heat and cold waves, floods and forest fires. This last appears on its own in a subgroup. The second cluster includes the lowest perceived risks, in terms of their manifestation, and the other risks, divided into two subgroups. The first includes earthquake risk, mass movements, storms, tsunamis, and nuclear accidents. In the second only include the risk of overtopping (Figure 4).
One-way ANOVA analysis was performed to assess the various perceptions associated with the different groups analysed. We chose not to consider income as it is highly related to education (r: - 0.765). The results suggest that age and education establish statistically significant relationships with the perception of risk. For the age variable, 11 risks were identified with a statistically significant relationship (p<0.05) and 10 risks for education (Table 1).
Figure 3. Perception of risks likelihood in the PR (1 - zero/minimum; 2 - low; 3 - moderate; 4 - high; 5-maximum)
Figure 4. Perception of risks likelihood in the PR (1 - zero/minimum; 2 - low; 3 - moderate; 4 - high; 5-maximum)
Table 1. ANOVA tests for Risk Perception against age and education factors
|
|
Education |
Age |
|
|
sig |
sig |
|
Earthquakes |
0.001 |
0.000 |
|
Tsunamis |
0.099 |
0.256 |
|
Landslides |
0.000 |
0.000 |
|
Overtopping |
0.000 |
0.008 |
|
Heat and cold waves |
0.538 |
0.178 |
|
Storms |
0.000 |
0.000 |
|
Floods |
0.000 |
0.000 |
|
Forest fires |
0.000 |
0.017 |
|
Urban and industrial fires |
0.000 |
0.000 |
|
Pollution |
0.000 |
0.003 |
|
Nuclear accidents |
0.081 |
0.000 |
|
Industrial accidents |
0.000 |
0.000 |
|
Transportation accidents |
0.000 |
0.000 |
Note: The bold numbers indicate statistically significant differences between groups (p-value < 0.05); n= 244
In general, the older population tends to perceive the risks as higher, depending on their manifestation, and so do the respondents with higher academic education.
Considering gender, the average results showed that there were no significant differences in the perception of risk, for both Levene’s test for equality of variances and for the t-test for equality of means. This is because the statistically significant values (p<0.05) were only obtained, apart from the risk of storms (t-test for Equality of Means), for the earthquake risk, floods, and nuclear accidents (Levene's Test for Equality of Variances). The comparison of the average score obtained for men and women was very close, 1.79 for women and 1.88 for men (Table 2). Results also indicate that there are variations in relation to the different risks analysed. For example, taking the risks where there were statistically significant differences, with regard to earthquake risk, man have a higher perception than women, 1.41 and 1.06, respectively. The same was true of the risk of floods, 2.66 and 1.88, and the risk of nuclear accidents, 0.56 and 0.39. However, regarding the risk of storms, the perception is the opposite, with men recording a value of 0.98 and women 1.32.
4.3 Public perception of risk regarding the form and support in crisis situations
To assess people's perception of the bodies responsible for triggering actions to warn the community, the following organisations were considered: civil defence authority, the central government, the municipal councils, firefighters, and the Portuguese Environment Agency (APA). The highest average values were obtained by the civil defence authority (3.61), followed by municipal councils (2.95) and firefighters (2.81). The lowest figures were obtained by the APA (2.71) and the central government (2.36). Table 3 shows the statistically significant differences based on the variables, age, academic education, and gender (p<0.05), by applying the ANOVA test.
Table 2. Mean, Levene’s and t-test for risk perception
|
|
Mean |
t-test for Equality of Means |
Levene's Test for Equality of Variances |
||
|
|
Female |
Male |
difference between averages |
Sig. (2-tailed) |
sig |
|
Earthquakes |
1.06 |
1.41 |
-0.35 |
0.024 |
0.000 |
|
Tsunamis |
0.77 |
0.81 |
-0.04 |
0.767 |
0.010 |
|
Landslides |
1.36 |
1.61 |
-0.25 |
0.154 |
0.046 |
|
Overtopping |
1.48 |
1.33 |
0.15 |
0.540 |
0.729 |
|
Heat and cold waves |
2.40 |
2.30 |
0.10 |
0.433 |
0.150 |
|
Storms |
1.32 |
0.98 |
0.34 |
0.042 |
0.250 |
|
Floods |
1.88 |
2.16 |
-0.28 |
0.159 |
0.006 |
|
Forest fires |
2.17 |
2.45 |
-0.28 |
0.207 |
0.201 |
|
Urban and industrial fires |
2.58 |
2.44 |
0.14 |
0.437 |
0.142 |
|
Pollution |
2.86 |
3.13 |
-0.27 |
0.044 |
0.051 |
|
Nuclear accidents |
0.39 |
0.56 |
-0.17 |
0.186 |
0.004 |
|
Industrial accidents |
2.13 |
2.22 |
-0.09 |
0.437 |
0.132 |
|
Transport accidents |
2.92 |
3.02 |
-0.10 |
0.561 |
0.483 |
|
Average |
1.79 |
1.188 |
-0.01 |
|
|
Note: The bold numbers indicate statistically significant differences between groups (p-value < 0.05); n= 244
Age and education establish a statistically significant relationship with the municipal council, the civil defence authority, and APA, pointing out that older respondents, with more academic training, are those who believe that these are the bodies responsible for notifying the population in a context of crisis. With regard to gender, statistically significant relationships (p<0.05) with the firefighters are identified, with the average value being higher in women (3.16) than in men (2.52), the reverse is found for the civil defence authority, with average values of 3.77 and 3.42, respectively for men and women. In a pre-crisis situation, the results suggest that communities feel slightly or moderately supported, and that the greatest support will come from the civil defence authority and the municipal councils that the greatest. There are statistically significant correlations (p<0.05) between age, the municipal councils, government, and insurance companies, suggesting that younger people have the least confidence, especially when it comes to support from the government (Table 4). Indeed, it is the most highly qualified respondents who have the greatest confidence in these bodies, as identified by applying the ANOVA test which yielded statistically significant correlations (p<0.05) with the municipalities, government and insurance companies.
The application of the t-test for Equality of Means did not show a statistically significant correlation (p<0.05) with gender. By applying Levene's Test for Equality of Variances, a statistically significant correlation (p<0.009) with the civil defence authority was obtained, suggesting that men have more confidence in the support of this body than women do (Table 5). In a potential event of a crisis, SMS is the form of communication preferred by respondents, especially the younger and highly qualified ones, followed by radio stations, sirens, and then megaphones. By applying the ANOVA test, a statistically significant correlation was obtained between age and the use of SMS (p = 0.000), suggesting that, although this is the preferred form of warning for respondents in general, it is not favored by people aged over 50 years. This latter age group prefers to be notified by radio announcements.
Table 3. ANOVA tests for bodies responsible for warning people against age, education, and gender factors
|
|
Age |
Education |
Gender |
|
|
sig |
sig |
sig |
|
Firefighters |
0.033 |
0.221 |
0.001 |
|
Civil Defence |
0.000 |
0.000 |
0.018 |
|
APA |
0.000 |
0.000 |
0.839 |
|
Municipal Council |
0.000 |
0.000 |
0.555 |
|
Government |
0.235 |
0.290 |
0.230 |
Note: The bold numbers indicate statistically significant differences between groups (p-value < 0.05); n= 244
Table 4. Mean, kurtosis, Levene’s and t-test for bodies responsible for warning people against age, education, and gender factors
|
|
|
|
|
|
Gender |
|
|
|
Mean |
Kurtosis |
Age |
Education |
t-test for Equality of Means |
Levene's Test for Equality of Variance |
|
Civil Defence |
2.89 |
-0.755 |
0.157 |
0.523 |
0.021 |
0.009 |
|
Municipal Council |
2.48 |
-1.179 |
0.000 |
0.000 |
0.181 |
0.225 |
|
Government |
1.65 |
-0.830 |
0.001 |
0.008 |
0.617 |
0.931 |
|
Insurers |
1.75 |
-0.808 |
0.000 |
0.006 |
0.736 |
0.878 |
Note: The bold numbers indicate statistically significant differences between groups (p-value < 0.05); n= 244
Table 5. Mean, kurtosis, Levene’s and t-test for forms of warning in crisis situation against age, education, and gender factors
|
|
|
|
|
|
Gender |
|
|
|
Mean |
Kurtosis |
Age |
Education |
t-test for Equality of Means |
Levene's Test for Equality of Variance |
|
SMS |
3.19 |
-0.485 |
0.000 |
0.000 |
0.815 |
0.936 |
|
Radio stations |
2.20 |
-0.789 |
0.836 |
0.527 |
0.823 |
0.156 |
|
Sirens |
1.84 |
-0.929 |
0.000 |
0.000 |
0.956 |
0.058 |
|
Megaphones |
1.54 |
-0.203 |
0.005 |
0.005 |
0.000 |
0.019 |
Note: The bold numbers indicate statistically significant differences between groups (p-value < 0.05); n= 244
Anthropogenic and mixed risks are the most perceived risks for the PR, especially the risk of pollution, industrial accidents, and transport accidents in general. The risk of heat and cold waves is the most perceived of the natural risks. The fact that it is an urban area may justify this perception, given that respondents have greater contact with the manifestation of this type of risks. In fact, the rapid expansion of cities to accommodate the population growth, combined with inappropriate land use planning, increased the exposure of people and economic assets to hazards. Disaster risks in urban areas resulting in a process of “risk accumulation” where risk is amplified by human activities. Nevertheless, urban areas can also provide opportunities for reducing risks. Cities are usually the economic drivers within their countries and the centres of intellectual, political, business and financial activities. Urban centers typically have people with comparatively higher levels of education in better informed communities and more powerful local response capacity.
In this sense, a number of authors consider socio-demographic characteristics as important factors in perception in studies on risk perception, including age, gender, educational level, and income [9, 36]. Some studies suggest, especially in urban areas, that the most disadvantaged population, both from an economic and housing point of view, tends to increase the perception of risk and take fewer preventive actions [37]. In our study, regarding the level of education, respondents with higher education show a better perception of risk than respondents with a lower educational level.
Some authors suggest that people who have been educated to a higher level tend to acquire and understand new information more easily, which can somehow influence knowledge about potentially dangerous processes and thus increase sensitivity to issues related to safety and risk perception [13, 38]. They also tend to be more aware of the mitigation actions taken by governments and local experts, and thus enhance the internalisation of their actions, increasing the degree of control over the different risks [39]. Although significant statistical correlations between the level of education and the perception of risk were found in this work, other studies did not find any correlation, not even a negative one, between the perception of risk and the level of education [40]. This somehow confirms the idea that there is a significant complexity associated with perception, and a need to develop more work in different socio-economic and cultural contexts, with the inclusion of more analysis variables. On the other hand, emotions play a very important role in how the population perceives risks, and naturally how they evaluate their safety. Such situation is clearly observable in risk perception studies in urban areas where technological risks are perceived as high conditioned by fear or alarm [41]. The conceptualization of the perception and acceptance of risk are a complex process influenced not only by the objective nature of a risky technology but also by various underlying social and psychological factors of individuals in interaction with communication processes [42]. The presence of industrial complexes considered potentially dangerous by the media and local public opinion, not only as pollutant emitters, but also associated with the risk of explosion in the study area, such as the Matosinhos refinery, for example, may influence the perception of risks, advocating industrial risks as higher than the others.
Gender has been suggested as a factor strongly related to perception and attitudes towards risk, with several studies suggesting that, on average, men have lower levels of perception than women, especially in works that focused on the risk of flooding [43]. However, in relation to this factor, other studies report opposite results [44], which may be related to the different roles of women in society, which vary with the socio-cultural context, and which may influence perception. In certain societies, women are perceived as being physically more vulnerable [45], which may justify responses that are more targeted to a greater concern for health and the family [46]. Regarding technological risks, several studies point out that women perceive more risk than men, especially younger and more educated ones [47].
Our study found few statistically significant correlations between gender and the perception of risk, even though they suggest a greater perception by women. These results may be related to the urban context to which the sample belongs, which is characterised by a socio-cultural context that tends to mitigate gender differences as opposed to what happens in more traditional socio-cultural contexts [48]. The results of this work also suggest that people (regardless of age, gender and education) feel more supported by the municipal councils and civil defence authorities in a crisis situation than by the central government, and even less by insurance companies. These results are in agreement of several works showing that population have greater trust in regional/municipal institutions compared to national bodies [13].
In fact, the need to establish trust with the public is fundamental to the effectiveness of pre-crisis communication messages and strategies [49]. Moreover, it may possibly be that more effective risk communication, based on an appropriate socio-cultural context could alleviate this distrust. In fact, these are still the institutions, together with the APA, to which the respondents ascribe greater responsibility in pre-crisis communicating, reinforcing the idea of a devaluation in relation to the role of the central government in risk management. This conclusion is even more clearly discernible in the younger age group. If we also consider that this is the age group with the lowest perception of risk, the results can be seen to justify the importance of the role of school and education as a risk mitigation factor, which reinforces the relevance, for example, of including this topic in the teaching curriculums [13, 39].
Warning the local community via SMS, in a crisis situation, is the option preferred by the surveyed sample. However, the results suggest that the majority of the older population would rather be warned by radio station announcements. The effectiveness of risk communication must thus consider, in addition to the socio-cultural context, the specific characteristics of the population, particularly certain factors such as age, gender and education These results are in agreement with the findings of Ellen et al. [50], in which plurality in communication, which means communicating using the language of the different perspectives, is therefore very important. A range of communication tools that use different approaches, SMS, Facebook, twitter, as well as traditional media (radio, TV) will help to reach the different stakeholders and to integrate them into the decision-making process, thereby increasing support for decisions taken. On the other hand, the risk communication over time leads to improved risk perception. In this way, provision of risk information can significantly benefit the change of risk perceptions, with subsequent changes of the impacts of risk perceptions on risk behaviours [50]. Any population exposed to hazards natural ones such as earthquakes, storms, wildfires or floods; or technological ones, such as explosions, chemical spills, train crashes and so on wants and needs to be optimally informed about risk characteristics, preventative measures, and appropriate behaviours during emergencies. Authorities have to draft sensible planning, prepare coping strategies and communicate the relevant information effectively to residents, people in their workplaces, and communities as a whole. The more disaster management requires active the involvement of residents, the more vital risk information/ communication/education become. Furthermore, in the case of controversial risk sources (e.g., the positioning of an airport or a waste incineration facility), public discussion, participation of stakeholders and possibly joint conflict resolution are required. All these situations involve social processes which are usually subsumed under the (umbrella) term "risk communication", and the exchange of risk information between interested parties (individuals, groups, institutions) is at its very core [15, 25]. Evidently risk communication is the indispensable link between risk perception and risk management. Given the high relevance of effective disaster preparedness, risk communication programmes need to be based on a sound understanding of the underlying sociopsychological processes and preconditions for successful communication.
In the PR, mixed and technological risks are the most perceived, according to the probability of occurrence and the damage caused. In general, the population has more confidence in local institutions, in particular the civil protection and municipal councils, and the preferred technological means for risk communication are SMS messages.
In our study, although some factors such as academic education and age were considered very important in the perception of risk, the approach to this type of work should also placing the context of risk within social and cultural narratives. This idea is reinforced when analysing various studies that point to different, sometimes even contradictory, conclusions. A more holistic analysis, covering contextual factors such as culture, religion, history, and political contexts should be considered. More work will be needed covering, on the one hand, more variables considered, and on the other, different socio-cultural contexts. The concepts of vulnerability, responsiveness and resilience should also be examined in an integrated model of risk perception and risk reduction strategies in order to reduce the ambiguity and complexity of risk perception.
However, we believe that the results presented here can improve the development of national and local risk management strategies, as well as in a more effective and targeted management of risk communication, which necessarily involves the complexity of perceptions of individual/cultural risks. Defining clear strategies in risk behaviour by citizens is a priority in risk management plans.
If one of the conclusions drawn from this study is related to the importance of education in the perception of risks, the role of education and school, in particular, seems to be very important for a better perception of risk, and therefore for the effectiveness of protective measures. It seems appropriate to create educational curriculums on risk(s), which could be implemented through training sessions, presentations at public functions, information leaflets, and other sources of communication. The emphasis should be on understanding the causes and possible consequences of different risks, on raising awareness about warning signs, and on informing the public about available tools and data. Local risk perception is, thus, important to inform experts about the specifics of the risk situation, suggesting a dialogue between experts and lay publics in order to improve the relevance and quality of science for policy.
This research received support from the Centre of Studies in Geography and Spatial Planning (CEGOT), funded by national funds through the Foundation for Science and Technology (FCT) under the reference UIDB/04084/2020.
[1] Chamie, J. (2004). World Urbanization Prospects, United Nations. http://10.6.20.12:80/handle/123456789/56806
[2] Julião, R., Nery, F., Ribeiro, J.L., Branco, M., Zêzere, J. (2009). Methodological guide for the production of municipal risk cartography and for the creation of municipal geographical information systems. http://hdl.handle.net/10451/39562.
[3] White, G. (1958). Changes in the Urban Occupance of Flood Plains in the United States. Department of Geography Research, Paper No. 57, Chicago: University of Chicago Press.
[4] Becker, G., Aerts, J., Huitema, D. (2014). Influence of flood risk perception and other factors on risk‐reducing behaviour: A survey of municipalities along the Rhine. Journal of Flood Risk Management, 7(1): 16-30. https://doi.org/10.1111/jfr3.12025
[5] Ardaya, A., Evers, M., Ribbe, L. (2017). What influences disaster risk perception? Intervention measures, flood and landslide risk perception of the population living in flood risk areas in Rio de Janeiro state, Brazil. International Journal of Disaster Risk Reduction, 25: 227-237. https://doi.org/10.1016/j.ijdrr.2017.09.006
[6] Birkholz, S., Muro M., Jeffrey P., Smith, H. (2014). Rethinking the relationship between flood risk perception and flood management. The Science of the Total Environment, 478: 12-20. https://doi.org/10.1016/j.scitotenv.2014.01.061
[7] Wachinger, G., Renn, O., Begg, C., Kuhlicke, C. (2013). The risk perception paradox – implications for governance and communication of natural hazards. Risk Analysis, 33(6): p.1049-1065. https://doi.org/10.1111/j.1539-6924.2012.01942.x
[8] Fuchs, S., Karagiorgos, K., Kitikidou, K., Maris, F., Paparrizos, S., Thaler, T. (2017). Flood risk perception and adaptation capacity: A contribution to the socio-hydrology debate, Hydrol. Earth Syst. Sci., 21(6): 3183-3198, https://doi.org/10.5194/hess-21-3183-2017
[9] Salvati, P., Bianchi, C., Fiorucci, F., Giostrella, P., Marchesini, I., Guzzetti, F. (2014). Perception of flood and landslide risk in Italy: A preliminary analysis, Nat. Hazards Earth Syst. Sci., 14(9): 2589-2603. https://doi.org/10.5194/nhess-14-2589-2014
[10] Morgan, M., Fischhoff, B., Bostrom, A. (2001). Risk Communication: The Mental Models Approach. Cambridge University Press, New York.
[11] Mcleman, R., Smit, B. (2016). Vulnerability to climate change hazards and risks: Crop and flood insurance. Canadian Geographer / Le Géographe canadien, 50(2): 217-226. https://doi.org/10.1111/j.0008-3658.2006.00136.x
[12] Walshe, R., Chang Seng, D., Bumpus, A., Auffray, J. (2018). Perceptions of adaptation, resilience and climate knowledge in the Pacific: The cases of Samoa, Fiji and Vanuatu. International Journal of Climate Change Strategies and Management, 10(2): 303-322. https://doi.org/10.1108/IJCCSM-03-2017-0060
[13] Martins, B., Nunes, A. (2020). Exploring flash flood risk perception using Categorical Principal Component Analysis. The case of Mindelo, S. Vicente (Cape Verde). The Geographical Journal, 186(4): 375-389. https://doi.org/10.1111/geoj.12357
[14] Buratti, S., Allwood, C. (2019). The effect of knowledge and ignorance assessments on perceived risk. J. Risk Res., 22(6): 735-748. https://doi.org/10.1080/13669877.2018.1459795
[15] Heydari, S.T., Zarei, L., Sadati, A.K. (2021). The effect of risk communication on preventive and protective Behaviours during the COVID-19 outbreak: mediating role of risk perception. BMC Public Health, 21: 54. https://doi.org/10.1186/s12889-020-10125-5
[16] Covello, V.T. (1992). Risk communication: An emerging area of health communication research. Annals of the International Communication Association, 15(1): 359-373. https://doi.org/10.1080/23808985.1992.11678816
[17] McComas, K.A. (2006). Defining moments in risk communication research: 1996-2005. Journal of Health Communication, 11(1): 75-91. https://doi.org/10.1080/10810730500461091
[18] Palenchar, M.J. (2005). Risk communication. In R. L. Heath (Ed.), Encyclopedia of public relations (pp. 752- 755). Thousand Oaks, CA: Sage. https://dx.doi.org/10.4135/9781452233055.n8
[19] Coombs, W.T. (2012). Ongoing Crisis Communication: Planning, Managing, and Responding (3rd ed.). Thousand Oaks, CA: Sage.
[20] McCarthy, S., Tunstall, S., Parker, D., Faulkner, H., Howe, J. (2007). Risk communication in emergency response to a simulated extreme flood. Environmental Hazards, 7(3): 179-192, https://doi.org/10.1016/j.envhaz.2007.06.003
[21] Fediuk, T.A., Pace, K.M., Botero, I.C. (2010). Exploring crisis from a receiver perspective: Understanding stakeholder reactions during crisis events. In W. T. Coombs, & S. J. Holladay (Eds), The Handbook of Crisis Communication, pp. 635-656. New York: Wiley-Blackwell.
[22] Seeger, M.W., Reynolds, B., Sellnow, T.L. (2010). Crisis and emergency risk communication in health contexts: Applying the CDC model to pandemic influenza. In R. L. Heath & D. O’Hair (Eds.), Handbook of Risk and Crisis Communication, pp. 493-506. New York: Routledge.
[23] Sheppard, B., Janoske, M., Liu, B. (2012). Understanding risk communication theory: A guide for emergency managers and communicators. Report to Human Factors/Behavioral Sciences Division, Science and Technology Directorate, U.S. Department of Homeland Security. College Park, MD: START.
[24] Morgan, G., Fischhoff, B., Bostrom, A., Atman, C.J. (2002). Risk Communication: A Mental Models Approach. Cambridge: Cambridge University Press.
[25] Rohrmann, B. (2000). A socio-psychological model for analyzing risk communication processes. Australasian Journal for Disaster Studies.
[26] Direção-Geral do Território Directorate-General for the Territory (DGT). (2020). Carta de Uso e Ocupação do Solo de Portugal Continental (COS) 2020. Land Use and Land Cover Map of Continental Portugal (COS), DGT, Lisboa. https://www.dgterritorio.gov.pt/Carta-de-Uso-eOcupacao-do-Solo-para-2018.
[27] Instituto Nacional de Estatística National Statistical Institute (INE) (2011). Censos 2011, Lisboa. https://censos.ine.pt/xportal/xmain?xpid=CENSOS&xpgid=censos2011_apresentacao.
[28] Autoridade Nacional de Emergência e Proteção Civil (ANEPC). (2016). Porto District Emergency and Protection Civil Plan., ANEPC, Porto.
[29] Bults, M., Beaujean, D.J., de Zwart, O. (2011). Perceived risk, anxiety, and behavioural responses of the general public during the early phase of the Influenza A (H1N1) pandemic in the Netherlands: results of three consecutive online surveys. BMC Public Health, 11: 2. https://doi.org/10.1186/1471-2458-11-2
[30] Almendra, R., Mota, A., Mendes, C., Sousa, L., Costa T. (2017). Identification of measures to increase resilience and / or mitigate the potential consequences of climate change in the territory. Intermunicipal Action Plan for Douro Climate Change.
[31] Cronbach, L. (1951). Coefficient alpha and the internal structure of tests. Psychomerika, 16: 297-334.
[32] Tavakol, M., Dennick, R. (2012). Post-examination interpretation of objective test data: Monitoring and improving the quality of high-stakes examinations: AMEE Guide No. 66. Medical Teacher, 34: e161-e175. https://doi.org/10.3109/0142159X.2012.651178
[33] Kellens, W., Zaalberg, R., Neutens, T., Vanneuville, W., De Maeyer, P. (2011). An analysis of the public perception of flood risk on the Belgian coast. Risk Analysis, 31(7): 1055-1068. https://doi.org/10.1111/j.1539-6924.2010.01571.x
[34] Armas, I., Avram, E. (2009). Perception of flood risk in Danube Delta, Romania. Natural Hazards, 50(2): 269-287. https://doi.org/10.1007/s11069-008-9337-0
[35] Pagneux, E., Gísladóttir, G., Jónsdóttir, S. (2011). Public perception of flood hazard and flood risk in Iceland: A case study in a watershed prone to ice-jam floods. Nat. Hazards, 58: 269-287. https://doi.org/10.1007/s11069-010-9665-8
[36] Fuchs, S., Karagiorgos, K., Kitikidou, K., Maris, F., Paparrizos, S., Thaler, T. (2017). Flood risk perception and adaptation capacity: A contribution to the socio-hydrology debate, Hydrol. Earth Syst. Sci., 21(6): 3183-3198. https://doi.org/10.5194/hess-21-3183-2017
[37] Martínez-González, M.B., Milanes, C.B., Moreno-Gómez, J., Padilla-Llano, S., Vásquez, A., Lavell, A., Saltarín-Jiménez, A., Suárez, A. (2021). Understanding social and environmental hazards in urban areas: An analysis from Barranquilla, Colombia. Social Sciences, 10(11): 411. https://doi.org/10.3390/socsci10110411
[38] Thistlethwaite, J., Henstra, D., Brown, C., Scott, D. (2018). How flood experience and risk perception influences protective actions and behaviours among Canadian homeowners. Environ. Manag., 61: 197-208. https://doi.org/10.1007/s00267-017-0969-2
[39] Nunes, A., Martins, B., Azevedo, M. (2020). Exploring the spatial perception of risk in Portugal by students of Geography. Journal of Geography, 119(5): 171-182. https://doi.org/10.1080/00221341.2020.1801803
[40] Wang, Z., Wang, H., Huang, J., Kang, J., Han, D. (2018). Analysis of the public flood risk perception in a flood-prone city: The case of Jingdezhen city in China. Water, 10(11): 1577. https://doi.org/10.3390/w10111577
[41] Judith, L.G. (2020). Risk perception and fear of urban hazard. Invest. Geog., 103: e60087. https://doi.org/10.14350/rig.60087
[42] Kristiansen, S., Bonfadelli, H., Kovic, M. (2016). Risk Perception of nuclear energy after fukushima: stability and change in public opinion in Switzerland. International Journal of Public Opinion Research, 30(1): 24-50. https://doi.org/10.1093/ijpor/edw021
[43] Slovic, P. (2010). The psychology of risk. Saúde Soc. São Paulo, 19(4): 731-747. https://doi.org/10.1017/CBO9781139061933
[44] Botzen, W., Aerts, J., Van Den Bergh, C. (2009). Dependence of flood risk perceptions on socioeconomic and objective risk factors. Water Resour. Res., 45(10). https://doi.org/10.1029/2009WR007743
[45] Martins, B., Nunes, A., Lourenço, L. (2019). Spatial risk perception among 9th grade students Mainland Portugal versus the Metropolitan Area of Porto. International Research in Geographical and Environmental Education, 28(3): 194-210. https://doi.org/10.1080/10382046.2018.1561632
[46] Liu, D.L., Li, Y., Shen, X., Xie, Y.L., Zhang, Y.L. (2018). Flood risk perception of rural households in western mountainous regions of Henan Province, China. Int. J. Disaster Risk Reduct. 27: 155-160. https://doi.org/10.1016/J.IJDRR.2017.09.051
[47] Eurobarometer. (2010). Europeans and nuclear safety. Brussels, Belgium: European Commission. http://ec.europa.eu/public_opinion/archives/ebs/ ebs_324_en.pdf.
[48] Byga, A., Salick, J. (2009). Local perspectives on a global phenomenon - Climate change in Eastern Tibetan villages. Global Environmental Change, 19(2): 156-166. https://doi.org/10.1016/j.gloenvcha.2009.01.010
[49] Lata, S., Nunn, P. (2012). Misperceptions of climate-change risk as barriers to climate-change adaptation: A case study from the Rewa Delta, Fiji. Climatic Change, 110: 169-186. https://doi.org/10.1007/s10584-011-0062-4
[50] Ellen, G., Gerrits, L., Slob, A. (2007). Risk perception and risk communication. Sustainable Management of Sediment Resources, 3: 233-247. https://doi.org/10.1016/S1872-1990(07)80068-7