Hamed Faroqi* | Leila Irajifar | Ali Cheshmehzangi
© 2022 IIETA. This article is published by IIETA and is licensed under the CC BY 4.0 license (http://creativecommons.org/licenses/by/4.0/).
OPEN ACCESS
Experts always seek for improving the development and management of multidimensional urban systems, including those of sustainability, smartness, and resiliency. These dimensions are the main keywords in related research to model and predict better development in urban and regional areas; there are overlapped concepts, common attributes, and parallel processes in existing indices designed for each of those keywords, which might not be an ideal option for the status quo. Therefore, there is a need to find a balance between these concepts/indices and identify an integrated development strategy that addresses smart, resilient, and sustainable development demands. For this purpose, first of all, attributes and themes used to develop the development indices are collected from the recent literature. Secondly, a semantic text mining technique is used to discover commonly used attributes among the collected ones. Thirdly, Principal Component Analysis (PCA) is used to investigate the correlation between the selected attributes to reduce or merge similar attributes. Fourthly, after collecting data and normalizing calculated scores for each LGA, a k-means clustering method is used to identify LGAs with similar development behaviour. And finally, the developed index is implemented in Victoria, Australia as a case study that includes 79 regional and urban local government areas. Evaluation of the results (comparing the results with two existing studies) indicated the success of the proposed index in bringing smartness, resiliency and sustainability indices under a united and comprehensive development index.
urban & regional development, smart specialization, life quality, environment, policymaking
The meaning and expectation level of a high life quality have changed throughout history corresponding to industry and technological advancements, natural and climate changes, cultural exchanges and so on. The ongoing expansion of societies emerges opportunities and challenges for planners and engineers to improve the development and management of multidimensional urban systems, including those of sustainability, smartness, and resiliency. Also, the recent Covid pandemic could be a game-changer in urban and regional areas emphasizing sustainable development for businesses and governments [1]. Decentralization and changes in the dynamics of pre-covid urban life are an opportunity to better understand and revise policies in place for promoting sustainability in regional hubs to attract more residents. The acceleration of digitalization, which enables service delivery with minimum mobility, is another recent advancement that helps researchers and planners to fill the gap between life quality in urban and regional areas by making them smarter and more disaster resilient. Therefore, there is a need to find a balance between these concepts and discover an optimum development strategy that addresses the attributes of a smart, resilient, and sustainable neighbourhood.
Sustainability is a known theme across the world of academics and practitioners as it crosses geographical, social, political and economic borders. Sustainable development is concerned with using the current resources of planet earth regarding the needs of future generations [2-4]. The increasing population that would lead to more consuming needs besides resource availability and global climate changes have brought more attention to sustainability-related issues. Researchers have studied and investigated ways of understanding sustainability in societies considering various factors aiming to develop more sustainable societies and life environments. Outcomes of the sustainability studies may help individuals in selecting suitable places for their living, policymakers in defining future policies of planning and development, and businesses in finding prosperous places for establishing and developing their stores. Sustainability has become an essential pillar of many developments and planning strategies.
Resilience and smart developments have emerged as a critical agenda for urban development in the 21st century. The growing emphasis on the smart and resilience concepts is mostly due to increasing shocks and stresses related to the environmental, economic, social, and technological pressures which are also exacerbated by the uncertainty associated with rapid urbanization, climate change, and resource limitations. While there is no overall agreement on defining resilience and smart developments, these concepts may respectively be considered as the ability to respond to and recover from hazards, and the embedded technologies and available infrastructures [5]. Smartness and resiliency (similar to sustainability) have become hot keywords in recent efforts by academics and practitioners investigating better and optimum development strategies.
Despite the lack of overall consensus on defining and characterizing the understanding of resilience, sustainability, and smart development concepts, they are recently used together in a few studies. While the final goal of each of these criteria may be the same (they are assessing a better strategy for development), these criteria have been developed in many parallel, overlapped and separate studies. These three frameworks share specific fundamental determinants that make it feasible to develop a unified index instead of three separate approaches for planners. In other words, both smartness and resiliency concepts aim to achieve some levels of sustainability [6]. Consequently, integrating sustainability, smartness, and resiliency concepts is recognized to find an optimal strategy for future development.
This study firstly reviews the existing literature to identify the potential of integrating the sustainability, smartness, and resiliency indices and how existing research trends may contribute to enhancing development in both regional and urban areas. Secondly, a text-mining analysis discovers common attributes in defining the three indices in the literature to find where these concepts converge or diverge. Thirdly, an integrated sustainable development index is developed based on the mutual attributes identified in the previous steps. Next, the developed index is implemented in Victoria, Australia as a case study that includes 79 regional and urban local government areas with more than 6.5 million populations. Finally, the implementation outcomes have been compared with two existing indices developed and implemented for the same areas, which presents the comprehensiveness of the proposed index. The rest of the paper is structured as follows. Section 2 examines the recent studies on the related topics. Section 3 briefs the used methods. Section 4 summarized the data collected for this study. Section 5 demonstrates the results and the last section discusses and concludes the findings, opportunities, and challenges achieved by this study.
This section reviews available literature on developing sustainability, smartness, and resiliency indices. Traditionally, each of these indices has a separate development and growth story. However, a few studies have recently investigated the potential and necessity to integrate these indices.
The necessity for a new model of development appeared in the late ’70s focusing on equitable distribution of available resources besides enhancing the quality of life in long-term perspectives [3, 7]. In 1987, at the World Commission on Environment and Development (WCED), the idea of sustainable development emerged emphasizing a development that meets the needs of the present without compromising the ability of the future generations to meet their own needs [5]. Since 1987, the sustainability concept has come a very long way in evolution in many different ways. There are a variety of different definitions for this concept which might be due to different policies of governments around the globe. For example, in American cities, the sustainability concept focuses on mixed land-use, compact design, walkable neighbourhoods, preservation of open spaces, agricultural land, and critical environmental areas, creating a sense of place and encouraging community and stakeholder collaboration [6]. Also, there are different ways of defining the main pillars (dimensions) of sustainability that generally cover environmental, social, economic, cultural, institutional, mobility and accessibility, infrastructure and transportation, governance etc. [8-12]. Therefore, while there is no agreement on the exact definition of the sustainability concept as a development index, it has reached much attention from researchers and practitioners worldwide to promote the better well-being of present and future generations.
The smart city is a relatively new term that may be considered a successor of information, digital, or sustainable city [13, 14]. While there has been a rise in discussion and research on smart cities after 2013, there is a lack of consensus on its definition and concept [15]. Overall, the smart city can be considered as an umbrella that covers a variety of concepts and applications such as smart urbanism, smart economy, sustainable and smart environment, smart technology, smart mobility, etc. [16]. One of the famous examples of smart cities is Barcelona, Spain: a high-tech city that brings people, information and city elements together using technologies aiming at creating competitive and innovative commerce, a sustainable greener city, and an enhanced life quality [17, 18]. The number of smart city initiatives is increasing and it was more than 178 cities around the world in 2018 [19, 20]. In conclusion, smart city research has been growing in the last decade, and its research domain is close adjacent to the sustainability research area.
Resiliency is another popular index that has been used to assess and evaluate developments around the world. Despite the abundant literature on resiliency, there are relatively few studies on the actual measurement of disaster resilience or developing resilience measurement frameworks and indices which is mainly because of the lack of a unified definition [21, 22]. Also, the type of disaster is another challenge in resiliency studies: there is not a consensus in the literature on whether this index should be an overall score or a disaster-specific one [23, 24]. Tiernan et al. identified seven research themes in resiliency literature (individual, physical, community, hazard, ecological, social, and city) that show the existing variety of this research domain [25]. In a general sense, resiliency is a protective characteristic acting to reduce the effects of, and losses from, natural hazards. It is generated from the capacities of economic, social, and governments to prepare, respond, and recover from natural hazards. Therefore, in simple words, resiliency studies focus on the impacts of natural hazards on the present and future generations.
Statistical analyses have recently been used in relevant studies to objectively design, develop and evaluate the indices [26]. Data analysis methods such as clustering or dimension reduction methods have helped researchers to better understand the structures of the data and discover patterns. K-means clustering algorithm is a well-known clustering method since 1967 developed by James MacQueen [27]. Despite the limitations (outliers, number of clusters, and empty clusters) of k-means, it is still a useful clustering method due to its simplicity, flexibility and applicability [28]. Also, data reduction methods have grown simultaneously by size increasing of datasets. The principal component analysis is one of the basic methods that have been used to detect redundancy and remove redundancy in the datasets. It transforms data of interrelated variables into a new set of variables with reduced dimensions retaining as much as possible of the variation present in the original data set [29, 30].
Only a few recent studies have investigated the resonance between sustainable, smart, and resilient frameworks [26]. As it was reviewed in the above paragraphs, these development indices, despite the fact lacking consensus on their definitions, share common concepts and attributes to assess the development strategies, the well-being of citizens and prosperous societies. Attributes of smart and resilient contexts are complementary in the pursuit of sustainable developments [27]. The implementation of smart technologies would enhance different aspects of developments that upgrade the resiliency of governance, economy, ecology, and overall quality of life which may be considered equivalent to sustainable developments [28]. Therefore, in order to address the recently discovered research gap in the literature, this study aims at developing an integrated/unified development index that covers all three sustainability, smartness, and resiliency indices.
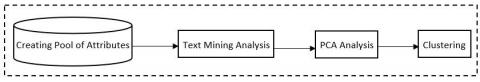
This section explains step by step process to develop the unified development index of sustainability, smartness, and resiliency. First of all, attributes and themes used to develop the development indices are collected from the recent literature. Secondly, a semantic text mining technique is used to discover commonly used attributes among the collected ones. Thirdly, Principal Component Analysis (PCA) is used to investigate the correlation between the selected attributes to reduce or merge similar attributes. Fourthly and finally, after collecting data for the study area, and normalizing calculated scores for each LGA, a k-means clustering method is used to identify LGAs with similar development behaviour. Figure 1 summarizes the methodology implemented in this study.
Figure 1. Methodology for developing the proposed index
Creating the pool of attributes starts with reviewing the literature for sustainability, smartness, and resiliency indices. Studies published in the ranked journals are found and the attributes with their definitions from each study are added to the pool of attributes. The text mining analysis method is used to find the most common and overlapped attributes used in the literature for developing the three indices (from the created pool). This method first identifies similar words based on the Jaccard similarity index [29] that is presented in Eq. (1). This similarity index measures the similarity between two words: A and B are sets of all characters in the two words. In simple words, this similarity index finds the number of similar characteristics between two words and divides it by the total number of unique characters in both words. Therefore, words with high similarity are considered the same word in the counting phase of the text mining analysis.
$\operatorname{Jaccard}(A, B)=\frac{|A \cap B|}{|A \cup B|}$ (1)
After finding similar words in the pool of attributes, the text mining method counts the frequency of each word. In the last step, a semantic review is done to find the words with similar meanings (despite having different characters) in order to categorize the attributes in related themes. To conclude, the steps of the text mining method are summarized as follows:
1. Calculates similarity between pairs of words in the pool of attributes.
2. Counts the frequency of each word.
3. Categorizes the attributes with similar meaning into the themes.
PCA is a technique to reduce the dimensionality of data. It transforms data of interrelated variables into a new set of variables with reduced dimensions retaining as much as possible of the variation present in the original data set [30]. In general, this technique starts with calculating the covariance (variance-covariance) matrix (Variance and Covariance are calculated respectively based on Eqns. (2) and (3)) of the data table, followed by calculating the eigenvectors and eigenvalues of the matrix (Eq. (4)): A is the covariance matrix, v is the eigenvector, and λ is the eigenvalue), and finally, choosing k eigenvectors with the largest eigenvalues. Finding principal components of the data help to reduce redundancy in our attributes. Also, components would help in ignoring less important attributes in the initially collected data, which would help future researchers and practitioners in saving their time and efforts in collecting data.
$\operatorname{Var}(X)=\sum\left(X_i-\bar{X}\right)^2 / N$ (2)
$\operatorname{Cov}(X, Y)=\sum\left(X_i-\bar{X}\right)\left(Y_i-\bar{Y}\right) / N$ (3)
$(A-\lambda I) v=0$ (4)
After discovering the principal components of the developed index, a clustering method is used to find LGAs with similar behaviour in the study area. The clustering method used here is the well-known k-means algorithm that is flexible and adaptable. K-means is an unsupervised learning technique that interprets datasets using only input vectors without referring to known (labelled) outcomes. K-means is initiated with the number of desired clusters and run iteratively to put similar objects (LGAs in our case) in the same cluster [31-33]. Eq. (5) represents the distance metric used for calculating the distance between LGAs and their attributes: Manhattan Distance computes the absolute differences between coordinates of pair of objects. It should be mentioned that it is necessary to normalize the scores calculated for all LGAs, otherwise, it would affect the performance of the k-means algorithms. The outcome of the clustering algorithm is to distinguish groups of LGAs with similar behaviour for the developed index, which would help in further discussions and policy-making.
Dist $_{x y}=\left|X_{i k}-X_{j k}\right|$ (5)
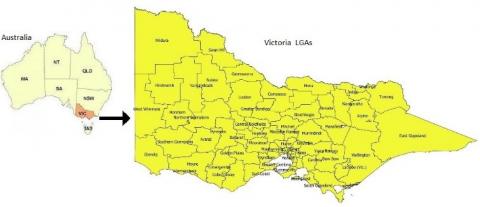
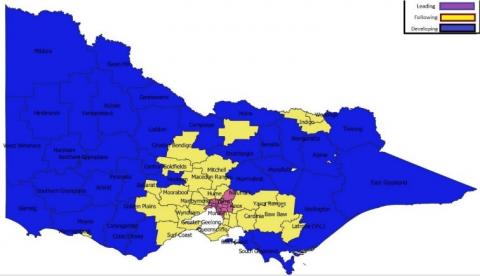
This section introduces the datasets used for developing the proposed index in the next sections. The case study is the state of Victoria, Australia. It is the second most populated (and second smallest) state of Australia and hosts the famous city of Melbourne. This study is conducted at the level of local government areas (which might be translated as municipalities in the European context) including 79 LGAs (urban and regional areas) in the state. Victoria is located in the southeast of Australia covering 227,444 km2 of land. Figure 2 presents the geographic location of Victoria.
Data used in this study are all publicly available, which makes it feasible for future researchers/practitioners to reconstruct and further develop the proposed index. These datasets are provided by either national or state agencies in Australia. These data tables are mostly available in Excel or CSV formats. Four main resources used for gathering the data are presented in the following:
1. Australian Bureau of Statistics: The national statistical agency of Australia (https://dbr.abs.gov.au/): National census data is available which can estimate socthe ial, demographic, and economic attributes of people living in each LGA. This data is not only useful for estimating people’s characteristics, but also for the attributes of LGAs (such as protected areas or business establishments). This data is available from the period 2011-to 2018 for each year. We have used the most recent available records that belong to 2018.
2. Australian Disaster Resilience Knowledge Hub: The national, open-source platform that supports and informs policy, planning, decision making and contemporary good practice in disaster resilience (https://knowledge.aidr.org.au/disasters/): Number, location, and severity of national disasters are available since 1872. In this study, we only considered the recent incidences for the period of 2001-2021 to indicate the risk of natural disasters in each LGA.
3. Victoria Police: The police department of Victoria, Australia (https://www.police.vic.gov.au/crime-statistics): Statistics of offences that happened in each LGA are available which may be considered a safety factor. The data is available for the period of 2012-2021. The number of total offences for 2021 is counted in this study.
4. Sustainability Victoria: A statutory authority in Victoria, Australia to provide a sustainable, thriving Victoria (https://www.sustainability.vic.gov.au/research-data-and-insights/waste-data): Data about types of waste in each LGA is available to estimate recycling rate. Data for 2020 is used in this study.
Figure 2. Map of local government areas of Victoria, Australia
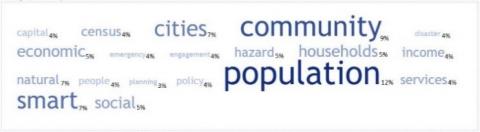
This section provides the results achieved after implementing the proposed methodology in Victoria, Australia as the case study. Creating the pool of attributes is the first step of the proposed methodology as described in Figure 1. In this step, recent and relevant studies are gathered to create a pool of attributes that have been used to develop the sustainability, smartness, and resiliency indices. Table 1 summarizes the studies that have been considered in creating the pool. This table contains ten recent and relevant (in the context and case studies) studies to this study’s purpose, which is to develop an integrated index covering all three sustainability, smartness, and resiliency concepts. It should be mentioned that these ten studies were reviewed in section 2. Attributes and descriptions used for developing the indices are collected and put together in a pool of attributes to initiate the text analyzing method that is presented in Figure 3.
After creating the pool of attributes, the Jaccard similarity between the words is calculated and similar words are merged (e.g. city and cities are considered as the same word). This similarity index measures the similarity of characters between two words. Also, it should be mentioned that verbs, pronouns, prepositions, conjunctions, and interjections are omitted from the pool of attributes. Figure 3 presents the word frequency outcome in the text analyzing method. Nineteen main keywords are discovered with the highest frequency belonging to “population” followed by “community”. In other words, these keywords are the common pillars of the developed indices in the literature.
The main keywords discovered in Figure 3 are categorized into themes with similar and close meanings. Table 2 presents and summarizes the output of the text analysis method, which are the themes, attributes, and descriptions selected from the literature to develop the proposed sustainability-smartness-resiliency index. Four main themes are chosen carefully to cover the common sense of the attributes. Also, 22 attributes are selected to create the desired development index. The first theme “Society” includes 7 attributes mostly focused on the characteristics of people who live in that LGA. The second group “Infrastructure” relates to 6 attributes covering issues with available bases, infrastructures and supports in the area. The third one “Nature” includes 3 attributes focused on environmental issues. Last but not least, the “Government” theme covers 6 attributes related to policies and decisions made by governments and policy makers.
Table 1. Recent and relevant studies used for creating the pool of attributes
|
No. |
Title |
Authors |
Year |
|
1. |
Sustainable Smart Cities and Industrial Ecosystem: Structural and Relational Changes of the Smart City Industries in Korea |
Jo, S. S., Han, H., Leem, Y., & Lee, S. H. |
2021 |
|
2. |
A Study on the Integration of Resilience and Smart City Concepts in Urban Systems |
Tzioutziou, A., & Xenidis, Y. |
2021 |
|
3. |
Sustainable urban development for older Australians: Understanding the formation of naturally occurring retirement communities in the greater Brisbane region. |
Xia, B., Buys, L., & Yigitcanlar, T. |
2021 |
|
4. |
Smart cities down under: Performance of Australian local government areas |
Yigitcanlar, T., Hewa Heliyagoda Kankanamge, R. N. E., Butler, L., Vella, K., & Desouza, K |
2020 |
|
5. |
Towards Australian regional turnaround: insights into sustainably accommodating post-pandemic urban growth in regional towns and cities |
Guaralda, M., Hearn, G., Foth, M., Yigitcanlar, T., Mayere, S., & Law, L. |
2020 |
|
6. |
The Australian Disaster Resilience Index: a summary |
Parsons, M., Reeve, L., McGregor, J., Marshall, G., Stayner, R., McNeill, J., Hastings, P., Glavac, S., & Morley, P. |
2020 |
|
7. |
Sustainability Index Australia: Report |
Bonnefin, J., Haan, S., Robertshaw, C., Marcius, S. |
2018 |
|
8. |
A synthesis of disaster resilience measurement methods and indices |
Cai, H., Lam, N. S., Qiang, Y., Zou, L., Correll, R. M., & Mihunov, V. |
2018 |
|
9. |
Sustainable development of smart cities: A systematic review of the literature |
Trindade, E. P., Hinnig, M. P. F., Moreira da Costa, E., Marques, J. S., Bastos, R. C., & Yigitcanlar, T. |
2017 |
|
10. |
Sustainable smart cities: Evaluation of Australian practice |
Ullah, F., Thaheem, M. J., & Sepasgozar, S. M. |
2016 |
Table 2. Selected attributes for developing the proposed index
|
Theme |
Description |
|
1. Society |
Individuals who completed year 12 or equivalent |
|
Average life expectancy |
|
|
Population with private health insurance |
|
|
Offence per 100,000 people |
|
|
Population with a core activity need assistance |
|
|
Residents in the same residence for greater than 5 years |
|
|
Population aged over 75 |
|
|
2. Infrastructure |
Private vehicles categorized as electric or hybrid |
|
Households with solar power and hot water |
|
|
Households with Internet access |
|
|
Individuals walking to work or using public transport |
|
|
Number of employees in health care and social assistance |
|
|
Number of employees in administrative and support services |
|
|
3. Nature |
Protected areas (e.g. national parks) |
|
Natural disasters |
|
|
Recycling rate |
|
|
4. Government |
In labour force |
|
Median household income |
|
|
Involuntarily unemployed |
|
|
Households with mortgage repayments greater than or equal to 30% of household income |
|
|
Local government grants per capita |
|
|
Business establishments per 1,000 people |
Figure 3. Results of text mining in the pool of attributes
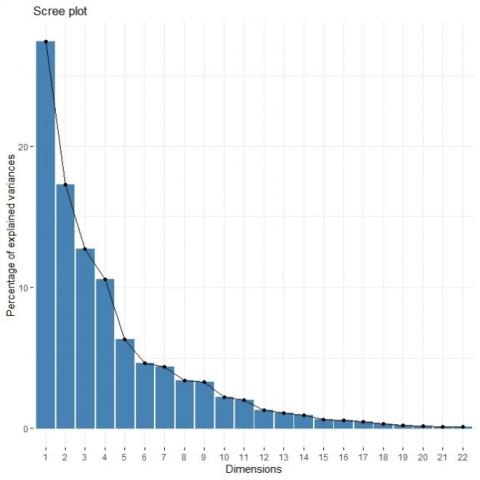
Values for the selected attributes in Table 2 are collected through the sources introduced in section 4; data for all attributes for all the LGAs are publicly and freely available. After collecting the data, PCA analysis is performed to help with understanding the structure and existing variance between the collected data. In total, there are 22 selected attributes, therefore, there will be 22 principal components. Each of the discovered components explains a percentage of the existing variance in the dataset. Figure 4 presents the explained/discovered variance by each component. The first 6 principal components cover about 70% of the existing variance in the dataset. Considering the first 6 principal components and loading factors (for the attributes in these components) can help to understand the effects and impacts of each of the attributes; five more effective attributes (attributes with greater impacts (loading factors) in the first 6 components) are the following: involuntarily unemployment, population with private health insurance, recycling rate, the population aged over 75, households with mortgage repayments greater than or equal to 30% of household income. In simple words, these five attributes might be recommended as the attributes with more priority to collect and analyse in future studies (in case of limited time and budget).
The last step of the proposed methodology is the clustering, to find more and less similar LGAs and put them in the same groups. K-means algorithm is used, and different values for k (number of clusters) are considered; according to the existing studies and performance of the k values, k=3 is chosen to run the clustering algorithm. Figure 5 presents the outcome of the clustering step. LGAs with the same colour are in the same cluster. The blue clusters with 33 LGAs can be considered as the Developing (level 3) LGAs. The yellow cluster includes 26 LGAs can be assumed as the Following (level 2) LGAs. The purple clusters with 20 LGAs can be considered the Leading (level 1) LGAs. Also, it can be observed that there is a relation between the clusters and distance to the capital (Melbourne) of the state: LGAs closer to the capital of the state are the leading ones; Following LGAs are located between the Leading ones and Developing LGAs; Developing LGAs are the regional ones far from the Melbourne LGA and less populated. The relation between the distance and clusters may imply a latent factor that connects the LGAs.
Figure 4. Explained variances in each principal component
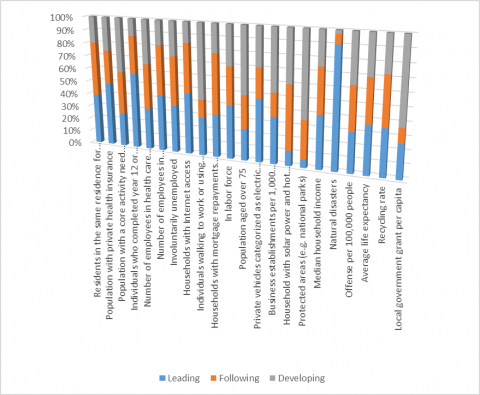
Figure 6 presents values of the attributes (Table 2) for the centres of the three types of discovered clusters. Differences between the values for each attribute are observable and would help make clear policies for improving Developing LGAs. Attributes such as “individuals completed year 12”, “population with private health insurance”, “households with Internet access”, “number of employees in administrative and support services”, and “number of electrical or hybrid vehicles” are the attributes that need to be more focused in Developing LGAs because they have the biggest difference with those attributes in Leading LGAs. On the other hand, an attribute like “natural disasters” in Leading LGAs needs more attention to management by the policymakers. According to Figure 5, Developing LGAs are mostly regional areas with low population, which should be considered in interpreting some of the attributes in Figure 6 such as “local government grant per capita”.
In Australia and in recent years, there has been an increasing interest in further development of regional areas. The Australian government has tried to encourage people to reside in these areas, e.g. the government of Australia has facilitated some international visas for foreigners who are interested in living in regional areas. As was observed in Figure 5, the outcomes of the clustering step have put regional areas in a separate cluster. Focusing on the above-mentioned attributes (attributes that needed more attention in the Developing LGAs) would help the government to make more efficient with fewer costs policies to attract population and skilled workers into the regional areas.
Figure 5. Outcomes of LGAs clustering based on the proposed index
Figure 6. Values of attributes for centers of the discovered clusters
Having more vivid and tangible results for future readers, a few examples of each cluster type (Leading, Following, and Developing) are discussed here. Melbourne and Maroondah from the Leading cluster, Ballarat and Hume from the Following cluster, and Moira and Mildura from the Developing cluster are selected here. Melbourne and Maroondah are small areas with a concentration of businesses and offices; these two LGAs have an average of more than 3000 citizens living there per squared kilometre; 77% of people living in Melbourne and Maroondah have completed year 12 education; 45% have been covered by private health insurance; 85% of households have access to high-speed Internet; 40% of employed citizens work in administrative and support jobs; 15% of available private vehicles are either hybrid or electric.
Ballarat and Hume are medium-sized areas that have been attracting businesses and offices in recent years mostly because of the support of governments; these two LGAs have an average of more than 600 citizens living there per squared kilometre; 43% of people living in Ballarat and Hume have completed year 12 education; 34% have been covered by private health insurance; 60% of households have access to high-speed Internet; 35% of employed citizens work in administrative and support jobs; 12% of available private vehicles are either hybrid or electric.
Moira and Mildura are vast areas mostly covered by agriculture and farmlands; these two LGAs have an average of fewer than 5 citizens living there per squared kilometre; 15% of people living in Mildura and Moira have completed year 12 education; 30% have covered by private health insurance; 23% of households have access to high-speed Internet; 25% of employed citizens work in administrative and support jobs; 6% of available private vehicles are either hybrid or electric.
These 6 examples (Melbourne, Maroondah, Ballarat, Hume, Mildura and Moira) illustrated what was earlier observed in Figure 6 as a general comparison between the clusters: there are meaningful differences between collected attributes for LGAs of different clusters. Policymakers may assign weight to their strategic plans for upcoming years according to the cost and benefits they would achieve by improving each of these attributes. E.g. if a policymaker looks for a long-term improvement in quality of life, he/she may focus on attributes of the percentage of people who have completed year 12; if he/she wants some short-run results, it might be more reasonable to focus on attributes such as the number of employees in administrative and support services that need less time budget.
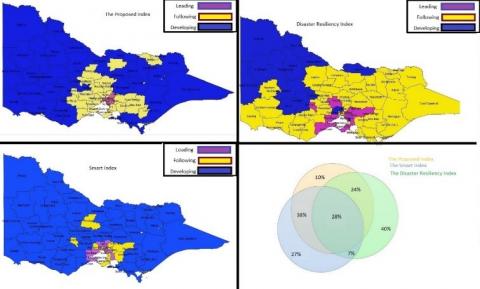
In this section, the outcomes of the proposed index are compared with two relevant resources. These two resources are available for the same case study (Victoria, Australia), and both have used three levels (assumed as Leading, Following, and Developing) for the clustering purpose. Two resources are in the studies of Yigitcanlar et al. [20]. Smart cities down under: Performance of Australian local government areas” and https://adri.bnhcrc.com.au/#!/maps (Disaster Resilient Index). It should be mentioned that Yigitcanlar et al. [20] only studied 41 out of 79 LGAs in Victoria, Australia; therefore, we reproduced their smartness index with available indicators.
Figure 7. Comparison results
Figure 7 presents the comparison results using a Venn diagram to show the logical relation between the sets. This diagram presents how many LGAs are put in the same cluster by this study and the other two (how many LGAs are given the same level of development). 28% of LGAs are put in the same clusters by all three studies. 35% of LGAs are put in the same clusters by Smart Cities Down Under index and Disaster Resilient index. 66% are discovered to have the same level by our proposed index and Smart Cities Down Under index. 52% of LGAs are put at the same level by our proposed index and Disaster Resilient index. In total, our study only put 10% of LGAs at a different level than the other two ones. To conclude, the evaluation results indicate the comprehensiveness of our proposed index that is acting as an umbrella to cover available (and parallel indices) to measure the sustainability of LGAs.
This study develops a novel and comprehensive development index covering sustainability, smartness and resiliency concepts. The proposed index is built on the existing literature of the sustainability, smartness, and resiliency indices. Text mining, PCA, and clustering analyses are used to understand the effect of attributes and develop the desired index. The developed index is implemented in Victoria, Australia. Also, the outcomes of the clustering step are compared with the available smartness and disaster resiliency indices for the case study. Evaluation of the results indicated the success of the proposed index in integrating smart and resilient indices for having a sustainable development index.
Recent and relevant studies were chosen from the existing literature to create the pool of attributes and initiate the text mining method. PCA analysis indicated the principal components of the selected attributes. LGAs in the case study were clustered into three levels: Leading, Following, and Developing. Leading LGAs have more desired values of attributes, followed by Following and Developing LGAs. Comparing values of attributes for each cluster indicates clear directions to focus on improving and upgrading the sustainability levels at the Following and Developing clusters. According to the map in Figure 5, it can be observed that there is a direct relation between the distance to the capital of the state and discovered clusters: the closer to the capital, the more sustainable LGAs are observed. Also, the developed index has put 52% of the LGAs in the same cluster as an existing disaster resilient index; and 66% of the LGAs in the same cluster as an available smartness index.
According to the Regional Development Victoria (RDV) agency (https://www.rdv.vic.gov.au/), there are ongoing partnerships between regional areas in the Victoria state. These partnerships aim at making regional Victoria a better place to live by providing regional jobs and infrastructure funds, investment and trade, business development, emergencies and economic recoveries, and so on. Also, current funded projects of RDV are put in three categories: regional jobs fund, regional infrastructure fund, and stronger regional communities plan. Results achieved by this study (specifically in Figures 5 and 6) can act as a lighthouse for better policymaking and the development of regional areas. Attributes such as “individuals completed year 12”, “population with private health insurance”, “households with Internet access”, “number of employees in administrative and support services”, and “number of electrical or hybrid vehicles” need more attention from authorities to fill the life quality gap between the regional and urban areas.
The scientific contribution of this study mainly is in integrating the existing literature and shedding light on the path for future researchers and practitioners who are interested in developing united and comprehensive strategies for the development of urban and regional areas. The practical contribution is implementing the proposed methodology on a large case study and investigating its results, correlated and effective parameters. However, the limitations of this study are mostly related to the availability and recentness of the datasets. Some of the datasets belong to the year 2018. While there has been some development and changes in some LGAs since 2018. In the end, future studies can be set in two main directions: first, updating the datasets and studying the effects of policies and the evolution of LGAs over time; second, running the proposed index on other case studies to verify the transformability of the proposed methodology, and make more comparisons between case studies.
[1] Janiszewska, D., Hannevik Lien, V., Kloskowski, D., Ossowska, L., Dragin-Jensen, C., Strzelecka, M., Kwiatkowski, G. (2021). Effects of COVID-19 infection control measures on the festival and event sector in poland and norway. Sustainability, 13(23): 13265. http://dx.doi.org/10.3390/su132313265
[2] Jamal, F.N., Othman, N.A., Nizam, N.Z., Jelita, A., Rohmah, W., Dzakiyullah, N.R. (2022). Green marketing: Reviewing aspect of communication tools. International Journal of Sustainable Development and Planning, 17(4): 1085-1092. https://doi.org/10.18280/ijsdp.170405
[3] Kaur, H., Garg, P. (2019). Urban sustainability assessment tools: A review. Journal of cleaner production, 210: 146-158. http://dx.doi.org/10.1016/j.jclepro.2018.11.009
[4] Ossowska, L.J., Janiszewska, D.A. (2020). Toward sustainable energy consumption in the European Union. Polityka Energetyczna, 23. http://dx.doi.org/10.33223/epj/119371
[5] UN. (1987). Our Common Future — Report of the World Commission on Environment and Development. United Nations Docuvelopment indments, England.
[6] Smart Growth Network. (2006). This is smart growth. Princeton Junction, NJ: International City/County Management Association.
[7] Xia, B., Buys, L., Yigitcanlar, T. (2021). Sustainable urban development for older Australians: Understanding the formation of naturally occurring retirement communities in the greater Brisbane region. Sustainability, 13(17): 9853. https://doi.org/10.3390/su13179853
[8] Guaralda, M., Hearn, G., Foth, M., Yigitcanlar, T., Mayere, S., Law, L. (2020). Towards Australian regional turnaround: insights into sustainably accommodating post-pandemic urban growth in regional towns and cities. Sustainability, 12(24): 10492. http://dx.doi.org/10.3390/su122410492
[9] Bastidas, J.V., Melo, W.A.B., Briones-Bitar, J. (2022). Sustainability of the cocoa industry: Cocoa waste mucilage use to produce fermented beverages. Case study in Los Ríos province. International Journal of Sustainable Development and Planning, 17(4): 1147-1152. https://doi.org/10.18280/ijsdp.170412
[10] Rosardi, R.G., Prajanti, S.D.W., Atmaja, H.T., Juhadi, Yanti, D. (2022). Sustainable tourism development strategy with AHP (Analytical Hierarchy Process) method in Pagilaran tea plantation agrotourism, Indonesia. International Journal of Sustainable Development and Planning, 17(4): 1317-1327. https://doi.org/10.18280/ijsdp.170429
[11] Šipilova, V., Ostrovska, I., Jermolajeva, E., Aleksejeva, L., Olehnovics, D. (2017). Evaluation of sustainable development in rural territories in Latgale Region (Latvia) by using the conception of smart specialization. Journal of teacher Education for Sustainability, 19(1): 82-105. http://dx.doi.org/10.1515/jtes-2017-0006
[12] Faroqi, H., Mesbah, M., Kim, J. (2018). Inferring socioeconomic attributes of public transit passengers using classifiers. In Proceedings of the 40th Australian transport research forum (ATRF).
[13] Faroqi, H., Mesbah, M., Kim, J. (2019). Comparing sequential with combined spatiotemporal clustering of passenger trips in the public transit network using smart card data. Mathematical Problems in Engineering, 2019: 5070794. http://dx.doi.org/10.1155/2019/5070794
[14] Angelidou, M. (2015). Smart cities: A conjuncture of four forces. Cities, 47: 95-106. http://dx.doi.org/10.1016/j.cities.2015.05.004
[15] Hortz, T. (2016). The smart state test: A critical review of the smart state strategy 2005-2015’s knowledge-based urban development. International Journal of Knowledge-Based Development, 7(1): 75-101. http://dx.doi.org/10.1504/IJKBD.2016.075434
[16] Trindade, E.P., Hinnig, M.P.F., Moreira da Costa, E., Marques, J.S., Bastos, R.C., Yigitcanlar, T. (2017). Sustainable development of smart cities: A systematic review of the literature. Journal of Open Innovation: Technology, Market, and Complexity, 3(3): 11. http://dx.doi.org/10.1186/s40852-017-0063-2
[17] Lee, J.H., Hancock, M.G., Hu, M.C. (2014). Towards an effective framework for building smart cities: Lessons from Seoul and San Francisco. Technological Forecasting and Social Change, 89: 80-99. http://dx.doi.org/10.1016/j.techfore.2013.08.033
[18] Bakıcı, T., Almirall, E., Wareham, J. (2013). A smart city initiative: The case of Barcelona. Journal of the Knowledge Economy, 4(2): 135-148. http://dx.doi.org/10.1007/s13132-012-0084-9
[19] Palomo-Navarro, A., Navío-Marco, J. (2018). Smart city networks’ governance: the Spanish smart city network case study. Telecommunications Policy, 42(10): 872-880. http://dx.doi.org/10.1016/j.telpol.2017.10.002
[20] Yigitcanlar, T., Hewa Heliyagoda Kankanamge, R.N.E., Butler, L., Vella, K., Desouza, K. (2020). Smart cities down under: Performance of Australian local government areas.
[21] Cai, H., Lam, N.S., Qiang, Y., Zou, L., Correll, R.M., Mihunov, V. (2018). A synthesis of disaster resilience measurement methods and indices. International Journal of Disaster Risk Reduction, 31: 844-855. http://dx.doi.org/10.1016/j.ijdrr.2018.07.015
[22] Gaber, R.M., El-Kader, M.H.A., Okba, E.M. (2022). The resilience performance index, a fuzzy logic approach to assess urban resilience. International Journal of Sustainable Development and Planning, 17(4): 1225-1235. https://doi.org/10.18280/ijsdp.170421
[23] Magis, K. (2010). Community resilience: An indicator of social sustainability. Society and Natural Resources, 23(5): 401-416. http://dx.doi.org/10.1080/08941920903305674
[24] Norris, F.H., Stevens, S.P., Pfefferbaum, B., Wyche, K. F., Pfefferbaum, R.L. (2008). Community resilience as a metaphor, theory, set of capacities, and strategy for disaster readiness. American Journal of Community Psychology, 41(1): 127-150. http://dx.doi.org/10.1007/s10464-007-9156-6
[25] Tiernan, A., Drennan, L., Nalau, J., Onyango, E., Morrissey, L., Mackey, B. (2019). A review of themes in disaster resilience literature and international practice since 2012. Policy Design and Practice, 2(1): 53-74.
[26] Tzioutziou, A., Xenidis, Y. (2021). A study on the integration of resilience and smart city concepts in urban systems. Infrastructures, 6(2): 24. http://dx.doi.org/10.3390/infrastructures6020024
[27] Allam, Z., Dhunny, Z.A. (2019). On big data, artificial intelligence and smart cities. Cities, 89: 80-91. http://dx.doi.org/10.1016/j.cities.2019.01.032
[28] Engelbert, J. (2019). Reading the Neoliberal Smart City Narrative: The Political Potential of Everyday Meaning-Making. In the Right to the Smart City; Cardullo, P., Di Feliciantonio, C., Kitchin, R., Eds.; Emerald Publishing Limited: Bingley, UK, 43-55. http://dx.doi.org/10.1108/978-1-78769-139-120191003
[29] Faroqi, H., Mesbah, M., Kim, J. (2019). Behavioural advertising in the public transit network. Research in Transportation Business & Management, 32: 100421. http://dx.doi.org/10.1016/j.rtbm.2019.100421
[30] Abdi, H., Williams, L.J. (2010). Principal component analysis. Wiley Interdisciplinary Reviews: Computational Statistics, 2(4): 433-459. http://dx.doi.org/10.1002/wics.101
[31] Hamerly, G., Elkan, C. (2004). Learning the k in k-means. Advances in Neural Information Processing Systems, 16: 281-288.
[32] MacQueen, J. (1967). Classification and analysis of multivariate observations. In 5th Berkeley Symp. Math. Statist. Probability, pp. 281-297.
[33] Shukla, S., Naganna, S. (2014). A review on K-means data clustering approach. International Journal of Information and Computation Technology, 4(17): 1847-1860.