Hussain Ahmed Saad Al-Shadidi
© 2022 IIETA. This article is published by IIETA and is licensed under the CC BY 4.0 license (http://creativecommons.org/licenses/by/4.0/).
OPEN ACCESS
Interest in the concept of the optimal city size began to increase when the size of some cities reached a level that began to negatively affect their economic efficiency. Especially with the weak possibilities of urban and regional economic development. The research problem (weak balance between city size and their economic development). The research aims to study and analyze the relationship between City Size and economic development through some foundations, theories and to arrive at an explanatory model for them. The hypothesis of the research is that there is a positive relationship between the increase in the size of the city and its economic efficiency to reach the optimal size, Then the relationship is inverse, unless the intervention and direct this growth through development That is, the changes in the basic economic sectors will lead to a kind of balance between the city's economy and its population size. Through the study of the research. An Explanatory and analytical model was reached based on the concept of the Economic Pendulum and the extent of its movement towards the upper and lower limits to clarify this relationship. The city of Alexandria in the Province of Babylon as a case study. It was concluded that it passed through two stages (Contraction Stage and Economic Development stage). In the end, it was concluded that City Size is a Relative Size that changes from place to place and from time to time. Where it depends on the Economic potential of those Cities, represented by investment, or natural resources and spatial characteristics.
optima city size, economic development, economies, cities economic potential
The Urban System is of great importance in its relationship with city sizes, some cities have reached large sizes and the concept of diseconomies has emerged in this urban system. The existence of a strong correlation between the size of cities and their economic development is related to two main aspects (the first aspect is costs and the second aspect is benefits). Reaching a kind of relative balance between costs and benefits in cities requires achieving a theoretical balance b(actual and potential) at the lowest economic, social and environmental costs. The comprehensive view of the concept of optimum size is directly related to the integration of the developmental dimensions of activities, sites and institutions into balanced dynamic development paths. Despite the multiplicity of criteria for the Optimal City Size, including (economic, social, service, organizational), some studies and theories have indicated that the balance of the network of urban settlements is related to the ability of these cities to exercise their functions, commensurate with the number of their population, through the principle of achieving Positive economies. In other words, achieved proportionality between development factors according to the capabilities of each city with the assumed population sizes and its impact on the stability of the Urban System.
The optimal city size is an intuitive and clear indicator of whether the current state of the city is efficient, so it is determined by the internal factors of the city and the way they are organized [1]. Can be defined by the number of population as a quantitative indicator of the city, which is characterized by the optimal exploitation of economic and social resources (actual or potential resources), the greatest benefit from internal and external economies, and the lowest costs within a framework of local and between production and consumption in order for the economic welfare to continue as the city maintains the level of the optimal size of its population through the best use of resources regional balance in a particular country during a certain period of time. On the following indicators [2]:
A- Considering the Population as a quantitative indicator to be supplemented by other elements of discrimination. The Population is not determined by any number, even if it is within the general average population density.
B- The appropriate number for the Optimal size and its conditions is a relative indicator related to the population reality of the state or region and the time period.
C- The optimal size depends on the normative analysis. It is assumed that a theoretical balance is achieved, and this balance must be associated with the maximum efficiency of production and consumption. As the city maintains the level of the optimal size of the city.
The most important theories and rules that studied this concept, depending on the population, are as follows:
1.1 Rank-size rule
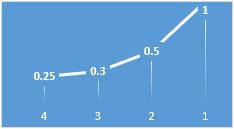
This theory explains the relationships between the numbers and sizes of cities, through the Rank-Size Rule by George Zipf. The main premise of the Zipf rule is that there is in every country and in every region a large city (primary city). It ranks first, in terms of its population size, and the rest of the cities are based on the sequence 1/2, 1/3, 1/4, 1/n. The countries to which this rule applies are the countries that have achieved a reasonable balance between their cities and urban centers. The first city in these areas does not have a monopoly on the wealth of the state, but the cities of developing countries are often far from the urban balance represented by the relationships contained in this rule, Figure 1 [3].
Figure 1. Hierarchical relationship of city size (Zipf theory(
1.2 M.Jefferson base
This theory depends on the distribution of activities and events in cities, whether this distribution is actual or a planning and developmental distribution. The rule states that the hierarchy of cities in a region depends on the activities available in it. There is a city first in terms of rank that contains most of the advanced and specialized activities and events, and the cities are arranged after them, so that the large cities do not take over the share of other cities in development, but it remains a priority, Figure 2 [4].
Figure 2. The hierarchical relationship in the sizes of cities (Jefferson's theory)
Economic potential of cities can be divided according to the nature of their exploitation into two parts [5]:
A- Actual economic potentials: They are the capabilities and characteristics that characterize cities and that qualify them for growth. If these potentials are optimally exploited through the economic development of these cities, it depends mainly on the size of the ecdonomies and the population size.
B- Economic dynamism: It is the economic ability to invest, build, and reconfigure the internal and external economies to achieve economic development. They are economic processes that include responding to development goals, and are represented by the movement of population (especially the movement of workers) represented by migration for the purpose of work, and are also affected by the volume of investment for cities.
3.1 Population size
Population size in cities is an important variable that affects and is affected by many factors, the most important of which are the economic factors. It forms the basis for the volume of work and the volume of consumption. There is a correlation between Population Size and Size resources, Population Size and the average per capita income. The Size of the Population in cities is determined in proportion to the nature of the resources and capabilities [6].
There are some criteria for measuring of size population, and relationship of the city size and their economy as follows:
A-Population density criteria: It is represented by the ratio of the population to the area of a specific geographic area, where the housing density in a city can be considered an indicator of the level of its economic progress as it is an attractive economic pole for the Population.
B-Employment level criteria: according to this criterion, the size of cities and regions is determined by the labor force available in the region, where cities and regions are considered to be overcrowded when there is unemployment or a scarcity in available job opportunities, therefore, restructuring the workforce on the productive branches may It provides employment opportunities and reduces the level of unemployment.
C-Average income or average output criteria: the size of cities is determined according to the principle of return to scale, by the presence of two forces operating in opposite directions; One is scale economies, which cause per capita income to rise, and the other is diminishing marginal returns, which cause per capita income to fall due to an increase in population.
3.2 Economies [7]
A-Spatial Economies: the resources and Spatial characteristics that can be invested in economic development, which are the natural resources and the natural increase of the population (which results in the increase of workers).
B-Economies of scale: It can be considered as a result of the inverse relationship between the quantity produced and the fixed costs per unit of production. Economies may also reduce the variable costs per unit because operational efficiencies. Economies of scale can be categorized into two main types: internal (changes within the firm) and external (resulting from external factors such as the size of the industry).
3.3 Migration
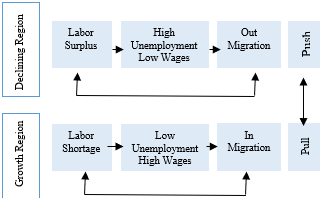
Migration of Population and workforce from one place to another is one of the most important reasons affecting the redistribution of population in cities, Migration expresses the response to the economic forces, which push the population to leave their place of origin because to expulsive factors, and settling in another place called the place of arrival ( destination) because attractive factors, and spatial development plans try to control the spatial redistribution of the population through these factors, as well as through the organization of resources and capabilities, and as a result of the above, a pull-push process occurs between different cities and regions (Figure 3) [8].
Figure 3. Sequence of causal effects of migration economic theory
3.4 Investment and labor force
The volume of investment is the main factor controlling employment, which can be drawn up by economic development plans, which depends mainly on capital formation. The increase in invested capital is associated with an increase in the number of workers who can be prepared for productive employment. Investments are affected by the distribution process on the economic sectors, as well as by the capital used of the production process [9].
The benefits increase with the increase in city size, because the external economies of scale, as every new investment project that enters the city contributes to the economies of scale and makes the city a better place for the increased interaction between supply and demand.
At a certain point, the size of the city reaches the stage of stability, and here the problems begin to appear, which are pollution and overcrowding. And marginal costs rise until they become greater than marginal benefits, so the place becomes undesirable as a site for new investment projects and undesirable for living. There are 6 cases that show the size of the city, the frameworks of which can be determined through the relationship between costs and benefits and their impact on the size of the population as follows [10]:
A- The least size of growth, which is the volume that the cost rate exceeds the minimum size of the benefit rate.
B- The least size of cost, in which the average costs are as low as possible.
C- The most size of benefit, in which the gap between the cost rate and the benefit rate is as wide as possible.
D- The most size of productive. The marginal benefits are as large as possible.
E- The scale at which growth faces self-frustration. When marginal costs exceed marginal benefits.
F- The largest size for growth. In which the marginal cost rate exceeds the benefit rate. Therefore, any additional growth will be harmful to everyone.
The economic development and economic growth of cities can be explained according to the mathematical equation of the simple pendulum by applying the cases that explain the difference in the size of cities, as well as clarifying the influencing factors that lead to that difference, which is the relationship between costs and benefits and their impact on population size, which can be interpreted as follows:
5.1 Least size of growth
The least size of growth: represented by the spatial development of the growth pole, which is represented by an increase in costs represented in construction, operational and investment costs. The returns are within the lowest limits, and thus the economic capacity is determined by the economies and investment possibilities that provide many job opportunities that are considered as an attractive factor for the population and thus increase city size (Figure 4).
Figure 4. Left great end
Figure 5. Towards the right great
5.2 Least costly size
The least costly size and the most productive size: the marginal costs are the least possible. The marginal revenue is as much as possible, and this situation is represented by the economic growth of cities through the dynamic economic energy represented by the movement of investment, the increase in the supply of work and the increase in the population size (Figure 5).
5.3 Most size of benefit
The Economic potential in this case is the optimal population size in order to achieve the best investment and the least negative effects on the city. When the population increases above this size, the marginal production decreases. Therefore, the total production increases by less than the increase in the number of workers, and then the average output decreases (Figure 6).
Figure 6. Right great end
5.4 Largest size that can be grown
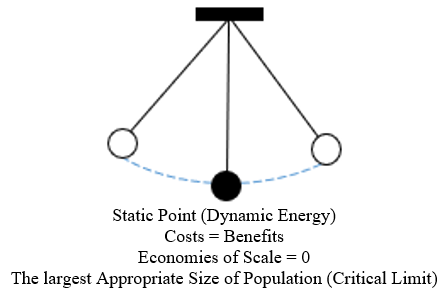
The largest size that can be grown. In which the marginal cost rate exceeds the benefit rate. Therefore, any additional growth will be harmful to everyone (Figure 7).
Figure 7. Static point
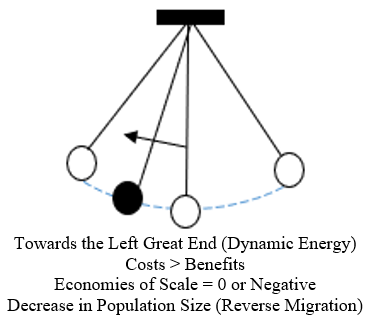
Figure 8. Towards the left great end
5.5 The size in which growth faces self-frustration
The size in which growth faces self-frustration: the number of workers is less than the number needed to exploit the available resources. The production decreases by a greater proportion than the decrease in the number of workers, and then the average output and the average income decreases (Figure 8).
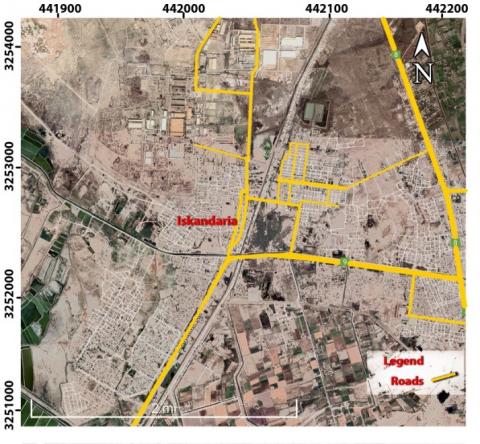
For the purpose of analyzing the size of the population of the city of AL-Iskandaria, it is necessary to study its size according to the Zipf rule (Rank-Size Rule) To identify the imbalance in the equilibrium curve of the urban settlements in the study area, and the gap between the population and the number according to the Ziph rule. This gap represents an important indicator in directing the development that these cities need to face the gap and achieve a kind of balance between the city's economy and its population size. The optimal size of the city is calculated by study the population of the province of Babylon and its administrative units, and redistributing the population according to the Zipf rule to reach the rank of Alexandria city and its Optimum Size. AL-Iskandaria is characterized by industrial activities. It contains some large Industries in Iraq. After 2016, Three companies were merged. (General Company for the Manufacture of Cars, the General Company for Mechanical Industries, the General Company for the Battery Industry) to form the General Company for the Manufacture of Cars and Equipment, which is one of the Companies Affiliated to the Ministry of Industry and Minerals and Specialized in Engineering Industries (industrial and agricultural activities) [11].
Table 1. Population size of cities of in province of Babylon (2018) and according to (rank - size rule) [12]
|
City Rank |
Gap |
Population Size Rank-Size Role (Zigh) |
Population Size (2018) |
City |
|
1 |
0 |
582046 |
582046 |
Hila |
|
2 |
-125,077 |
291023 |
165946 |
Iskandaria |
|
3 |
-28,105 |
194021 |
165916 |
Qasim |
|
4 |
-557 |
145511 |
146068 |
kifl |
|
5 |
-25,106 |
116409 |
141515 |
Midhatiya |
|
6 |
-35,618 |
97007 |
132625 |
Mashroo |
|
7 |
-38,614 |
83149 |
121763 |
Mahawil |
|
8 |
-48,318 |
72755 |
121073 |
Sadat Alhidia |
|
9 |
-66,491 |
64671 |
113162 |
Abi-Gharaq |
|
10 |
-32657 |
58204 |
90861 |
Somaly |
|
11 |
-8,386 |
52913 |
61299 |
Nile |
|
12 |
-8,832 |
48,503 |
57335 |
Mussyab |
|
13 |
-4,401 |
44772 |
49176 |
Jurf Alsaker |
|
14 |
-970 |
41573 |
40567 |
Taleaa |
|
15 |
386 |
38803 |
38417 |
Emam |
|
16 |
-896 |
36377 |
37273 |
Hshimiya |
Table 1, Figure 9 show that the city of AL-Iskandaria occupies the second place among cities of province of Babylon, with a Population Size of (165,916 Person), This Size is less than the assumed size according to the Ziph Rule by (125,077 Person), and This is evidence that there is a Capacity for the City to accommodate other numbers of residents for the year 2018. This ability to increase the Population must be linked to the process of change and development in the developmental economic base of the city, Aspecially for the Industrial Sector as it is the dominant Sector in the city. and when comparing the Size of the Population for the period before 2018. Its Population for 2015 was (132,953 Person). The population is lower than the optimal population size of the city, which is (212,425 Person) by (85,033 Person). Also, when comparing the Population of Alexandria in 2015 with its number in 2013 (157,381 Person). We note that the Population Size has decreased by (24,428 Person), meaning that there is a reverse migration from the city. When comparing the city plan for 2013 and for 2015, we note that there is no growth in the urban mass (Figure10) and (Figure 11) [13].
Figure 9. Gap between the actual population and (Rank –Size Rule) for cities of province of Babylon (2018)
Figure 10. AL-Iskandaria city 2013
Figure 11. AL-Iskandaria city 2015
7.1 First stage: Contraction stage (2013-2015) (Table 2 and Figure 12)
Table 2. The contraction stage (2013-2015)
|
Optimal Population Size 2015 |
Population Size 2015 |
Population Size 2013 |
|
212,425 |
132,953 |
157,381 |
Figure 12. Towards the left great end
7.2 Second stage: Economic Development Stage (2015-2018) (Table 3 and Figure 13)
Table 3. Economic Development Stage (2015-2018)
|
Optimal Population Size 2018 |
Actual Population Size 2018 |
Population size by growth rate 2018 |
Population Size 2015 |
|
291,023 |
165,946 |
144,917 |
132,953 |
Figure 13. Towards the right great end
1. Each city has Economic energy that may be available represented by Investment, or Potential energy represented by natural resources, Spatial characteristics, and Population Size.
2. Determining the Optimal Size of Cities is represented by the direct relationship between the Population Size and the Resources (actual or potential).
3. The Optimum City Size depends on directing the economic development of the spatial sectoral organization in proportion to the capabilities of the city within the framework of urban, regional and national balance.
1. The necessity of developing long-term economic development plans that aim to develop medium-sized cities.
2. Maintaining a degree of balance between the large volume of Production and the large volume of consumption in order to continue economic prosperity and according to the spatial level of the city.
3. Maintaining the Continuity of the city at the Optimal Size to avoid spatial concentration on the traditional large cities. this led to the duality of sectoral and spatial development.
[1] Cheng, Y., Ma, C. (2017). Rethinking the Opti city size from the perspective of the city network. Open Journal of Siences, 5(5): 134-145. https://doi.org/10.4236/jss.2017.55010
[2] Maroof, H. (2006). Urban and Regional Economic Analysis. Dar Safa. Amman, Jordan, 207-209.
[3] Ayasreh, T. (2014). The geographic of urban system in Jordan. Research Human and Social Sciences Journal, 41(2): 411-436.
[4] Salim, A.A. (2014). Cities, Inflation, Negatives and Planning. First Edition, Amman, Dar Safaa Publishing and Distribution, 500.
[5] Alden, S., Michael, J. (1990). Optimal city size and population density for the 21st Century. NPG from Serious, 5-8.
[6] Bogue, D.J., Anderton, D.L., Barrett, R.E. (2010). The Population of the United States. Simon and Schuster Publishing, 3rd Edition, 329-340.
[7] Sullivan, A.O. (2007). Urban Economics. Mc Graw- Hill and Lrwin, New York, 5-7.
[8] Gleave, D., Marttyn, C.H. (1977). Migration dynamics and Labor market turnover. Progress in Planning, 8(1): 175-183. https://doi.org/10.1016/0305-9006(77)90011-3
[9] Edwin, A. (2014). Stratigic impact of inward foreing direct investments on the labor markets of developing economies. Journal of Management, Marketing & Logistics, 1(4): 297-310. https://dergipark.org.tr/en/pub/jmml/issue/32445/360813.
[10] Johnston, J. (1982). The American Urban System: A Geographical Perspective. Longman, London St. Martin's New York, 322-325.
[11] Republic of Iraq, Babylon Province, General Directorate of Urban Planning, 2017.
[12] Republic of Iraq, Ministry of Planning, Central Statistical Organization, Annual Statistical Abstract 2013-2015, 233-272.
[13] Republic of Iraq, Ministry of Planning, Central Statistical Organization, Annual Statistical Abstract, 2018, 276.