Dhreti Cesta Wijayanti | Khoirunurrofik Khoirunurrofik*
© 2022 IIETA. This article is published by IIETA and is licensed under the CC BY 4.0 license (http://creativecommons.org/licenses/by/4.0/).
OPEN ACCESS
Vertical building development has become a strategic solution in accommodating the need for living and working spaces in DKI Jakarta with its land scarcity issues. As a response to the increasing demand for space, the government and experts constantly update the strategic policies for high-rise building development while the developers plan and construct more buildings for business purposes. This study aims to investigate the economic and non-economic factors that affect the development of high-rise buildings and the relationship between the agglomeration of high-rise buildings and the tertiary sector GRDP. To achieve these objectives, we primarily use the data of the number of floors of high-rise buildings collected from Emporis. Other variables are retrieved from the secondary data collected from the official data of the DKI Jakarta government. Pooled OLS estimation of panel data in the 2007-2018 urban village level proves that the strategic interactions occur during the construction of commercial-office and residential high-rise buildings in DKI Jakarta. The estimation result at the city level provides evidence that the presence of commercial-office high-rise buildings in DKI Jakarta generates effective density as it contributes positively to the tertiary sector GRDP. This study provides a new perspective in examining the relationship between the agglomeration of the economy and high-rise buildings in third-world cities, in this case, DKI Jakarta, by using quantitative research through econometric models.
agglomeration, commercial, density, high-rise building, office, residential, skyscraper, tertiary sector GRDP
As a capital city, Jakarta has a crucial role in controlling the national economy. Central Bureau of Statistics [1] reported that the capital city shares the most prominent economic contribution to the country, around 17 to 18 percent of the total national gross domestic product (GDP), compared to other 33 provinces across Indonesia. Jakarta’s strategic role in generating significant economic contributions highlights the importance of investigating possible supporting factors to accelerate Jakarta’s economic growth. The capital city’s economy is dominated by the tertiary sector, contributing to 78 percent of GRDP in 2018. This tertiary sector, incorporating financial services, stimulates the concentration of economic activities in the form of agglomeration, demanding commercial and office spaces in high-rise buildings.
Vertical building development, particularly in the form of high-rise buildings is highly demanded in the capital city, especially for accommodating the increasing city population and addressing the issues of land scarcity. The city government has to keep up with the fast-paced building development by making renewals of land zoning and building regulations. The regulations regarding floor area and building height limitations have been implemented since the construction of the first high-rise building in DKI Jakarta, in the 1960s. This policy has continued to be carried out to achieve effective spatial planning in pursuing sustainable development goals (SDGs).
Some studies have discovered the relationship between the presence of high-rise buildings and urban agglomeration [2-7]. In these studies, an urban agglomeration is largely affected by economic agglomeration and density agglomeration. Economic agglomeration is a spatial deposition of various economic activities in an area [8]. The urban agglomeration in DKI Jakarta occurs in line with the increase in the population of the capital city, which causes an increase in the local economic activities. The increasing local economic activities create the clusters of economic centers which are today known as Central Business Districts (CBDs). The high-rise building is a physical form of spatial accommodation of economic activities in the CBD. There are economic sectors that are accommodated explicitly by high-rise buildings, particularly businesses that are based on services, such as finance, leasing, and other services that are included in the tertiary sector businesses.
Based on the GRDP, the economy of DKI Jakarta is largely dominated by the contribution of the tertiary sector with 78 percent of GRDP in 2018. The tertiary sector is dominated by the economic activities in the service and finance subsectors; therefore, the agglomeration of the economy happens largely in high-rise buildings as the place that accommodate the economic activities in the service sector. As observed in Figure 1, the agglomeration of tertiary sector economic activities is specifically accommodated in the zone allocated for office, trade, commercial, and service building function in the provincial government land use planning map. From the figure, we can also infer that the office, trade, and service building function zoning is spread into various densities in each village and municipality.
Source: DKI Jakarta Government
Figure 1. The city zoning masterplan of DKI Jakarta in 2030
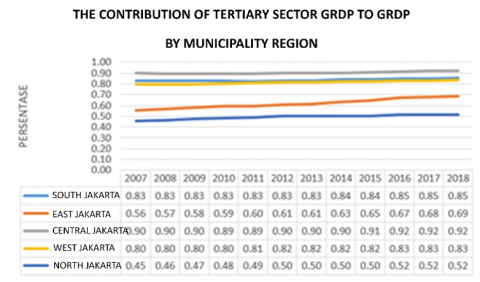
The contribution of tertiary sector GRDP is varied across the region. The municipalities that are planned as Center Business Districts (CBD) with a higher number of high-rise buildings generate a higher contribution of tertiary sector GRDP. In this case, the tertiary sector of Central and South Jakarta generates the highest contribution to GRDP of each region, as we can see in Figure 2. The graph shows that the tertiary sector of Central Jakarta signifies the highest contribution to the GRDP of Central Jakarta with an average of 90 percent from 2007 to 2018, followed by South Jakarta with an average of 83 percent. This research defines GRDP by classifying it into 5 subsectors: 1) electricity, gas, and water; 2) trade; 3) hotel and restaurant; 4) freight and communication; 5) finance, rental, and services. All of the tertiary GRDP subsectors are assumed to be accommodated by high-rise buildings.
In investigating the relationship between high-rise buildings, density, and economic agglomeration, Barr [2-4] discovered the ‘strategic interaction’ theory, meanwhile, Buchanan [6] proved the occurrence of ‘effective density. Strategic interaction is the interaction that occurs between the developers in constructing high-rise buildings. The findings proved that the high-rise buildings “interact” with each other through the height competition. This condition occurs when the height and density (indicated by the number of floors) of the newly built high-rise buildings are defined as a positive response to the height and density of the previously built high-rise buildings. In addition, the location and the height decision of every building construction are determined by the strategic locational factors of an area [2, 3, 5]. Therefore, the strategic interactions between the buildings supported by strategic locational factors can determine the height and density of the new high-rise buildings.
Source: Statistics Indonesia
Figure 2. The contribution of the tertiary sector to GRDP
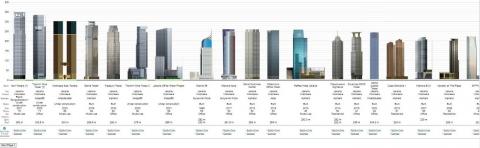
Source: CTBUH
Figure 3. The tallest building of DKI Jakarta
Jakarta has 1327 completed high-rise building units based on the high-rise building definition used in this study. This number of commercial offices and residential dwellings indicate the primary functions of the high-rise buildings. They are not commonly utilized for other functions. As this study focused on commercial offices and residential buildings in Jakarta, it excluded other public buildings such as churches and schools. The average height of a typical building for different functions is under 12 floors, meaning that such construction is inadequate to be categorized as a high-rise building based on the definition used in this research. As Figure 3 illustrates, Gama Tower was the tallest building in 2020, functioning as a hotel and an office. The other tall buildings serve as offices, commercial buildings (hotels or malls), and residential spaces. In other words, our data suggested that the functions of the buildings essentially serve tertiary sectors, including trading, hotel, restaurant, freight, communication, finance, rental, and service.
We analyzed our data through a strategic interaction technique comprising commercial offices and residential lodgings. Fujita and Ogawa [8] propose the concept of a city’s spatial configuration as the result of the companies’ and households’ interactions, known as strategic interactions. This interaction occurs when companies tend to choose a location for a building in the existing economic agglomeration area. Based on this premise, the new office and commercial buildings respond to the previously built office and commercial buildings in the same area [2]. Likewise, the distribution of buildings for residential spaces tends to be located within a certain proximity from the commercial office buildings to reduce workers’ transport expenditures. Guan’s [9] finding suggested that the proximity between residential and commercial buildings is driven by an economic reason: reducing transport expenses. As a result, building agglomeration occurs and creates clusters in certain areas.
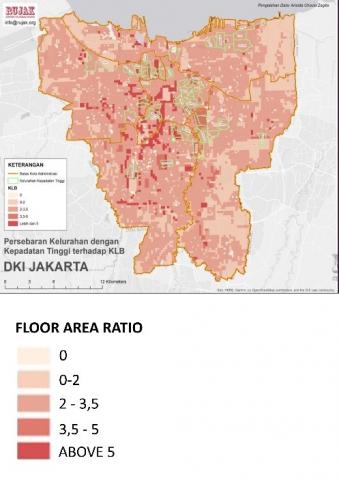
Source: Rujak Center of Urban Studies
Figure 4. Floor area ratio of the existing buildings
Figure 4 shows the mapping of building density based on the Floor Area Ratio (FAR) of the completed buildings in DKI Jakarta. The area with the darkest red color indicates that the area has FAR 3.5 and above which means it is classified as a potential area for high-rise buildings. The zone with a 3.5 FAR index means that the building in the area plotted on the zone has a maximum total floor area equal to or below 3.5 times the land lot area. The zoning in every land lot plotted by the government will define the building density in the future.
There has been no previous study of DKI Jakarta that investigate the relationship between the density clusters and the economic growth. This study analyzes the relationship between the building density clusters at the urban village as well as city levels, and the economic growth. Since there is no available valid FAR data within the period of this research, the data of the total number of floors and building height are used as the representation of the building density indicators.
Effective density (Effective density is a measure of density that was defined by the DfT. It takes into account changes in i) employment density and ii) accessibility of jobs. If either of these two factors increases, effective density will also increase.) is a condition when the existence of agglomeration of buildings and workers at a certain period triggers a positive impact on the city's productivity [6]. The increasing city productivity may indicate an increase in the effective density with the increase in building and employment density. Buchanan [6] and Curci [7] define ‘agglomeration benefit’ as the added value in form of increased productivity for each additional unit of building and employment density.
We conducted this study in two phases. The first phase was done in the urban village to investigate the strategic interactions among high-rise buildings (commercial offices and residential functions) in Jakarta urban village. The second phase was completed on the city level to substantiate the effective density, as building and employment density positively impact GRDP in the tertiary sector. Thus, this study aimed to 1) analyze the economic and non-economic factors determining the high-rise building agglomeration in Jakarta, and 2) analyze the impact of the high-rise buildings and employment agglomeration in generating effective density in the city. We deployed econometric models as a panel dataset from 2007 to 2018.
In order to address the research objectives, we start by reviewing literature related to the relationship between high-rise buildings and the economy. Skynomics – a word coined by Jason Barr [2-5], is a study investigating the economic causes and consequences of high-rise buildings. From this concept, many researchers investigated the economic determinants of the construction of high-rise buildings. Several studies related to skynomics have proven that the height of high-rise buildings is a form of response to the changes in the national business cycle (Gross Domestic Product). Skynomics research has been conducted by Barr [2-5, 10, 11] using various economic variables as determinants of the density and height of high-rise buildings. Barr (2010, 2013, 2018) in his skynomics studies separated the FIRE (Finance, Insurance, Real Estate) sectors from the service-based economic activities as the main sectors that are specifically accommodated by commercial-office high-rise buildings. In these empirical studies, Barr found that the increase in the level of productivity and employment in the FIRE sector had a positive effect on the number of construction and height of high-rise buildings. This is because of the continuity of production activities and the presence of workers in the area act as the determinants of the demand for the supply of spaces in a high-rise building. Higher demand for space would trigger an increased supply of high-rise buildings in the area. This indicates that economic agglomeration has a positive effect on the agglomeration of high-rise buildings. Therefore, in this study, the tertiary sector GDRP is used as the representation of economic agglomeration in high-rise buildings.
High-rise buildings depict both urban density and economic agglomeration. Buchanan [6], Curci [7], and Liu et al. [12] employ high-rise buildings as the representation of economic agglomeration. The construction of high-rise buildings occurs simultaneously with the economic agglomeration due to the potential capacity of high-rise buildings to accommodate the high density of workers. The density of workers in an area is a demand factor for the construction of high-rise buildings.
Effective density is a term used by Buchanan [6] to indicate the positive impact on economic growth generated by the buildings and workers’ density. Buchanan argued that agglomeration benefit represents every increase in economic growth in the tertiary sector due to a rise in each unit of employment and high-rise density. Agglomeration benefit is an indicator of the effective density of a city generated by a certain proportion of employment and high-rise building density [6, 7]. In his London-based study, Buchanan [6] projected a doubling of the labor density in a high-rise building leading to a 12.5% increase in the area’s productivity. In the service sector, the increase in productivity had a higher impact.
Meanwhile, Curci [7] confirms that the impact of workers’ density and new high-rise buildings differs between sectors. Sectors related to the production of goods, such as manufacturing and construction, are not affected by the construction of new high-rise buildings. However, the service sector, employing more highly skilled human capital such as finance and insurance, is significantly impacted by high-rise buildings. These findings demonstrated that effective density represents a condition when employment and building density positively impact the tertiary sector growth of an area or a city.
Fujita and Ogawa [8] proposed a notion of strategic interaction concerning the spatial configuration of a city which occurs because of the interaction between companies and households. This interaction occurs when firms tend to have a higher locational preference for the area with an existing economic agglomeration. The firms emerging in a particular area attract households to build their residences nearby, which is why the residential developers tend to construct residential spaces within relative proximity to the labor distribution of the firms. In other words, strategic interaction is the ‘interaction’ between high-rise building developers for specific functions deciding the building height and density. This definition can be exemplified through the size and density of the new high-rise buildings responding to the height and density of the formerly built high-rise buildings. The building height decision may also depend on other potential location factors, such as the proximity to transportation facilities [2-5].
Numerous studies have found that the agglomeration of high-rise buildings is inseparable from the proximity between buildings as a contributing factor. The distance to the transportation facilities is crucial in determining the strategic location. This issue applies to high-rise buildings with various functions: offices, shops, and residences. Glaeser and Gottlieb [13] explained the concept of place attractiveness as the effect of agglomeration, which happens when the urban agglomeration becomes attractive to future residents. In this concept, the high-rise buildings represent urban density. The proximity of high-rise buildings representing the urban density to the existing service providers implies the high possibility of cost reduction for transport. Therefore, the agglomeration of high-rise buildings in a particular area may reduce transport budgets for producers and consumers because of their closeness [9, 14, 15]. In other words, economic fundamentals or profit-based motivations cause the agglomeration of high-rise buildings in a particular area following the city and industrial life cycle [14, 15].
3.1 Data
To be able to answer the research objectives, we use sets of data that can be classified into different categories. We categorize the data into data of high-rise building agglomeration, employment density, economic agglomeration, and strategic locational factors. Some of the data are also further divided into several variables. Firstly, in order to formulate the econometric model, all of the data are sorted and processed into panel data for the period of 2007 to 2018. In investigating strategic interaction, the data are divided into 261 urban villages in DKI Jakarta. The data are also divided into 5 (five) municipalities of DKI Jakarta to capture effective density on a larger scale.
The high-rise building agglomeration variable is represented by the average number of floors and the highest floor level of the buildings. We collected the secondary data from Emporis, a global provider of building information, especially for high-rise buildings around the world. Emporis has defined its standards for the categories of high-rise buildings worldwide [16]. In this research, we use the definition of high-rise building which consists of two categories, namely high-rise buildings and skyscrapers. A building structure with 12 to 40 floors is categorized as a high-rise building, meanwhile, a building with an architectural height of at least 100 meters is defined as a skyscraper. This study involves both categories of high-rise buildings and skyscrapers as part of the high-rise building data.
The demographic and economic data in this study are collected from the published official data of Statistics Indonesia (BPS). Meanwhile, employment density is collected from the demographical data that have been processed from the official publication of the National Labor Force Survey (Sakernas) for the Jakarta municipality level. The employment density data is processed from the number of the working residents whose ages are above 15 years old divided by the municipality land area in kilometer square.
The economic agglomeration is represented by the data of Gross Regional Domestic Product (GRDP) and the tertiary sector GRDP. In this research, we use the annual data of constant price GRDP of DKI Jakarta at the municipality level. The tertiary sector GRDP is the accumulation of gross value added of the products from 5 subsectors: electricity, gas, and water; trading; hotel and restaurant; freight and communication; and, finance, rental, and services. All of the tertiary GRDP subsectors are assumed to be accommodated by high-rise buildings.
The strategic locational factor variable is indicated by the number of nearest public transportation infrastructures, measured from the building location. The transportation infrastructures consist of Mass Rapid Transit (MRT) station, Bus Rapid Transit (BRT) station, and Light Rail Transit (LRT) station.
3.2 Research methods
Based on the research objectives and literature review, this research is divided into three parts of analysis, with the following initial hypotheses:
(1) Strategic interactions affect the number of floors or the height of commercial-office high-rise buildings.
(2) Strategic interactions affect the number of floors or the height of residential high-rise buildings.
(3) Effective density occurs, or the presence of high-rise buildings has a positive effect on the tertiary sector GRDP.
This study employed the data representing economic agglomeration at the city level, namely GRDP and GRDP in the tertiary sector. The agglomeration of high-rise buildings was defined by the data on high-rise buildings obtained from Emporis and processed into several variables according to the research necessities. In addition, labor data were used to describe the demand for high-rise buildings, and transportation data were utilized as strategic support for the region. The panel data were from 2007 through 2018 and split into five municipalities (kotamadya). Some variables were constructed from the data at the urban village level to confirm the hypotheses. All variables are described in Table 1.
Table 1. Variable descriptions
|
|
Variable |
Variable Code |
Description |
Source |
|
GRDP |
|
|
|
|
|
1. |
GRDP of the tertiary sector at constant Prices for 2000 in municipality i and year t |
LGDRP_ter |
Natural logarithm of GRDP tertiary sector from 5 sub-sectors: Electricity, gas, and clean water; Trade, Hotel, and Restaurant; Transport and communication; Finance, Leasing, and Corporate Services; Services. |
Jakarta in Figures, BPS DKI Jakarta Province 2007-2018 |
|
2. |
Percentage of tertiary sector GRDP to municipal GRDP in municipality i and year t |
percent_tertiary |
Data unit: Million Rupiah. Data unit: percentage |
Jakarta in Figures, BPS DKI Jakarta Province 2007-2018 |
|
3. |
GRDP at constant Prices for 2000 in municipality i and year t |
LGRDP |
Natural logarithm of GRDP value at constant prices per municipality. Data unit: Million Rupiah. |
Jakarta in Figures, BPS DKI Jakarta Province 2007-2018 |
|
4. |
GRDP at constant Prices for 2000 in municipality i and year t -2 |
LGRDP_2
|
Natural logarithm of GRDP value at constant prices per municipality with 2 years lag. Data unit: Million Rupiah. |
Jakarta in Figures, BPS DKI Jakarta Province 2007-2018 |
|
5. |
GRDP at constant Prices for 2000 in municipality i and year t -1 |
LGRDP_1 |
Natural logarithm of GRDP value at constant prices per municipality with two years lag. Data unit: Million Rupiah. |
Jakarta in Figures, BPS DKI Jakarta Province 2007-2018 |
|
|
Employment |
|
|
|
|
1. |
Employment density in municipality i and year t |
Lemp_density |
The natural logarithm of the number of working people of the productive age divided by the area of the municipality. Data units: number of people per square kilometer |
Jakarta in Figures, BPS DKI Jakarta Province 2007-2018 |
|
2. |
The number of working residents in municipality i in year t-1 |
Lemp_total2 |
Natural logarithm with a lag of 2 years from the total population of productive age working in a municipality. Data unit: person |
Jakarta in Figures, BPS DKI Jakarta Province 2007-2018 |
|
|
High-rise Building |
|
|
|
|
1. |
The average number of floors built for office and commercial buildings in sub-district i and year t |
LAVG_off |
Natural logarithm of the average number of floors built for office buildings and commercial functions in Sub-district I and year t. Data unit: building floor unit |
Emporis |
|
2. |
The highest floor of office and commercial buildings built in sub-district i and year t |
Lhighest_off |
Natural logarithm of the highest floor of office and commercial buildings built in Sub-district I and year t Data unit: building floor unit |
Emporis |
|
3. |
The average number of floors built for residential buildings in Sub-district i and year t |
LAVG_resid |
The natural logarithm of the average number of floors built for residential buildings in Sub-district I and year t Data unit: building floor unit |
Emporis |
|
4. |
The highest floor residential built in sub-district i and year t |
Lhighest_resid |
Natural logarithm of the highest residential floor built in sub-district i and year t. Data unit: building floor unit |
Emporis |
|
5. |
The average number of floors built for the overall function of the building, in sub-district i and year t-2. |
LAVG_allbuild2 |
Natural logarithm of the average number of floors of high-rise buildings of all functions built with a lag of 2 years in sub-district I and year t. Data unit: building floor unit |
Emporis |
|
6. |
The highest floor of all building functions built in sub-district i and year t-2 |
Lhighest_allbuild2 |
Natural logarithm of the highest floor among all building functions built with a lag of 2 years in sub-district I and year t. Data unit: building floor unit |
Emporis |
|
7. |
Sub-county-level commercial-office building dummy |
dum_AVGoff2 |
Dummy variable, 1 if the average high-rise building has more commercial office functions built; 0 if more functional buildings are built. Interacted with the variable average number of commercial-office floors. |
Emporis |
|
8. |
Sub-county-level residential building dummy |
dum_AVGresid2 |
Dummy variable, 1 if the average high-rise building has more built residential functions; 0 if more functional buildings are built. Interacted with the variable number of residential floors. |
Emporis |
|
|
Transportasi |
|
|
|
|
1. |
Total transportation infrastructure in sub-district i |
Ltrans |
Natural logarithm of the number of infrastructures (shelters) transportation: KRL, MRT, and BRT, within a radius of one sub-county. Data units: Number of shelter units |
Maps.google.com |
3.2.1 Strategic interaction of commercial-office high-rise buildings
The first analysis aims to prove that strategic interactions are the cause for the agglomeration of new commercial-office high-rise buildings. Through the importance of this analysis, estimations are carried out using two dependent variables that define the quantity of constructed space in high-rise buildings as the model proposed by Barr and Luo [5]. The two dependent variables consist of the average number of floors (LAVG_off) and the highest floor (Lhighest_offit) of commercial and office high-rise buildings built in a certain area in one year. Analysis with pooled OLS estimation method is carried out using robust standard error, to minimize the effect of heteroscedasticity. As a result, the model is structured as follows:
$L A V G_{-}$of $f_{i t} =\beta_{0}+\beta_1 L A V G\_allbuil2_{i t-2}$
$+\beta_2$ dum_AVGoff $2_{i t-2}$$+\beta_3$ Lemp_total2 ${ }_{i t-2}$
$+\beta_4percent\_tertiary_{i t}$$+\beta_5$$LGRDP\_1_{it-1}$$+\beta_6$ $LTrans+\mathcal{E}_{i t}$ (1)
The dependent variable is investigated with the main explanatory variable, the average number of floors of high-rise buildings of all functions with a lag of 2 years in the construction period ( LAVG_allbuil2 and the dummy variable for commercial-office construction (dum_AVGoff2. The main explanatory variables of economic agglomeration are the total contribution of the tertiary sector (percent_tertiaryit) as a representation of economic agglomeration that is accommodated by high-rise buildings, the number of regional workers (Lemp_total2 , and the GRDP as a representation of the regional economy. The strategic location variable that we use is the number of transportation infrastructures within a radius of one sub-district (LTrans).
Next, the same set of variables is used to illustrate the existence of strategic interactions, in terms of competition between developers in creating the highest commercial-office high-rise building, among others.
$Lhighest_{{off }_{i t}}=\beta_0+\beta_{12}$ $Lhighest_{{allbuild2 }_\quad{ it-2 }}$
$+\beta_{22}$ dum_AVGoff $2_{i t-2}$$+\beta_{32}$ Lemp_total$2_{i t-2}$
$+\beta_{42}$ percent_tertiary ${ }_{i t}$$+\beta_{52}$ LGRDP_$1_{i t-1}+\beta_{62}$ LTrans$+\mathcal{E}_{i t}$ (2)
Therefore, we use the data set of the highest commercial-office high-rise buildings completed in one year and one sub-district as the dependent variable. The competition among developers will be observed using the model estimation. The hypothesis will be proven true if the estimation result shows the height of new buildings is a form of a positive response to the height of the previously built buildings.
3.2.2 Strategic interaction of residential high-rise buildings
The second analysis is carried out to prove that the agglomeration of the new residential high-rise buildings in a certain area occurs in line with the demand for housing generated by human or economic activities within the surrounding high-rise buildings. We adopted the following formula based on Fujita and Ogawa's theory [8].
$\begin{aligned} \text { LAVG_resid }_{i t}=& \beta_0+\beta_{13} d u m_{-} \text {AVGresid } 2_{i t-2}+\beta_{23} d u m_{-} A V G o f f 2_{i t-2} \\ &+\beta_{33} \text { LGRDP_2 }+\beta_{43} \text { LTrans }+\varepsilon_{i t} \end{aligned}$ (3)
The occurrence of strategic interactions in this model is tested with the main independent variables that represent high-rise buildings and economic agglomeration, as well as control variables that represent regional economic supporting facilities. To prove the hypothesis, this model uses the main explanatory variable in the form of dummy variables for residential and commercial buildings with a lag of two years. The imitation of residential buildings is coded as 1 if the newly-built high-rise buildings with two years lags in one year period has more residential function than commercial-office, zero if otherwise (dum_AVGresid2). The commercial dummy is 1 if by the two years lag and in one year, there are more new-built commercial-office buildings in a sub-county, 0 if otherwise (dum_AVGoff2).
The representative variable of economic agglomeration is GRDP. GRDP is a representation of potential economic activities at the city level. As stated in the theory of Fujita and Ogawa [8], residential buildings tend to respond to economic activity as a whole, not only in certain sectors. Therefore, we use GRDP for all sectors at the city level (LGRDP_2).
We adopted the estimation technique from Buchanan [6], who defines public transport facilities as strategic locational support, and we used the number of transportation infrastructures within a one-sub-district radius (Ltrans).
To investigate developers’ tendency to compete in constructing the highest residential building, we used the highest number of floors of residential buildings in one year in sub-districts as the dependent variable. The following formula demonstrates the estimation of the independent and control variables.
$Lhighest\_resid_{i t}=\beta_0+\beta_{14}$ $Lhighest\_allbuild 2_{i t-2}$ $+\beta_{24}$ $LTrans_{i t-2}+\beta_{34} L G R D P_2+\varepsilon_{i t}$ (4)
The model is adapted from Barr [2], who found that there was a positive relationship between the new highest building height with the previous highest building. Therefore, we use the height of the highest building for all functions with two years lag as the main explanatory variable, to measure the impact of the height decision of residential high-rise buildings.
3.2.3 Effective density: The impact of the agglomeration of high-rise buildings on the tertiary sector GRDP
We do the third analysis to find out the occurrence of effective density in DKI Jakarta: the condition when the commercial-office high-rise buildings and employment density have a positive effect on the development of the tertiary sector GRDP.
$LGRDP\_ter _{i t}=\beta_0+\beta_{15}$ $LAVG\_{of}$ $f_{i t}+\beta_{25}$ $LAVG\_allbuild_{i t}$ $+\beta_{35}$ $Lemp\_dens_{i t}$
$+\beta_{45}$ $LGDRP\_ter 2_{i t-2}$$+\beta_{55}$ GRDP $i t+\beta_{65}$ $Ltrans_{i t}+\varepsilon_{i t}$ (5)
Curci [7] used the growth of the tertiary sector as a representation of the agglomeration benefit. For this reason, the data of tertiary sector GRDP (LGRDP_ter) is used as the dependent variable, of which every increasing unit by the estimation is considered as an agglomeration benefit. Pooled OLS estimation is run by including robust standard error. Panel data is obtained by combining all-time series and cross-section data from five municipalities in DKI Jakarta from the 2007 to 2018 period.
In this model, the capital variable is represented by the average number of floors of high-rise buildings as an input factor for company capital (LAVG_off). The average number of floors of high-rise buildings with office and commercial functions built in one year in each municipality (average_office) is one of the main explanatory variables of this equation. This variable is considered capable of explaining its function as an input factor to produce the tertiary sector in the GRDP. The primary explanatory variable is the average number of floors for constructing all building functions (LAVG_allbuild). In addition, we deployed two control variables: the GRDP of the tertiary sector in the previous two years and the whole sector in the GRDP [5] and the number of public transportation facilities in one sub-district (Ltrans).
4.1 Strategic interaction of commercial-office high-rise buildings
Building on the models mentioned above, we discovered that in terms of high-rise commercial office buildings, the strategic interaction occurs among buildings and other supporting factors, as described in Table 2. The strategic interaction is revealed by the positive relationship between the average number of floors of the new high-rise buildings and the average number of floors built in the previous two years. The result shows that a one percent increase in the average number of floors of buildings for all functions from the last two years creates a significant increase (0.26 percent) in the average number of floors of the new high-rise commercial office buildings.
The impact of the dummy variable shows a tendency for high-rise commercial office buildings to agglomerate with the previously built building by the same function. This impact is evidenced by a significant increase (0.06 percent) in the newly built commercial office with an average number of floors if the construction of high-rise commercial office buildings dominates the construction activities (or a more significant number of floors than other functions) in the previous two years. This result shows a close relationship between the agglomeration of high-rise buildings and the agglomeration economies. Both types of agglomeration create a strategic interaction.
Another result verifies a tendency among developers to compete in constructing the tallest building. This tendency is recognized when the strategic interaction between buildings also affects the number of floors of the highest commercial office building. There is a significant increase (0.31 percent) in the new highest commercial office building with the tremendous number of floors, as an effect of every one percent increase in the previous highest building’s floor quantity.
The significant impact of the total employment variable substantiates local workers’ demands for the high-rise commercial office buildings. The variable of total employment has a significant positive effect on the average number of floors and the tallest commercial office building. Barr [2, 3] also discovered that the number of workers in a particular area represents the demand for the provision of high-rise buildings. This demand can determine the behavior of developers in a specific area. Developers of high-rise commercial office buildings tend to maximize the construction profits by increasing their buildings’ floor numbers. This method will be effective if implemented in a high potential area or area with a high demand for high-rise buildings. To respond to the land scarcity issues, building vertical space is the only approach to accommodating the demand and maximizing profit.
Another economic variable, tertiary sector contribution to GRDP, positively impacts the dependent variable: the average number of floors of new high-rise buildings. The relationship between high-rise buildings and agglomeration economies is also shown by the positive impact of GRDP on the average floor number of high-rise commercial office buildings. Interestingly, the number of public transportation infrastructures plays a prominent role in determining the significance of the economic variable’s impact. This impact is caused by the higher the number of public transportation infrastructures in a particular location, the more attractive the place is for developers to construct buildings as they can attract huge crowds [9].
This research found that strategic interactions affect the number of floors and the tallest high-rise commercial office buildings. High-rise buildings are also closely related to agglomeration economies. The estimation results indicate this relationship that the variables of the average number of floors of the previously built high-rise commercial office buildings and the contribution of the tertiary sector to the GRDP create positive impacts on the dependent variable: the average number of floors of new high-rise buildings. Strategic interactions also create competition among developers in constructing the tallest building [2, 5]. Transportation infrastructure is essential in encouraging economic agglomeration to contribute positively to the agglomeration of high-rise buildings.
4.2 Strategic interaction of residential high-rise buildings
The second analysis examines the strategic interactions among developers of high-rise residential buildings. This analysis aims to confirm the hypothesis that high-rise residential building development occurs as a positive response to housing demand generated by human or economic activities in a specific area. Based on the theoretical studies [8], it is assumed that the residential high-rise buildings coincide with the economic agglomeration of the high-rise commercial office buildings and are generated by other economic and strategic locational factors.
The models used in the second analysis have substantiated strategic interactions between developing high-rise commercial offices and residential buildings. The results show that the higher the average number of floors of commercial buildings previously built in one area, the higher the number of floors of a residential building in that area. Meanwhile, residential development tends to follow commercial office development.
The estimation result in Table 3 shows that the existence of commercial office buildings generates a higher impact on the new residential building development than the previously built residential buildings. In other words, it is shown that the agglomeration economies in commercial office buildings attract new high-rise residential buildings. The development of new residential buildings responds to the housing demand generated by workers in the commercial office buildings. The existence of high-rise commercial office buildings is one of the determining factors for the need for residential buildings. The results show a significant positive impact of the dummy variable on the commercial office buildings, which is higher than the impact of the dummy variable on the residential buildings. This trend implies that the more commercial office buildings built within the previous two years, the more residential buildings constructed in the current year. It also signals a strong interaction between the development of residential buildings and the increasing economic activities in the commercial office buildings within the area. It is a strategic move for developers to address the housing demand by constructing high-rise residential buildings within a particular juxtaposition to the site where the previously developed commercial office buildings and the economic agglomeration were located.
The significant positive impact of GRDP, as the economic agglomeration variable, on the development of high-rise residential buildings shows a strong relationship between both variables. The estimation results indicate that for every one percent increase in GRDP, there will be an increase in the average number of floors of high-rise residential buildings by 0.36 percent and an increase in the height of the tallest high-rise residential buildings by 0.31 percent. Residential development and density in high-rise buildings result from the agglomeration economies in every sector, requiring workers’ settlements to be nearby the working places. This result illustrates how firms agglomerate with households.
The strategic location support variable contributes significantly to the agglomeration of high-rise residential buildings. The results show that for each one percent increase in the total number of public transport infrastructures, the average number of floors of high-rise residential buildings will increase by 0.163 percent, and the height of high-rise residential buildings will increase by 0.158 percent. The closer a location is to various public transport infrastructures, the higher density of the constructed high-rise residential buildings will be.
The estimation results align with the rationale of the strategic interactions between the commercial office and residential buildings proposed by Fujita and Ogawa’s theoretical concept [8]. They discovered that the spatial configuration of a city is the result of the interactions between companies and households. Companies have specific preferences for locations with previously existing economic agglomeration areas. Accordingly, the construction of the residential building in this area subsequently follows such preferences to emulate the pattern of the labor distribution of the companies. The proximity between households and companies is mainly stirred by reducing transportation costs and other additional work-related travel expenses.
Further interactions between companies and households in land consumption transpire when households supply labor as a company resource. In contrast, companies pay wages as a return for the resource to the households. This type of interaction is categorized as an inter-sectoral interaction; meanwhile, in-sectoral activity emerges when firms acquire each other and agglomerate the economies. Through these interactions, both companies and households act as consumers of land.
4.3 Effective density: The impact of high-rise buildings on GRDP of the tertiary sector
Table 4 provides the third analysis exploring the effectiveness of the existing high-rise buildings at the city level, based on their impact on the city’s productivity. The density of the population of high-rise buildings (represented by the number of floors) indicates a positive relationship between regional workers’ density and the growth of GRDP in the tertiary sector. The increase in GRDP in the tertiary sector is due to the increase in density, categorized as the agglomeration benefit.
Table 2. Strategic interaction of commercial-office high-rise building estimation result
|
|
(1) |
(2) |
(3) |
(4) |
(5) |
(6) |
(7) |
(8) |
|
|
LAVG_off |
LAVG_off |
LAVG_off |
LAVG_off |
Lhighest_off |
Lhighest_off |
Lhighest_off |
Lhighest_off |
|
LAVG_allbuild2 |
0.466*** |
0.510*** |
0.489*** |
0.255** |
|
|
|
|
|
|
(0.001) |
(0.000) |
(0.000) |
(0.030) |
|
|
|
|
|
dum_AVGoff2 |
0.0311 |
0.0326 |
0.0347 |
0.0625** |
0.0431 |
0.0451 |
0.0513 |
0.0832*** |
|
|
(0.297) |
(0.266) |
(0.234) |
(0.026) |
(0.183) |
(0.154) |
(0.104) |
(0.007) |
|
Lemp_total2 |
|
0.193 |
0.217 |
0.430*** |
|
0.243 |
0.272 |
0.498*** |
|
|
|
(0.205) |
(0.166) |
(0.002) |
|
(0.161) |
(0.117) |
(0.001) |
|
LGRDP_1 |
|
|
0.211 |
0.278 |
|
|
0.323 |
0.379* |
|
|
|
|
(0.273) |
(0.159) |
|
|
(0.119) |
(0.071) |
|
Percent_ tertiary |
|
|
0.00633 |
0.0265*** |
|
|
0.00677 |
0.0272*** |
|
|
|
|
(0.332) |
(0.000) |
|
|
(0.305) |
(0.000) |
|
LTrans |
|
|
|
0.256*** |
|
|
|
0.302*** |
|
|
|
|
|
(0.001) |
|
|
|
(0.000) |
|
Lhighest_allbuil2 |
|
|
|
|
0.472*** |
0.521*** |
0.530*** |
0.317** |
|
|
|
|
|
|
(0.002) |
(0.001) |
(0.001) |
(0.041) |
|
_cons |
1.676*** |
-1.104 |
-5.803 |
-11.19** |
1.671*** |
-1.819 |
-8.787* |
-14.27*** |
|
|
(0.000) |
(0.608) |
(0.174) |
(0.010) |
(0.001) |
(0.474) |
(0.075) |
(0.003) |
|
N |
54 |
54 |
54 |
40 |
54 |
54 |
54 |
40 |
|
adj. R2 |
0.147 |
0.159 |
0.172 |
0.459 |
0.147 |
0.168 |
0.195 |
0.477 |
Note: p-values in parentheses; *p< 0.1, **p<0.05, ***p<0.01
Source: BPS and Emporis, processed data (2020)
Table 3. Strategic interaction of residential high-rise building estimation result
|
|
(1) |
(2) |
(3) |
(4) |
|
|
LAVG_resid |
LAVG_resid |
LAVG_resid |
Lhighest_resid |
|
dum_AVGresid2 |
0.0773** |
0.0849*** |
0.0860*** |
|
|
|
(0.014) |
(0.007) |
(0.009) |
|
|
dum_AVGoff2 |
0.00951*** |
0.00939*** |
0.00863*** |
|
|
|
(0.000) |
(0.000) |
(0.001) |
|
|
LGRDP_2 |
|
0.309*** |
0.360*** |
0.314* |
|
|
|
(0.001) |
(0.003) |
(0.098) |
|
LTrans |
|
|
0.163*** |
0.158* |
|
|
|
|
(0.004) |
(0.070) |
|
Lhighest_allbuild2 |
|
|
|
0.550*** |
|
|
|
|
|
(0.000) |
|
_cons |
3.010*** |
-2.649 |
-3.675* |
-4.354 |
|
|
(0.000) |
(0.118) |
(0.098) |
(0.206) |
|
N |
205 |
205 |
125 |
33 |
|
adj. R2 |
0.074 |
0.124 |
0.178 |
0.542 |
Note: p-values in parentheses; *p<0.1, **p<0.05, ***p<0.01
Source: BPS and Emporis, processed data (2020)
Table 4. Effective density estimation result
|
|
(1) |
(2) |
(3) |
(4) |
|
|
LGRDP_ter |
LGRDP_ter |
LGRDP_ter |
LGRDP_ter |
|
LAVG_off |
0.547*** |
0.483*** |
0.104** |
0.0921*** |
|
|
(0.000) |
(0.001) |
(0.017) |
(0.004) |
|
LAVG_allbuild |
|
0.498 |
0.108 |
0.115** |
|
|
|
(0.116) |
(0.117) |
(0.013) |
|
LGRDP_ter2 |
|
|
0.236*** |
0.118** |
|
|
|
|
(0.000) |
(0.012) |
|
Lpadat_pekerja |
|
|
0.695*** |
0.561*** |
|
|
|
|
(0.000) |
(0.000) |
|
Lemp_density |
|
|
0.886*** |
0.907*** |
|
|
|
|
(0.000) |
(0.000) |
|
Ltrans |
|
|
|
0.259*** |
|
|
|
|
|
(0.000) |
|
_cons |
16.31*** |
14.89*** |
-9.334*** |
-7.391*** |
|
|
(0.000) |
(0.000) |
(0.000) |
(0.000) |
|
N |
51 |
51 |
50 |
50 |
|
adj. R2 |
0.190 |
0.223 |
0.961 |
0.982 |
Note: p-values in parentheses; *p < 0.1, **p < 0.05, ***p < 0.01
Source: BPS and Emporis, processed data (2020)
The third analysis corroborates the positive impact of the high-rise commercial office buildings and the regional workers’ density on the GRDP in the tertiary sector. This impact can be classified as effective density, where the increase in building and employment density will increase the GRDP in the tertiary sector. The increasing GRDP in the tertiary sector and increasing average number of floors of the buildings and the working population is called agglomeration benefit [6]. The joint estimation of the control variable set in Model 4 at Table 4 shows that every one percent increase in the average number of floors of high-rise commercial office buildings in a specific municipality will produce agglomeration benefits by generating a 0.09 percent increase in GRDP in the tertiary sector. Another study finding demonstrated that every one percent increase in the labor density within a municipality causes agglomeration benefits by a 0.56 percent increase in GRDP in the tertiary sector.
The results indicate that the Jakartan high-rise building construction and operation within 2017-2018 generated effective density. High-rise buildings contribute positively to the accommodated economic sectors, represented explicitly by the GRDP in the tertiary sector. Previous studies [2-4] confirmed that high-rise buildings and populations positively affect the development of GRDP in the tertiary sector. However, this positive relationship may not apply to all cities. The high-rise building development in a city likely creates ineffective density. This matter may happen when the building spaces are not optimally utilized due to the lack of supporting strategic factors in the building location, which renders the building less desirable for potential tenant applicants.
Nonetheless, the analysis in this study validates Jakarta’s experience in effective density. This analysis implies that the distribution of high-rise buildings and employment density in each area examined have been relatively effective, which can induce optimal productivity and contribute to agglomeration benefits [14, 15]. The right amount of density in a particularly strategic location provides opportunities for companies and workers to benefit from higher productivity, such as a bigger labor market, deeper product market, and knowledge spillover.
The increase in building density, represented in this study by the average number of floors, may facilitate the practice of knowledge spillover where ideas and innovation can spread faster, as well as labor pooling where companies can have more extensive selections of employees [17]. However, adequate data are required to investigate these aspects and represent labor pooling and knowledge spillover. Therefore, the pooling and the knowledge spillover are assumed to naturally occur in line with the expansion of high-rise buildings and the increase of employment density.
Effective density requires supporting strategic locational factors from economic and infrastructure aspects. The regional strategic determinants, including the indicator of economy (GRDP) and the variable of the number of public transportation infrastructures, have a significant positive effect on the GRDP in the tertiary sector. This relationship evidences each municipal area in Jakarta with a good combination of the distribution of high-rise buildings and the employment density while also being supported by sufficient public transportation infrastructures. The proper spatial configuration of the building density plots and the proximity to public transportation infrastructures can reduce the companies’ and workers’ transport expenses [6, 13]. Thus, the proximity between public transportation infrastructures and high-rise buildings can facilitate greater access to public transportation to support people and city productivity.
This study’s results demonstrated that strategic interactions occur within the development of high-rise buildings in Jakarta. The strategic interactions among high-rise buildings are inseparably entwined with an economic agglomeration. There is a continuous cycle where the previously high-rise building development and the existing economic agglomeration in a particular area will attract new high-rise buildings, creating a more significant economic agglomeration. The increase in density and economic agglomeration, resulting from strategic locational factors due to the high-rise buildings, contributes positively to the growth of the economic sector in Jakarta, particularly the tertiary sector. This finding suggested that Jakarta has managed to sustain effective density.
The first analysis proved that strategic interactions occur in developing high-rise commercial office buildings. The result showed that the development of new high-rise commercial office buildings is generated by the previously existing agglomeration of the high-rise buildings with the same function. This is because the agglomeration of existing high-rise commercial office buildings in a particular area demonstrates agglomeration economies that appeal to the new commercial office building investors. It implies a close relationship between the agglomeration of high-rise buildings and the agglomeration economies.
The second analysis revealed that strategic interactions also occur in developing high-rise residential buildings, inseparably intertwined with the supporting economic and strategic locational factors. This study uncovered that vertical residential space development and density are the market answer to the demand created by the agglomeration economies from every sector of the economy, specifically, the demand for settlements within the workplace proximity. It indicates that high-rise residential buildings respond to the housing needs generated by the firms’ local economic activities.
The finding of this study also indicated that as a supporting strategic locational factor, public transportation infrastructures have upheld their exceptional contribution to developing high-rise commercial office and residential buildings in Jakarta. The finding revealed that the proximity to the transportation infrastructures is one of the essential factors for developers in deciding the new building location and density. Thus, it is vital to integrate high-rise buildings with public transportation infrastructures to reduce transport expenses and proliferate city productivity.
The results of the third analysis confirmed that the high-rise buildings and the working population positively impact Jakarta’s GRDP in the tertiary sector. Based on these results, building agglomeration instigates increased productivity in the accommodated sectors. The increasing GRDP in the tertiary sector coincides with increasing density, called the agglomeration benefit. The positive relationships between building and employment density and city productivity indicate that Jakarta experiences effective density.
Nonetheless, the major limitation of this study is the absence of spatial analysis to examine the spatial interaction among locations. Moreover, the variables used in this research are limited to the average number of floors and height of high-rise buildings built at both village and municipality levels without considering the exact building locations. More work will need to be done in spatial analysis to describe the relationships between each building’s location, spatial pattern, character, and regional connectivity. There is, therefore, a definite need for advanced research development with spatial analysis in the future, to aid the government and city planners in city development-related decision-making.
The authors are grateful for the support of the PUTI Grant NKB-060/2022 of Universitas Indonesia and to the anonymous reviewer(s) for their valuable suggestions.
[1] Central Bureau of Statistics (BPS). (2019). Statistical Yearbook of Indonesia 2018. Jakarta. https://www.bps.go.id/indikator/indikator/view/0000/publication/5a963c1ea9b0fed6497d0845/pub_01.
[2] Barr, J. (2010). Skyscrapers and the skyline: Manhattan, 1895–2004. Real Estate Economics, 38(3): 567-597. https://doi.org/10.1111/j.1540-6229.2010.00277.x
[3] Barr, J. (2013). Skyscrapers and skylines: New York and Chicago, 1885–2007. Journal of Regional Science, 53(3): 369-391. https://doi.org/10.1111/jors.12017
[4] Barr, J. (2016). The Economics of Skyscraper Construction in Manhattan: Past, Present, and Future. International Journal of High-Rise Buildings, 5(2): 137-144. https://doi.org/10.21022/IJHRB.2016.5.2.137
[5] Barr, J., Luo, J. (2021). Growing skylines: The economic determinants of skyscrapers in China. The journal of real estate finance and economics, 63(2): 210-248. https://doi.org/10.1007/s11146-020-09764-7
[6] Buchanan, C. (2008). The economic impact of high-density development and high-rise buildings in central business districts. British Property Federation.
[7] Curci, F. (2015). The high-riser the better? Agglomeration determinants and urban structure. 5th European Meeting of the UEA: Young Scientists 2015.
[8] Fujita, M., Ogawa, H. (1982). Multiple Equilibria and structural transition of non-monocentric urban configurations. Regional Science and Urban Economics, 12: 161-196.
[9] Guan, C. (2019). Spatial distribution of high-rise buildings and its relationship to public transit development in Shanghai. Transport Policy, 81: 371-380. https://doi.org/10.1016/j.tranpol.2018.09.004
[10] Barr, J., Mizrach, B., Mundra, K. (2015). Skyscraper height and the business cycle: Separating myth from reality. Applied Economics, 47(2): 148-160. https://doi.org/10.1080/00036846.2014.967380
[11] Garza, N., Lizieri, C. (2016). Skyscrapers and the economy in Latin America. Journal of Property Research, 33(4): 269-292. https://doi.org/10.1080/09599916.2016.1224914
[12] Liu, C.H., Rosenthal, S.S., Strange, W. C. (2018). The vertical city: Rent gradients, spatial structure, and agglomeration economies. Journal of Urban Economics, 106: 101-122. https://doi.org/10.1016/j.jue.2018.04.001
[13] Glaeser, E.L., Gottlieb, J.D. (2009). The wealth of cities: Agglomeration economies and spatial equilibrium in the United States. Journal of Economic Literature, 47(4): 983-1028. https://doi.org/10.1257/jel.47.4.983
[14] Khoirunurrofik, K. (2018). Local economic structure, productivity growth, and industry life cycle: Evidence from Indonesia. Asia-Pacific Journal of Regional Science, 2(2): 453-475. https://doi.org/10.1007/s41685-018-0072-6
[15] Khoirunurrofik, K. (2020). Does the crisis change the nature of agglomeration economies in Indonesia? A productivity analysis of pre-post 1997-1998 financial crisis. Region, 7(2): 85-106. https://doi.org/10.18335/region.v7i2.308
[16] Al-Kodmany, K. (2012). The logic of vertical density: tall buildings in the 21st century city. International Journal of High-Rise Buildings, 1(2): 131-148. https://doi.org/10.21022/IJHRB.2012.1.2.131
[17] Isnaeni, N.F., Khoirunurrofik, K. (2021). The effect of knowledge spillovers and human capital through technological intensity on employment growth in Indonesia. Asia-Pacific Journal of Regional Science, 5(1): 21-39.