Fisnik Morina | Ajshe Komoni | Duresa Kilaj | Durim Selmonaj | Simon Grima*
© 2022 IIETA. This article is published by IIETA and is licensed under the CC BY 4.0 license (http://creativecommons.org/licenses/by/4.0/).
OPEN ACCESS
With this paper, we aim to analyse the effect of health expenditures and funding on the national life expectancy of OECD countries. We considered the influence of exogenous factors such as health expenditure, GDP per capita and productivity, population, infant mortality rates, potential years of life lost, deaths from cancer and the suicide rate. We used secondary data gathered between 2005 to 2018 from the annual reports of the OECD, the IMF and the World Bank. To derive the empirical results, econometric models such as linear regression, random effect, fixed effect, Hausman - Taylor Regression, GMM Model - Arellano Bond Estimation, Generalized Estimating Equations (GEE Model) and linear trend analysis through the historical and comparative method were used. Results show that health expenditures positively affect the national life expectancy of OECD countries, showing the impact and causality of national longevity in OECD countries.
health expenditure, life expectancy, health care, OECD countries, government policies
Many factors contribute to increasing levels of health spending in all developed countries. Those determinants of health expenditures include GDP growth, life expectancy, infant mortality, medical advancement, technological improvement, public funding, population ageing, alcohol consumption, tobacco consumption, and so on [1].
The population's health is under the influence of two types of health systems: 1) the Social Security Systems and 2) the National Health Services and their resources. The relationship between resources and outcomes is important to assess whether a country has a functioning health system [2].
Various authors such as Lange and Vollmer [3], Mohanty and Behera [4], and Raitano [5] analysed and explained the importance of the issue of life expectancy, health expenditure, GDP, economic growth and other variables of interest in this research.
Economic growth can give governments the means to ensure a better public health system and invest in an infrastructure that directly or indirectly affects health [3]. Healthy people can serve as a major driver for economic activities and the development of a nation. In an emerging economy, government plays an important role in providing affordable and accessible health services to its poor and needy population. In general, public health practices are necessary to implement large-scale reductions in mortality rates [4].
According to Raitano [5], in the economic policy debate, an ageing population will lead to large increases in age-related public spending - mainly pensions and health care. Most per capita health care costs are concentrated in the last years of one's life (so-called "death-related" costs). The main results obtained from studies such as those by Ahn et al. [6], Batljan and Lagergren [7], Breyer and Felder [8], Felder et al. [9] on health economics show that there is an interaction between age, proximity to death, and health care expenditures. Based on these studies, one can note that age alone is not a good predictor of increased health care spending, but proximity to death should also be used as a predictor of this spending.
Authors such as Elola et al. [2], Raitano [5], Baltagi and Moscone [10], Lange and Vollmer [3], Phi [1], Mohanty and Behera [4] have analysed the effects of health expenditure on the national life expectancy of OECD countries. The main importance of conducting this study lies in the fact that health expenditures and the national life expectancy are very important determinants of the health status and sustainable economic development of a nation. Therefore, to achieve sustainable economic development, countries must ensure a sustainable health system and an efficient allocation of government spending in this sector. Given that OECD countries have a high level of GDP per capita and have experienced positive results in the health sector in recent years.
Economic theory and the findings of various studies mentioned in the literature review below show that an increase in health expenditure is expected to result in positive effects on the quality of the health sector in terms of the population's longevity. Therefore, a study to examine the correlation between national life expectancy and health spending is necessary to help policymakers and governments in OECD countries understand the effectiveness of health spending on national life expectancy. The data obtained can be used by authors, policymakers and governments as a benchmark (for comparison) to analyse the effect of national health expenditures on national longevity.
This study accounts for exogenous factors such as economic growth, population, infant mortality rate, potential years of life lost, deaths from cancer and suicide rate; as control variables. These indirectly affect the effectiveness of health expenditures as a function of the national life expectancy of OECD countries. The novelty of this scientific study, when compared to the studies by other authors, is the inclusion of independent variables, which give a special focus to the academic discussion on the various challenges and problems faced by the health systems of OECD countries and which affect the effectiveness of health expenditures on national life expectancy.
In recent years, OECD countries have faced various challenges in their health systems, such as increasing infant deaths, potential years of life lost, deaths from cancer, suicide rates, etc. These health system challenges have an indirect impact on the receipt and allocation of health expenditures by the governments and policymakers of OECD countries. Therefore, taking into account the impact of these exogenous factors on the health system and the continuous population growth and economic growth in these countries adds value to the data and literature on the effectiveness of health expenditures on national life expectancy.
This study will provide new scientific evidence regarding the impact of health expenditures on the national life expectancy of OECD countries, taking into account the controlling effect of some independent variables. Moreover, compared to studies of other authors, this study incorporates a wider coverage.
The health care system plays a vital role in any economy. In OECD countries, healthcare costs vary over time and between countries [10]. In contemporary literature, there are many comparative analyses for different health care systems. Some of these studies focused on the correlations between health care outcomes, i.e., life expectancy and infant mortality, as well as contributing elements such as institutional, economic and social factors [11].
Table 1 presents a meta-analysis where the main findings of different authors who have analyzed the effect of health expenditures on national life expectancy are presented.
Table 1. Summary of econometric results from studies by other authors
|
|
The impact of health expenditure on national life expectancy |
|
|
|
|
|
The impact of health expenditure on national life expectancy |
|
|
|
|
|
No. |
Author, Year, Title of the paper |
P |
N |
M |
Ne |
No. |
Author, Year, Title of the paper |
P |
N |
M |
Ne |
|
1 |
Heuvel and Olaroiu [12] - How Important Are Health Care Expenditures for Life Expectancy? A Comparative, European Analysis |
|
|
|
+ |
11 |
Sango-Coker and Bein [22] - The Impact of Healthcare spending on life Expectancy |
|
|
+ |
|
|
2 |
Cervantes et al. [13] - Life Expectancy at Birth in Europe: An Econometric Approach Based on Random Forests Methodology |
+ |
|
|
|
12 |
Deshpande et al. [23] - The Effect of National Healthcare Expenditure on Life Expectancy |
|
|
+ |
|
|
3 |
Linden and Ray [14] - Life expectancy effects of public and private health expenditures in OECD countries 1970-2012: Panel time series approach |
+ |
|
|
|
13 |
Duba et al. [24] - The Effects of Health Care Expenditures as a Percentage of GDP on Life Expectancies |
+ |
|
|
|
|
4 |
Or [15] - Determinants of health outcomes in industrialised countries: A pooled, cross-country, time-series analysis |
|
|
|
+ |
14 |
Nkemgha et al. [25] - Healthcare expenditure and life expectancy in Cameroon |
|
|
+ |
|
|
5 |
Shaw et al. [16] - The Determinants of Life Expectancy: An Analysis of the OECD Health Data |
+ |
|
|
|
15 |
Weibo and Yimer [26] - The Effect of Healthcare Expenditure on the Health Outcomes in Sub-Saharan African Countries |
+ |
|
|
|
|
6 |
Rezapour et al. [17] - The Effects of Health Expenditure on Health Outcomes Based on the Classification of Public Health Expenditure: A Panel Data Approach |
+ |
|
|
|
16 |
Obrizan and Wehby [27] - Health Expenditures and Global Inequalities in Longevity |
+ |
|
|
|
|
7 |
Jabaa [18] - The relationship between life expectancy at birth and health expenditures estimated by a cross-country and time-series analysis |
+ |
|
|
|
17 |
Artekin and Konya [28] - Health expenditure and economic growth: Is the health led growth hypothesis supported for selected OECD countries? |
+ |
|
|
|
|
8 |
Jacobzone et al. [19] - Is the health of older persons in OECD countries improving fast enough to compensate for population ageing? |
+ |
|
|
|
18 |
Raghupathi and Raghupathi [29] - Healthcare Expenditure and Economic Performance: Insights from the United States Data |
+ |
|
|
|
|
9 |
Aísa et al. [20]- The influence of (public) health expenditure on longevity |
+ |
|
|
|
19 |
Dhrifi [30] - Healthcare expenditures, economic growth and infant mortality: evidence from developed and developing countries |
|
|
+ |
|
|
10 |
Nixon and Ulmann [21] - The relationship between health care expenditure and health outcomes: Evidence and caveats for a causal link |
+ |
|
|
|
20 |
Zaman et al. [31] - An Association of Total Health Expenditure with GDP and Life Expectancy |
|
- |
|
|
Explanation: The symbols P, N and M represent the initials: P - positive, N - negative, M - mixed and Ne – neutral
Empirical results show that while life expectancy depends on factors inside and outside the health system, health spending in recent decades has been a major driver of increases in life expectancy. In particular, a 10% increase in per capita health expenditure (in real terms) is accompanied by a 3.5-month increase in life expectancy. Given the marked evolution in health spending in the last 20 years, higher health spending is associated with a 42.4-month increase in life expectancy [32]. Life expectancy has changed significantly in recent decades, mainly as a result of economic development and the accompanying improvements in public health and health care [33, 34].
Real per capita income growth, technological innovation and comprehensive insurance in relation to medical treatment and population ageing are generally considered to have significant impacts on increasing health expenditure. Meanwhile, the reciprocal causal relationships between these factors are complex. This is since GDP does not only reflect national spending but also national revenues. Thus, this mutual report is explained by the fact that health spending constitutes the growth of national revenues. In general, the demand for innovation in medical technology will increase with the growth of national revenues and the needs of the population, which are related to ageing. This is contrary to popular belief that when real per capita income increases, much of the increase in health spending is not due to population ageing per se [35, 36] but due to the rising demand for new medical (MT) technologies that improve and/or prolong Life [36-40]. Also, according to Nghiem and Connelly [41], technology is expected to be the main determinant of health expenditures.
The following table summarises some studies by other authors that have analysed the impact of health expenditures on the national life expectancy of different countries.
From the meta-analysis of the scientific papers, thirteen studies have found positive effects between health expenditure and national life expectancy in different countries; one author found a negative effect, four authors a mixed effect (positive and negative) and two authors identified a statistically insignificant correlation between health expenditure and national life expectancy. Studies that have identified a positive effect between health expenditure and national life expectancy found that when a country's government significantly increases health care expenditure, it will affect the decline in the infant mortality rate and increase national life expectancy. These scientific findings are evident and relevant to developed countries, developing countries and countries in transition. These studies that have found a statistically significant relationship between health expenditure and national life expectancy provide empirical evidence that there is also a better performance of the health sector when there is effective management of health expenditure by the governments of these countries. Studies that have found that there is a negative effect between health expenditure and national life expectancy emphasise that the main factors influencing this phenomenon are: poverty level, income inequality, education, infant mortality and other socio-economic factors.
Given that this study deals with the effects of health expenditures on national life expectancy, panel data analysis was applied from a sample of 37 OECD countries and 518 observations during the period 2005-2018. Initially, the econometric model was built where national life expectancy was taken as a dependent variable. In contrast, health expenditures and financing, GDP per capita and productivity, population, infant mortality rate, potential years of life lost, deaths from cancer and suicide rate were taken as independent variables. For data processing, we used the Microsoft Excel application and Software for Statistics and Data Science (STATA) and carried out Multiple Linear Regression, Fixed Effect, Random Effect, Hausman - Taylor Regression, GMM Model - Arellano Bond Estimation, Generalized Estimating Equations (GEE Model) as well as linear trend analysis - the historical and comparative methods.
The main hypothesis of this study is:
H1: Health expenditure has a positive impact on the national life expectancy of OECD countries.
H0: Health expenditure does not positively impact the national life expectancy of OECD countries.
To prove the validity of the hypothesis of this study, we have constructed the following econometric model:
LEBit = β0 + β1 HEFit + β2 GDPcapit + β3 POPit + β4 IMRit + β5 PYOLLit + β6 DFCit + β7 SRit + γit
Where:
LEB – Life Expectancy
HEF – Health Expenditures and Financing
GDPcap – Gross Domestic Product per capita and Productivity (GDP per cap.)
POP – Population
IMR – Infant Mortality Rate
PYOLL – Potential Years of Life Lost
DFC – Deaths from Cancer
SR – Suicide Rate
γ – stochastic variables (other factors not taken into account in the model)
i – code and t – time period.
Table 2. Description of the variables included in the econometric models
|
Variables |
Description of variables |
Data source |
|
Dependent variable (Y) |
Life Expectancy (LEB) |
OECD and World Bank Annual Reports (2005 - 2018) |
|
Independent variable (X1) |
Health Expenditures and Financing (HEF) |
OECD and World Bank Annual Reports (2005 - 2018) |
|
Independent variable (X2) |
Gross Domestic Product per capita and Productivity (GDP per cap.) |
OECD and World Bank Annual Reports (2005 - 2018) |
|
Independent variable (X3) |
Population (POP) |
OECD and World Bank Annual Reports (2005 - 2018) |
|
Independent variable (X4) |
Infant Mortality Rate (IMR) |
OECD and World Bank Annual Reports (2005 - 2018) |
|
Independent variable (X5) |
Potential Years of Life Lost (PYOLL) |
OECD and World Bank Annual Reports (2005 - 2018) |
|
Independent variable (X6) |
Deaths from Cancer (DFC) |
OECD and World Bank Annual Reports (2005 - 2018) |
|
Independent variable (X7) |
Suicide Rate (SR) |
OECD and World Bank Annual Reports (2005 - 2018) |
Source: Data processing by authors (2021)
Table 2 shows the specification and description of the variables of the econometric model of this study. We take the LEB as the dependent variable. This represents the statistical age at which a person is expected to live based on various actuarial data. National life expectancy as a variable is widely applied in the financial industry in life insurance, pension planning and social security benefits. In OECD countries, national life expectancy calculations are performed by national statistical agencies based on very large amounts of actuarial data.
The main independent variable in this study is HEF. This includes all expenditures for providing health services, family planning activities, nutritional activities, and emergency health assistance. This category of health expenditures does not include the provision of drinking water and hygiene. Thus, HEF is the main independent variable data on final consumption expenditures for health care goods and services from the functions of the health sector, various financial schemes, cost structures of health insurance provision and the formation of capital in the health care system.
The second independent variable in this study is gross domestic product per capita and productivity. This indicator is a global measure applied to measure the prosperity of nations, and various economists use this indicator together with GDP to analyse the prosperity of a country based on its economic growth. The governments of different countries apply the analysis of GDP per capita to understand how a country's economy is growing along with its population.
Other control variables that are important in explaining what effect health expenditure has on the national life expectancy of OECD countries are population, infant mortality rate, potential years of life lost, deaths from cancer and suicide rates.
The third independent variable in this study is the population of OECD member countries between 2005 and 2018. The main reason the population is taken as an independent variable is to analyse the controlling effect of the number of inhabitants within a country that impacts the correlation between national life expectancy and health expenditure.
The infant mortality rate is the other independent variable included in this econometric model, defined as the number of deaths of children under the age of one, expressed per 1,000 births. The various international factors influencing infant mortality rates are due to variations between countries in registration practices for premature infants. According to OECD estimates, the United States and Canada are two countries that record a much higher percentage of babies weighing less than 500g, with a low probability of survival, resulting in a fairly high level of reported infant mortality per 1,000 births.
Potential years of life lost (PYOLL) is the other independent variable included in this econometric model as a controlling and exogenous variable. This variable represents a summary measure of premature mortality. This variable provides statistical data on deaths that occur at a young age and how to prevent them. The calculation of the potential years of life lost is done by summing up all the deaths that occur at any age and multiplying this value by the number of years left to live up to a limit of the chosen age. According to OECD estimates for health statistics, this limit is set at the age of 70. However, it is worth noting that this limit is not fixed since each OECD member country can set a specific standardised value for each year.
Another independent variable considered in this study is the number of deaths caused by cancer. According to OECD, more than 100 different types of cancer are known, and the risk of developing these diseases increases with age. The mortality rate is based on the number of cancer deaths recorded in a country and the size of the respective population. This variable is reported annually, and cancer mortality is measured per 100,000 inhabitants (total), per 100,000 men and per 100,000 women.
The last independent variable in this study is the suicide rate. This variable is defined as the deaths deliberately initiated and performed by a person with full knowledge or expectation of its fatal outcome. Based on OECD estimates, statistical data on this variable, which is compared between different countries, are influenced by several reporting criteria, including how a person intends to commit suicide, who is responsible for completing the death certificate if a forensic investigation is carried out and the provisions on the confidentiality of the cause of death.
Table 3 presents the average data on the trends of the respective factors included in this study.
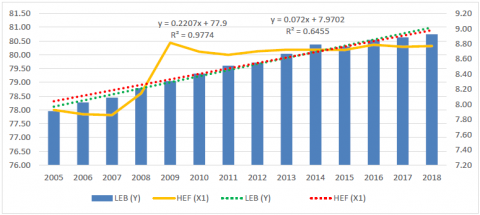
Figure 1 shows an average linear upward trend for the variable "health expenditures" between 2005 and 2018. Also, the average value of the common linear trend for both variables, LEB and HEF, is increasing, which means that for the period analysed in OECD countries, there is an increase in health expenditures, which in turn had a positive impact on national life expectancy. We also note that the potential implications for health insurance led to a sharp increase in health spending in 2007. From 2009 there was a significant decline with a tendency to increase in the following years. Thus, the expectation of longevity of inhabitants is dependent on the economic power and the situation of a country to provide health services in terms of expenditure.
When referring to the OECD annual reports on health statistics, we see that an almost essential problem is the economic opportunity, respectively financial, to be provided in terms of health services. This varies between countries. Thus, from a 2019 OECD report, we see that public insurance in Mexico reaches 51.3%, while in Norway up to 85% [32].
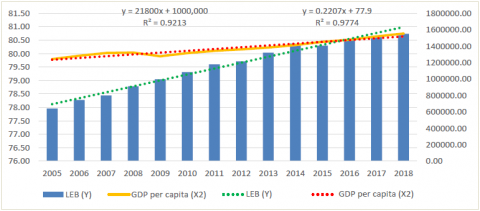
Figure 2 shows an average linear upward trend for the variables "gross domestic product per capita and productivity" and "national life expectancy". The average value of the linear trend for both these variables has increased during the analysed period, except in 2009, where GDP per capita and productivity have decreased (by US$44,537.03 million). However, for the analysed period, the linear upward trend of gross domestic product per capita and productivity positively impacted the national life expectancy of OECD countries.
Based on OECD statistics for 2009, almost all countries have experienced a decline in GDP per capita and productivity due to the financial crisis. It is worth noting the case of Greece, where the decline in GDP in 2008 was \$1,320.2 million, and this decline continued until 2013 (by \$104,228.9 million). However, Greece could not improve until 2014 due to problems with public debt, which in this case was helped by the so-called group "The Troika," (European Commission, the European Central Bank and the International Monetary Fund). The Troika's bailout terms that were helping Greece to get a handle on its debt caused rising taxes, unemployment, falling wages, etc. In 2015, Greece wanted to renegotiate the terms with the Troika group because Greeks were not satisfied with the falling wages and rising taxes. Negotiations with the Troika fell through, and the Greek government was unable to secure any debt relief between 2015-2016. In 2017, Greece accepted assistance from the European Union and began to recover from the debt crisis. As a result of this public debt crisis, Greece has had declining GDP from 2015 to 2016, but from 2017 it started to increase.
Table 3. Econometric model variables included in linear trends
|
Years |
LEB (Y) |
GDP per capita (X2) |
HEF (X1) |
Population (X3) |
IMR (X4) |
PYOLL (X5) |
DFC (X6) |
SR (X7) |
|
2005 |
77.96 |
1242158.79 |
7.93 |
33.56 |
5.33 |
6122.59 |
223.05 |
14.33 |
|
2006 |
78.28 |
1282490.23 |
7.87 |
33.80 |
5.12 |
5933.12 |
220.54 |
13.66 |
|
2007 |
78.45 |
1316952.72 |
7.86 |
34.06 |
5.01 |
5841.32 |
219.21 |
13.24 |
|
2008 |
78.79 |
1321547.23 |
8.15 |
34.33 |
5.14 |
5601.91 |
216.71 |
13.30 |
|
2009 |
79.05 |
1277010.22 |
8.81 |
34.58 |
4.76 |
5472.80 |
212.14 |
13.36 |
|
2010 |
79.32 |
1316223.67 |
8.69 |
34.83 |
4.60 |
5290.53 |
210.79 |
12.96 |
|
2011 |
79.60 |
1343885.14 |
8.65 |
35.00 |
4.47 |
5095.88 |
208.48 |
12.87 |
|
2012 |
79.71 |
1361908.49 |
8.70 |
35.22 |
4.47 |
5005.76 |
206.58 |
12.62 |
|
2013 |
80.04 |
1383922.93 |
8.72 |
35.43 |
4.44 |
4866.88 |
203.66 |
12.62 |
|
2014 |
80.37 |
1414444.66 |
8.72 |
35.67 |
4.35 |
4741.07 |
200.98 |
12.29 |
|
2015 |
80.30 |
1451895.59 |
8.72 |
35.89 |
4.24 |
4666.86 |
199.13 |
11.94 |
|
2016 |
80.54 |
1478645.19 |
8.79 |
36.12 |
4.20 |
4534.25 |
195.09 |
11.33 |
|
2017 |
80.63 |
1518195.87 |
8.76 |
36.33 |
3.79 |
4736.81 |
195.73 |
12.22 |
|
2018 |
80.74 |
1553701.47 |
8.77 |
36.54 |
3.66 |
5675.30 |
210.38 |
15.17 |
Figure 1. An average linear trend between national life expectancy and health expenditures and financing for OECD countries (2005 - 2018)
Figure 2. Average linear trend between national life expectancy and gross domestic product per capita and productivity for OECD countries (2005 - 2018)
On average, OECD countries are estimated to have spent 8.8% of GDP on healthcare in 2018, which has remained more or less unchanged since 2013. During the same period, the US spent the equivalent of 16.9% and Switzerland 12.2% of its GDP on healthcare, respectively. Other high-income countries, such as Germany, France, Sweden, and Japan, spent an average of 11% of their GDP on healthcare. A large group of OECD countries, including Europe, Australia, New Zealand, Chile, and Korea, spent between 8-10% of GDP on healthcare. Other Central and Eastern European countries, such as Lithuania and Poland, spent between 6-8% of their GDP on healthcare. Finally, some other countries, such as Mexico, Latvia, Luxembourg and Turkey, spent less than 6% of their GDP on healthcare [42]. GDP spending in all the countries mentioned above occurred in 2018.
Figure 3 shows an average linear upward trend for the variables "population", LEB and POP for the period between 2005 and 2018. This means that for the period analysed in OECD countries, we have an increase in population, which has had a positive impact on national life expectancy.
OECD statistics during the analysed period show that the countries Estonia, Germany (from 2006 to 2014), Greece, Japan, Portugal (from 2011 to 2018), Hungary, Latvia, and Lithuania (from 2005 to 2018) have experienced population decline. The decline in population in these countries was mainly due to low fertility, in some countries due to emigration to Estonia, Hungary and Poland, but in Japan and Germany, it was due to the rapid ageing of the population.
On average, in all OECD countries, people aged 65 expect to live another 19.7 years. Life expectancy at the age of 65 is more than 2.5 years higher for women than for men of the same age. This gender gap had not changed substantially since 1970, when life expectancy at the age of 65 was 2.9 years longer for women than men. Life expectancy at the age of 65 was highest for women in Japan (24.4 years) and men in Switzerland (20 years). Among OECD countries, life expectancy at the age of 65 in 2017 was lowest for women in Hungary (18.4 years) and men in Latvia (14.1 years) [42].
In Figure 4, we can note that there is a downward trend for the period 2005 to 2018 for the variable "infant mortality rate (IMR)" where we have a decrease from 5.33 to 3.66 deaths per 1000 live births, except for the period from 2007 to 2008 where we had a significant increase in infant mortality. On the other hand, we see an increasing trend for the same period for the variable "national life expectancy (LEB). That shows that decreases in infant mortality rate decreased had a positive impact on the national life expectancy in OECD countries.
Figure 3. An average linear trend between national life expectancy and population for OECD countries (2005 - 2018)
Figure 4. An average linear trend between national life expectancy and infant mortality rate for OECD countries (2005 - 2018)
OECD annual reports show that infant mortality has dropped significantly in all OECD countries and partner countries since the 1990s, especially in Slovenia, Estonia, Poland, Korea and China, except for a few countries that have seen growth, such as Mexico, Turkey, Chile and Colombia. In fact, in 2015, the average in OECD countries was less than four deaths per 1000 live births [32].
This marked decline in infant mortality rates comes as a result of the quality and efficiency of the health system, advances in medical technology, the socio-economic environment, and individual lifestyles. Although most analyses show that higher health expenditures tend to be associated with lower infant mortality, the fact that some countries with a high level of health expenditure do not exhibit lower infant mortality rates indicates that health expenditures are not the only factor impacting life expectancy [43].
Despite this progress in reducing infant mortality, the growing number of low-birth-weight of infants is a concern in some OECD countries. On average, one in every 15 babies born in OECD countries (6.5% of all births) weighed less than 2,500 grams at birth in 2017. Low-birth-weight babies have a higher risk of poor health or death, require a longer period of hospitalisation after birth, and are more likely to develop significant disabilities later on in life. Risk factors for low birth weight include maternal smoking, excessive alcohol consumption, poor nutrition, and low body mass index. Infant mortality - death amongst children not yet one-year-old, reflects the economic, social, and environmental effects on maternal and infant health and effects on health systems [42].
Figure 5 shows an average downward trend for the variable "potential years of life lost", while for the variable "national life expectancy", we see an average upward trend for the analysed period (2005 to 2018). The average value of the linear trend for both variables shows a downward slope from 2005 (13,022 years of life lost) to 2016 (9,660.14 years of life lost), while from 2017 onwards, the linear trend curve has a downward slope. It is worth noting that for the period under review, the downward linear trend of possible years of life lost has positively impacted the national life expectancy of OECD countries.
The OECD annual reports on health statistics in 2005 highlight that the countries that had the highest value of potential years of life lost were: South Africa (37,594), Russia (20,194), Latvia (12,923), Lithuania (12,923), Estonia (10,530), Brazil (10,124) and Hungary (10,007). According to statistics from recent years, all these countries have shown a significant reduction in the potential years of life lost, and this reduction has had a positive impact on the national life expectancy of OECD countries.
A sharp decline in potential years of life lost in OECD countries resulted from advances in medical technology, particularly in relation to infant mortality and deaths due to heart disease, prevention and control measures that have reduced premature deaths and avoidance of heart disease. Some other variables that have contributed to the decline in possible years of life lost in OECD countries are GDP per capita, employment status, number of doctors and public awareness about alcohol and tobacco consumption. This had a positive impact on reducing premature deaths [44].
Premature mortality rates are higher amongst men in all countries, with the OECD average in 2009 (4,689 years lost per 100,000 men), almost double that of women (2,419). The main causes that have affected the death of men before the age of 70 in OECD countries for the period under review are external causes, including accidents and violence (29%), cancer deaths (20%) and circulatory diseases (17%). Whereas, for women, the main causes are: cancer (31%), external causes (17%) and circulatory diseases (12%) [44].
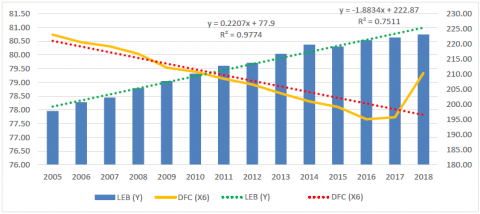
Figure 6 shows an average linear trend with a downward slope for the variable "deaths from cancer" for the period analysed. The average value of the linear trend for both variables has a downward slope from 2005 (533.71 deaths from cancer) to 2016 (474.52 deaths from cancer). It is worth noting that for the period under review, the downward linear trend of deaths from cancer positively impacted the national life expectancy of OECD countries.
The OECD [32] report highlights that the average mortality rate resulting from cancer in all OECD countries was just over 200 per 100,000 population. Cancer mortality was lowest in Mexico, Turkey, Finland, Switzerland, Japan, Israel and Korea, with less than 180 per 100,000 population. Rates were also less than 180 per 100,000 in Colombia, Brazil, Costa Rica and South Africa. Hungary, the Slovak Republic, Slovenia and Latvia carry the highest cancer mortality burden, with rates higher than 240 per 100,000 population.
Figure 5. An average linear trend between national life expectancy and potential years of life lost for OECD countries (2005 - 2018)
Figure 6. An average linear trend between national life expectancy and deaths from cancer for OECD countries (2005 - 2018)
Figure 7. An average linear trend between national life expectancy and the suicide rate for OECD countries (2005 - 2018)
Between 2013 and 2017, in the US, cancer death rates, fell by an average of 1.5% per year. However, the levels of new cancer diagnosed from 2012 to 2016 remained almost the same in men and increased slightly in women. These trends reflect differences between large groups of people in terms of cancer risk factors and the use of screening tests, and how doctors diagnose cancer and treatment advances, which include different types of chemotherapy.
Figure 7 shows an average linear trend with a downward slope for the variable "suicide rate" for the period analysed. On the other hand, the average value of the linear trend for both variables - LEB and SR- is downward sloping, which means that for the period analysed in OECD countries, there is a decrease in the suicide rate, which impacts national life expectancy positively.
OECD statistics for 2005 highlight that the countries that have had the highest number of suicides are: Lithuania (39,400), Russia (31,300), Korea (29,900), Latvia (24,400), Slovenia (23,400) and Japan (22,100). Although these OECD countries had the highest suicide rate in 2005, in recent years, they have significantly reduced the number of suicides in Lithuania (22,200), Russia (17,000), Korea (23,000), and Latvia (18,100), Slovenia (17,300) and Japan (14,900).
Mental health problems can have devastating effects on people's lives and increase the risk of suicide. In 2017, there were 11.2 suicide deaths per 100,000 inhabitants in OECD countries. Turkey and Greece had the lowest suicide rates among OECD countries, with less than five suicide deaths per 100,000 inhabitants in 2017. Korea and Lithuania had the highest suicide rates, with 24.6 and 24.4 deaths per 100,000 inhabitants. The suicide rate has dropped in almost all OECD countries, falling by more than 30% over the period between 1990 and 2017 [32].
Table 4 presents the descriptive statistics for the variables included in this study, while Table 5 shows the Pearson correlation coefficient values between LEB and other independent variables (HEF, GDP per cap., POP, IMR, PYOLL, DFC, SR).
In Table 5, we notice that all the variables incorporated in the econometric model are correlated. LEB has a positive average correlation with HEF (R = 0.5149), which means that an increase in health expenditures and financing increases the value of national life expectancy.
There is a very weak value of the Pearson coefficient between national life expectancy (LEB) and the value of GDP per capita (R = 0.2324). This means that GDP has a positive effect on increasing the value of national life expectancy. Even the correlation between national life expectancy (LEB) and population (POP) is very weak (R = -0.0327), indicating a negative linear correlation between these two variables. Therefore, with an increase in POP in OECD countries, we will have a decrease in the value of LEB.
National life expectancy (LEB) and infant mortality rate (IMR) are, on average, negatively linearly correlated. Therefore, an increase in IMR will result in a decrease in the value of LEB. There is a very high negative linear correlation between national life expectancy (LEB) and potential years of life lost (PYOLL). With an increase in (PYOLL), we will have a decrease in LEB value. The linear correlation between national life expectancy (LEB) and deaths from cancer (DFC) is weak and negatively correlated, implying that with increasing (DFC), we will have a decrease in the value of LEB. The same applies to the suicide rate, as national life expectancy has a weak negatively correlation with suicide levels. This means that with increasing suicide rates (SR), we will decrease the value of national life expectancy (LEB).
As noted above, to test the hypotheses of this study, we applied six statistical tests using the Stata application. Specifically, linear regression, random effect, fixed effect, Hausman - Taylor Regression, GMM Model - Arellando Bond Estimation and Generalized Estimating Equations (GEE Model). The following are the econometric results for the hypothesis of this study and our aim to determine the impact of health expenditures on the national life expectancy in OECD countries.
$\begin{aligned} L E B_{i t}=\beta_0+& \beta_1 H E F_{i t}+\beta_2 \ln G D P c a p_{i t}+\beta_3 P O P_{i t} \\ &+\beta_4 I M R_{i t}+\beta_5 P Y O L L_{i t}+\beta_6 D F C_{i t} \\ &+\beta_7 S R_{i t}+\gamma_{i t} \end{aligned}$
$\begin{aligned} L E B_{i t}=85.17565 &+0.1929712 H E F_{i t} \\ &+0.1833448 \ln _{i t} \boldsymbol{D P c a p}_{i t} \\ &-0.0078948 \boldsymbol{P} \boldsymbol{O P}_{i t}+0.1077461 \boldsymbol{I M R _ { i t }} \\ &-0.0010156 \boldsymbol{P} \boldsymbol{O L L _ { i t }} \\ &-0.0186612 \boldsymbol{D F C}_{i t}+0.0189861 \boldsymbol{S R}_{i t} \\ &+\gamma_{i t} \end{aligned}$
Results in Table 6 show that all variables included in this econometric model are significant (p-value of less than 0.05). We, therefore, use the GEE model to interpret the effect of health expenditures on national life expectancy in OECD countries?
β0 - If all other factors are constant, then the value of national life expectancy will be 85.17 units.
β1 - If health expenditure and financing (HEF) increases by 1 unit keeping other factors constant, then national life expectancy (LEB) will increase by 0.193 units. This statement is statistically significant (p-value = 0.000 < 0.01).
Based on this result and the trend in the analysed period (2005-2018), we can conclude that an increase in health expenditures and financing in OECD countries positively impacts the value of national life expectancy. To better explain this impact of health expenditure on national life expectancy, we also consider the economic growth of OECD countries. Thus, if the value of GDP is high, countries can and tend to spend more on the health sector, contributing to the increase in the value of life expectancy in the OECD area. Therefore, (β2) if GDP per capita increases by 1%, then national life expectancy (LEB) will increase by 0.0018 units. This statement is correct since the significance value (P-value = 0.032 < 0.05) is at the level of statistical significance. The empirical results that explain the correlation and effect between health expenditure and national life expectancy are consistent and comparable even to the studies by other authors noted in Table 1.
β3 - If the population (POP) increases by 1 unit keeping the other factors constant, then the national life expectancy (LEB) will decrease by -0.0079 units. This statement is correct since the significance value (P-value = 0.001 < 0.01) is at a level of statistical significance.
Developed countries can spend more on the health sector, leading to lower mortality rates. During the period 2005 to 2018, the trend shows that an increase in population results in a national life expectancy increase, but not significantly. This is because there have been variations in population sizes and per capita income over the years. Increases in the population in the OECD countries result in income increases. However, these increases are not enough to influence the spending by these countries on the health sector and consequently have an impact on the increase of the value of national life expectancy. The GEE model test shows that in OECD countries, the population has negatively influenced the value of national life expectancy.
Table 4. Descriptive statistics for the variables included in the econometric model
|
Variables |
Obs. |
Mean |
Std.Deviation |
Minimum |
Maximum |
|
LEB |
518 |
79.55463 |
2.944432 |
70.6 |
84.4 |
|
HEF |
518 |
8.510232 |
2.189254 |
4.1 |
17 |
|
GDPcap. |
518 |
1375927 |
2872489 |
13468.94 |
1.96e+07 |
|
POP |
518 |
35.09696 |
56.38509 |
0.296734 |
327.1674 |
|
IMR |
506 |
4.544466 |
3.284753 |
0.7 |
20.4 |
|
PYOLL |
455 |
5251.175 |
2071.064 |
2990.3 |
13762.6 |
|
DFC |
454 |
209.1187 |
32.32916 |
116.1 |
295.5 |
|
SR |
453 |
12.86777 |
6.396402 |
1.7 |
39.4 |
Table 5. Correlation analysis for the variables included in the econometric model
|
Variables |
LEB |
HEF |
GDPcap |
Population |
IMR |
PYOLL |
DFC |
SR |
|
LEB |
1.0000 |
|
|
|
|
|
|
|
|
HEF |
0.5149 |
1.0000 |
|
|
|
|
|
|
|
GDPcap. |
0.2324 |
0.4643 |
1.0000 |
|
|
|
|
|
|
POP |
-0.0327 |
0.4825 |
0.7483 |
1.0000 |
|
|
|
|
|
IMR |
-0.5673 |
-0.2796 |
0.1716 |
0.2687 |
1.0000 |
|
|
|
|
PYOLL |
-0.9394 |
-0.4237 |
-0.2189 |
0.0614 |
0.5114 |
1.0000 |
|
|
|
DFC |
-0.2718 |
-0.0651 |
-0.3648 |
-0.3319 |
-0.3846 |
0.2660 |
1.0000 |
|
|
SR |
-0.2795 |
-0.1313 |
-0.2281 |
-0.1007 |
-0.2655 |
0.3976 |
0.3828 |
1.0000 |
Table 6. Econometric results and empirical findings of the study
|
Variables |
Linear Regression |
Random Effects – GLS Regression |
Fixed – Effects Regression |
Hausman – Taylor Regression |
GEE Model |
GMM Model |
|
LEB |
- |
- |
- |
- |
- |
0.1535599*** (0.000) |
|
HEF |
0.1547244*** (0.000) |
0.1626893*** (0.000) |
0.1227385*** (0.000) |
0.1304853*** (0.000) |
0.1929712*** (0.000) |
0.109671*** (0.000) |
|
GDPcap. |
0.1128535*** (0.000) |
0.2663559** (0.023) |
0.8524545*** (0.000) |
0.6573889*** (0.001) |
0.1833448** (0.032) |
0.1535599** (0.017) |
|
POP |
-0.003549*** (0.000) |
-0.0100617*** (0.002) |
0.0073631 (0.356) |
-0.0069522 (0.237) |
-0.0078948*** (0.001) |
-0.0052321** (0.009) |
|
IMR |
-0.1578585*** (0.000) |
-0.0518464** (0.047) |
0.0863165*** (0.009) |
0.373717 (0.195) |
-0.1077461*** (0.000) |
-0.0763168*** (0.000) |
|
PYOLL |
-0.001081*** (0.000) |
-0.001012*** (0.000) |
-0.001057*** (0.000) |
-0.0010323*** (0.000) |
-0.0010156*** (0.000) |
-0.0006313*** (0.000) |
|
DFC |
-0.015311*** (0.000) |
-0.021903 *** (0.000) |
-0.0226426*** (0.000) |
-0.0236917*** (0.000) |
-0.0186612*** (0.000) |
-0.0113546*** (0.000) |
|
SR |
0.0162817*** (0.004) |
0.0119654 (0.214) |
0.0029024 (0.771) |
0.0060392 (0.532) |
0.0189861* (0.059) |
-0.0076005 (0.345) |
|
Const. |
86.25098*** (0.000) |
84.89206*** (0.000) |
76.96849*** (0.000) |
80.30462*** (0.000) |
85.17565*** (0.000) |
55.41064*** (0.000) |
|
R Square |
0.9641 |
0.9145 |
0.9207 |
- |
- |
- |
|
Adj.R2 |
0.9636 |
0.8787 |
0.5002 |
- |
- |
- |
Explanation: P-values are shown in parentheses: *** indicates statistical significance at the level of 1%; ** indicates statistical significance at 5% level and * indicates statistical significance 10%.
β4 - If the infant mortality rate (IMR) increases by 1 unit while keeping the other factors constant, then the national life expectancy (LEB) will decrease by -0.1077 units. This statement is correct since the value of the significance (P-value = 0.000 < 0.01) is at the level of statistical significance. We can conclude that an increase in the infant mortality rate has reduced the value of national life expectancy in OECD countries, but fortunately, during the analysed period, we noticed that the infant mortality rate has decreased and consequently increased the value of life expectancy. Even this decline in infant mortality rates in OECD countries over the past decades had declined by an average of 28 deaths per 1000 live births in 1970 to less than 7 in 2002.
β5 - If the potential years of life lost (PYOLL) increases by 1 unit while keeping the other factors constant, then the national life expectancy (LEB) will decrease by - 0.0010 units. This statement is correct since the value of the significance (P-value = 0.000 < 0.01) is at the level of statistical significance. From this, we can conclude that in OECD countries during the analysed period, the potential years of life lost has decreased. Based on our econometric results the declining trend of deaths from cancer in OECD countries for the period under analysis has had a positive impact on increasing life expectancy at birth. Therefore, (β6) if deaths from cancer increase by 1 unit while keeping other factors constant, then national life expectancy (LEB) will decrease by -0.0186 units. This statement is correct since the value of the significance (P-value = 0.000 < 0.01) is at the level of statistical significance.
β7 - If the suicide rate increases by 1 unit while keeping the other factors constant, then the national life expectancy (LEB) will increase by 0.0189 units. This statement is correct since the value of the significance (P-value = 0.000 < 0.01) is at the level of statistical significance.
In general, it is usually concluded that suicide is a factor that affects the decline in life expectancy. However, our results show that with an increased suicide rate life expectancy at birth increased due to the increase in the average age of the death of the victims of suicide. The negative effect of the increase in suicide on national life expectancy was greatly reduced as a result of the increase in the average age of these victims. Thus, with the increase in the average age of suicide victims in OECD countries, national life expectancy has increased. However, without this effect, suicides would have reduced the increase in national life expectancy during the analysed period (2005 to 2018).
Health is one of the most critical development issues facing all countries globally. This study highlights the importance of effective management of public funds and the availability of these funds according to the healthcare needs of the population. Based on the econometric results and empirical findings of this study, we can conclude that all the independent variables that have been analysed in this study are statistically significant and have an effect on the dependent variable, ie national life expectancy. These econometric results corroborate the findings of many studies by authors mentioned above and highlighted in Table 1.
The salient results of this study, show that health expenditures have a positive impact on the national life expectancy of OECD countries and confirming the validity of our main hypothesis. Thus, during the period analysed in this study, it can be concluded that health care expenditures have a positive effect on increasing national life expectancy in OECD countries. Such empirical evidence is very important and for policymakers since to ensure economic development countries must carefully manage the public funds allocated to health care. Since this will positively affect health care and at the same time increase national life expectancy.
Other results show that the independent variable Gross Domestic Product per capita and productivity has a positive impact on increasing the national life expectancy of OECD countries for the period under review. Such a correlation and effect between these two variables is evident from the fact that OECD countries are considered to be countries with a good standard of living and the latter have sufficient income to spend on health care. When households have higher incomes, then health care is also of better quality and this positively affects national life expectancy.
Also, the independent variable population has contributed significantly to the reduction of national life expectancy. Such a correlation and mutual causality between population and national life expectancy are explained by the fact that OECD countries are countries that have a fairly large population, therefore a steady increase in population consequently affects the increase in national life expectancy. However, taking into account the fact that these countries have very high incomes per capita, the continuous population growth has affected the incomes of households making them insufficient. As a consequence of this phenomenon reduced incomes dedicated to caring health results in reduced national life expectancy of these countries.
Moreover, other results, highlighted that the independent variables rate of infant mortality, potential years of life lost, deaths from cancer and suicide rate affect national life expectancy and all these variables are significant in terms of statistical importance. These exogenous variables were taken into account in this study to see their impact on national life expectancy and to verify the quality of health services in OECD countries and the trend of health expenditures during the period analysed. One must also take into account that OECD countries have an increasing trend in health care expenditures and financing and this trend has also affected the decline in infant mortality rates, potential years of life lost and the rate of cancer deaths. The decline of these exogenous indicators has had positive effects on the national life expectancy of these countries, and GDP growth per capita and rapid technological development in the field of medicine have contributed to increased economic well-being and the treatment of various diseases that alleviate also the process of their healing. Better economic well-being results in better health care and increased national life expectancy.
Another very important variable included in this study is the suicide rate. Findings of our empirical results show that the suicide rate is significant and has an impact on increasing national life expectancy. Such a correlation and causality is explained by the fact that for the period analysed in most OECD countries the average age of death of victims from suicide has decreased. According to the findings of this study and based on annual OECD statistics in most countries we note a downward trend in the number of suicides.
The scientific contribution of this paper lies in the fact that all econometric results and findings of this study are taken from actual real data and are comparable and can be corroborated to studies and findings by other authors. The findings of this study will serve as evidence for many governments and policymakers that better health care results positively on national life expectancy, cost-saving, the standard of living and general economic well-being.
Given the fact that this study found a positive correlation and effect between health spending and national life expectancy, then we recommend that OECD governments and policymakers continue to manage and use sector funds effectively in the future. Public health, in order to control corruption and inadequate governance. We also recommend that the governments of these countries should support policies that increase health expenditures in order to improve the health status of the population. In the future, policymakers in these countries should make even more efforts to design and implement adequate policies that will increase the income level of the population, so that they spend more on health goods and services.
[1] Phi, G. (2017). Determinants of health expenditures in OECD countries. Honors Thesis, Bryant University. https://digitalcommons.bryant.edu/honors_economics/26/.
[2] Elola, J., Daponte, A., Navarro, V. (1995). Health indicators and the organization of health care systems in western Europe. American Journal of Public Health, 85(10): 1397-1401. https://doi.org/10.2105/AJPH.85.10.1397
[3] Lange, S., Vollmer, S. (2017). The effect of economic growth development on population health: A review of the empirical evidence. British Medical Bulletin, 121(1): 47-60. https://doi.org/10.1093/bmb/ldw052
[4] Mohanty, R.K., Behera, D.K. (2020). How effective is public health care expenditure in improving health outcomes? An empirical evidence from the Indian states. National Institute of Public Finance and Policy, Working Paper No. 300, New Delhi. https://www.nipfp.org.in/media/medialibrary/2020/03/WP_300_2020.pdf.
[5] Raitano, M. (2006). The impact of death-related costs on healthcare expenditures: A Survey. ENEPRI Research Report No. 17 / February 2006. http://aei.pitt.edu/9487/2/9487.pdf.
[6] Ahn, N., Garcia J., Herce, J. (2005). Demographic uncertainty and health care expenditure in Spain, Documento de Trabajo 2005-07, FEDEA, Madrid. https://documentos.fedea.net/pubs/dt/2005/dt-2005-07.pdf.
[7] Batljan, I., Lagergren, M. (2004). Inpatient/outpatient health care costs and remaining years of life: Effect of decreasing mortality on future acute health care demand. Social Science and Medicine, 59(12): 2459-2466. https://doi.org/10.1016/j.socscimed.2004.04.003
[8] Breyer, F., Felder, S. (2004). Life expectancy and health care expenditures in the 21st century: A new calculation for germany using the costs of dying. Discussion Paper No. 452, DIW, Berlin. https://www.econstor.eu/handle/10419/18304.
[9] Felder, S., Meiers, M., Schmitt, H. (2000). Health care expenditure in the last months of life. Journal of Health Economics, 19(5): 679-695. https://doi.org/10.1016/S0167-6296(00)00039-4
[10] Baltagi, B.H., Moscone, F. (2010). Health care expenditure and income in the OECD reconsidered: evidence from panel data. IZA Discussion Paper No. 4851. https://docs.iza.org/dp4851.pdf.
[11] Mohan, R., Mirmirani, S. (2007). An assessment of OECD health care system using panel data analysis. Southwest Business and Economic Journal, 16: 21-35. https://mpra.ub.uni-muenchen.de/6122/.
[12] Heuvel, W., Olaroiu, M. (2017). How important are health care expenditures for life expectancy? a comparative, European analysis. Journal of the American Medical Directors Association, 18(3). https://doi.org/10.1016/j.jamda.2016.11.027
[13] Cervantes, P.A.M., López, N.R., Rambaud, S.C. (2020). Life expectancy at birth in Europe: An econometric approach based on random forests methodology. Sustainability, MDPI, 12(1): 413. https://doi.org/10.3390/su12010413
[14] Linden, M., Ray, D. (2017). Life expectancy effects of public and private health expenditures in OECD countries 1970-2012: Panel time series approach. Economic Analysis and Policy, 56: 101-113. http://dx.doi.org/10.1016/j.eap.2017.06.005
[15] Or, Z. (2000). Determinants of health outcomes in industrialised countries: A pooled, cross-country, time-series analysis. OECD Economic Studies, 30(30): 53-77. https://www.oecd.org/economy/growth/2732311.pdf.
[16] Shaw, J.W., Horrace, W.C., Vogel, R.J. (2005). The Determinants of life expectancy: An analysis of the OECD health data. Southern Economic Journal, 71(4): 768-783. https://doi.org/10.2307/20062079
[17] Rezapour, A., Mousavi, A., Lotfi, F., Movahed, M.S., Alipour, S. (2019). The effects of health expenditure on health outcomes based on the classification of public health expenditure: A panel data approach. Shiraz E-Medical Journal, 20(12): e88526. https://doi.org/10.5812/semj.88526
[18] Jabaa, E., Balana, C.B., Robua, I. (2014). The relationship between life expectancy at birth and health expenditures estimated by a cross-country and time-series analysis. Procedia Economics and Finance, Emerging Markets Queries in Finance and Business, 15: 108-114. https://doi.org/10.1016/S2212-5671(14)00454-7
[19] Jacobzone, S., Cambois, E., Robine, J.M. (2000). Is the health of older persons in OECD countries improving fast enough to compensate for population ageing? OECD Economic Studies, 30: 149-190. https://www.oecd.org/tax/public-finance/2732545.pdf.
[20] Aísa, R., Clemente, J., Pueyo, F. (2014). The influence of (public) health expenditure on longevity. International Journal of Public Health, 59: 867-875. https://doi.org/10.1007/s00038-014-0574-6
[21] Nixon, J., Ulmann, P. (2006). The relationship between health care expenditure and health outcomes: Evidence and caveats for a causal link. The European Journal of Health Economics, 7(1): 7-18. https://doi.org/10.1007/s10198-005-0336-8
[22] Sango-Coker, E.Y., Bein, M.A. (2018). The impact of healthcare spending on life expectancy. African Journal of Reproductive Health, 22(4): 64-71. https://doi.org/10.29063/ajrh2018/v22i4.7
[23] Deshpande, N., Kumar, A., Ramaswami, R. (2014). The effect of national healthcare expenditure on life expectancy. Econometric Analysis Undergraduate Research Papers, College of Liberal Arts - Ivan Allen College (IAC). http://hdl.handle.net/1853/51648.
[24] Duba, J., Berry, J., Fang, A., Baughn, M. (2018). The effects of health care expenditures as a percentage of GDP on life expectancies. Research in Applied Economics, 10(2): 50-65. https://doi.org/10.5296/rae.v10i2.12654
[25] Nkemgha, G.Z., Tékam, H.O., Belek, A. (2020). Healthcare expenditure and life expectancy in Cameroon. Journal of Public Health, 29: 683-691. https://doi.org/10.1007/s10389-019-01181-2
[26] Weibo, X., Yimer, B. (2019). The effect of healthcare expenditure on the health outcomes in Sub-Saharan African countries. Asian Journal of Economics, Business and Accounting, 12(4): 1-22. https://doi.org/10.9734/ajeba/2019/v12i430158
[27] Obrizan, M., Wehby, G.L. (2018). Health expenditures and global inequalities in longevity. World Development, 101: 28-36. https://doi.org/10.1016/j.worlddev.2017.08.003
[28] Artekin, A.Ö., Konya, S. (2020). Health expenditure and economic growth: Is the health led growth hypothesis supported for selected OECD countries? Poslovna Izvrsnost, 14(1): 77-89. https://doi.org/10.22598/pi-be/2020.14.1.77
[29] Raghupathi, V., Raghupathi, W. (2020). Healthcare expenditure and economic performance: insights from the United States data. Frontiers in Public Health, 8: 156. https://doi.org/10.3389/fpubh.2020.00156
[30] Dhrifi, A. (2018). Healthcare expenditures, economic growth and infant mortality: Evidence from developed and developing countries. CEPAL Review, 2018(125): 69-91. https://doi.org/10.18356/02c1a26c-en
[31] Zaman, S.B., Hossain, N., Mehta, V., Sharmin, S., Mahmood, S.A.I. (2017). An association of total health expenditure with GDP and life expectancy. Journal Of Medical Research and Innovation, 1(2): AU7-AU12. https://doi.org/10.15419/jmri.72
[32] OECD. (2017). Health at a Glance 2017: OECD Indicators. Paris: OECD Publishing. https://doi.org/10.1787/health_glance-2017-en
[33] Martens, P. (2002), Health transitions in a globalising world: Towards more disease or sustained health? Futures 34(7): 635-648. https://doi.org/10.1016/S0016-3287(02)00005-8
[34] Jen, M.H., Johnston, R., Jones, K., Harris, R., Gandy, A. (2008). International variations in life expectancy: A spatio-temporal analysis. Tijdschrift voor Economische en Sociale Geografie, 101(1): 73-90. https://doi.org/10.1111/j.1467-9663.2009.00518.x
[35] Cutler, D.M., Ly, D.P. (2011). The (paper) work of medicine: understanding international medical costs. Journal of Economic Perspectives, 25(2): 3-25. https://doi.org/10.1257/jep.25.2.3
[36] Newhouse, J. P. (1992). Medical care costs: How much welfare loss? Journal of Economic Perspectives, 6(3): 3-21. https://doi.org/10.1257/jep.6.3.3
[37] Chandra, A., Skinner, J. (2012). Technology growth and expenditure growth in health care. Journal of Economic Literature, 50(3): 645-680. https://doi.org/10.1257/jel.50.3.645
[38] Cutler, D.M., McClellan, M. (2001). Is technological change in medicine worth it? Health Affairs, 20(5): 11-29. https://doi.org/10.1377/hlthaff.20.5.11
[39] Willeme, P., Dumont, M. (2015). Machines that go "ping": Medical technology and health expenditures in OECD countries. Health Economics, 24(8): 1027-1041. https://doi.org/10.1002/hec.3089
[40] Woodward, R.S., Wang, L. (2011). The Oh-So straight and narrow path: Can the health care expenditure curve be bent? Health Economics, 21(8): 1023-1029. https://doi.org/10.1002/hec.1765
[41] Nghiem, S.H., Connelly, L.B. (2017). Convergence and determinants of health expenditures in OECD countries. Health Economics Review, 7(29): 1-11. https://doi.org/10.1186/s13561-017-0164-4
[42] OECD. (2019). Health at a Glance 2019: OECD Indicators. Paris: OECD Publishing. https://doi.org/10.1787/4dd50c09-en
[43] Roberts, D.R., Chang, C.F., Rubin, R.M. (2004). Technical efficiency in the use of health care resources: a comparison of OECD countries. Health Policy, 69: 55-72. https://doi.org/10.1016/j.healthpol.2003.12.002
[44] OECD. (2011). Health at a Glance 2011: OECD Indicators. Paris: OECD Publishing. https://doi.org/10.1787/health_glance-2011-en