Taleb Odeh* | Abbas I. Alakhras | Mohamed Habib | Omar Alduaij | Alsharifa Hind Mohammad | Faten Alslaty
© 2022 IIETA. This article is published by IIETA and is licensed under the CC BY 4.0 license (http://creativecommons.org/licenses/by/4.0/).
OPEN ACCESS
The climatic changes of the last 20 years generated a high rainfall intensity that lead a common flash flood risks in the wades of arid regions such as Mecca province. However, both the rapid urban expansion in that province and its small catchments trigger the flash flood risk. Therefore, a spatial plan that orient the urban expansion toward less potential flash flood risk has great importance. Such a plan is carried out by a spatial analysis for the topography, rainfall pattern, drainage network density and sub-catchment areas. Geographic Information Systems is a powerful tool in order for achieving that analysis by the overlaying method. Our research guide urban planner to where has urbanization extended. It is a preliminary study for an analytical and numerical runoff modelling that have to be done for the study area in order to clarify the flooding hazard. Our research indicates that catchment area size and drainage network density are the major two factors that control the spatial distribution of flash flooding and need to be consider for any urban spatial plan. We found that the four major cities in Mecca province are threaten by flash flooding differently in terms of direction and intensity.
Mecca province, urban expansion, flash flood, topography, catchment areas, fuzzy logic, GIS, spatial analysis
The Mecca Province is one of 13 provinces in the kingdom of Saudi Arabia [1]. It is the third-largest province and has an area of about 153127 square kilometers [2]. It locates in the southwest of the Kingdom and has a border with the Red Sea in the west (Figure 1). However, it is the holiest region in the world for Muslims worldwide and more than 25 million Muslim visitors currently from all around the world come to it yearly in order for pilgrimages [3, 4]. However, the urban area had been increased and would be increased rapidly because of the increased population growth and a tremendous number of visitors [5].
Several factors govern the orientations of the urban expansion such as: topography, climatology, water resources and geology. However, there are disciplines between the mentioned factors because the underline geological structures control the elevations above sea level and hence the topography [6]. Furthermore, topography control temperature degrees and hence the climatic zone that control the quantity of rainfall and therefore the availability of water resources [7].
The climatic changes decrease the quantity of rainfall and increase its intensity over the arid regions [8]. The increased rainfall intensity is the major reason for increasing the probability of flash flood risk [9]. However, the flask flood risk threatens the current urban area and effect its expanding directions [10]. Accordingly, the objectives of our research are to evaluate the risk of the flash over the Mecca province and recommended areas and orientations that urbanization has to be extended toward. The literature for such as a study shows that there are tens of papers worldwide that could not present all of them in our paper. However, for our case study there no previous study that correlate the urban expansion with flash flooding spatial distributions [10-12].
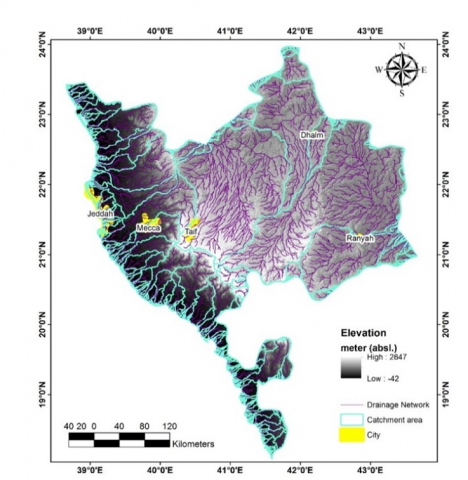
The elevations in Mecca province are from - 42 m above sea level (absl.) in the western side of the province within the adjustment area of the beach to 2467 m absl. [11] (Figure 2). However, several landforms were generated by these huge variations in the elevations. In the western side of the province the most common landform features are Wadis that generated a small catchment that has an area of a few square kilometers [11]. The major cities of Mecca Jeddah are within these landforms. However, in the South West a Landform of mountain series that cover the city of Taif and the adjustment areas. In the North East and South East, the common landforms are hills that cover two major cities Dhlam in the North East and Ranyah in the South East [12].
The general description of climate for Mecca province hot desert that is a mostly arid region. However, the province has four climatic zones that generated four rainfall patterns (Figure 3). Two major reasons created these zones: the geographic location within the same province and its topographic elevation [1]. The distinguished climatic parameter for these climatic zones is the rainfall quantities that it forms 50 mm/year where Jeddah city is allocated to 250 mm/year where the city of Taif is allocated. However, Dhalm and Ranyah cities locate within the zone of 100mm/year while Mecca city is located on the boundary between the zone 50 to 100 mm/year [1, 4, 13].
Figure 1. The study area location. It is the southwestern part of the Red Sea
Figure 2. The topography of the study area
From a hydrological perspective, the province could be subdivided into more than thousands of catchment areas that their areas range from 100 km2 to 29000 km2 (Figure 4). The drainage networks of the catchments that are within the adjustment area of the Red Sea runs directionally from the east to the west and discharge the runoff water directly into the sea. However, the larger catchment areas that are in the eastern part of the province has a drainage network that runs directionally from the west to the north.
Figure 3. Thematic map for rainfall quantity in the study area
Figure 4. The catchment areas and their drainage network in the study area
Geographic Information Systems (GIS) as an integrated approach is currently a common tool for evaluating the risk of natural hazard such as flash floods [14]. It is a useful tool for land surface and spatial analysis. Furthermore. GIS has great capability for geo-data manipulating presentation. The ArcGIS 10.3 software from Environmental systems research institute (Esri) is the most common GIS software currently [15, 16]. The land surface analysis such as slope dree map and drainage network density were done for our study area by an extension so-called spatial analyst that use the Digital Elevation Model (DEM) as a data base. The results were presented and manipulated by the same software. However, our manipulation was depended on two factors in order emphasis the difference between values:
1) The hillshade effects: that enhance the three-dimensional geo-visualization of the land surface by controlling patterns of light and shadow to generate a 3D representation of the land surface that show it in easier way to identify landscape unit.
2) The interval effects: showing the interval in different forms such as equal interval or geometrical one would emphasis the results too. In our case study the equal interval values was the best in order to generate distinguished spatial units.
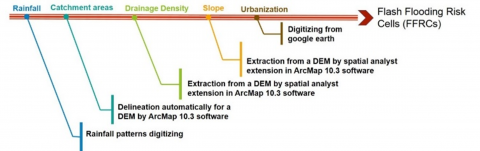
Evaluating the urban expansion and carrying out a spatial plan that determine the optimize orientation for urbanization [17, 18]. Accordingly, we used an integrated approach of GIS tools in order to determine that areas and the directions that are most threatened from the flash floods and accordingly to where the urbanization has to extend. That approach is presented in Figure 5. The concept of that approach is to overlay the layers that are responsible for flash flood generation by fuzzy logic. Fuzzy logic modeling represents many-valued logic where the truth value of variables could be between 0 and 1. It is used to describe the principle of partial truth. The truth ranges between fully true and fully false [11, 16]. It is based on the descriptions that scientists do based on imprecise and non-numerical information. Fuzzy modeling is mathematical description for vagueness and imprecise data. It has the privilege of the capability of recognizing, representing, manipulating, interpreting and using data that are vague and lack certain. However, Mecca province is such an area that has a data scarcity and hence limited GIS data layers. There are limited climatic data and limited land surface data that are if form of low resolution-sources. Furthermore, the uncertainty of the flash flood data for this area is fit with the concept of fuzzy logic [12, 19]. The GIS data that we used in our fuzzy logic modelling are either by digitizing the available maps our extracting them by spatial analysis for a DEM as follows:
1) Rainfall patterns data: it was generated by digitizing a rainfall data map that is a available from The General Authority for Statistics GASTAT in Saudi Arabia (https://www.stats.gov.sa/en). The digitizing process was done by ArcGIS 10.3. It started by georeferencing a rainfall map that is as an open source data and available in the website of GASTAT. Then rectifying and finally digitizing the rainfall pattern [14].
2) Catchment areas and drainage network: Digital Elevation Model (DEM) of 30 m resolution was download from Shuttle Radar Topography Mission (SRTM) data web site (https://gisgeography.com/srtm-shuttle-radar-topography-mission/) in order to extract cat by spatial analyst extension in ArcGIS 10.3. The steps for that could be summarized as follows:
2.1) DEM filling the missed values: In the step the software interpolate the missing data that might be found in the grid cells of the DEM.
2.2) Generating the flow direction raster: Grid cells that shows the direction of the steepest slope neighbor for each cell by color-coded direction.
2.3) Generating flow accumulation raster: Grid cells that shows the number of cells contributing to flow where each cell carries a contributing weight value.
2.4) Flow Limitation: A threshold value is determined to limit the flow accumulation raster to required limit of drainage density by trial and error method. The catchment area of all grids can be specified after filling and flow direction extraction.
2.5) Generating Stream Network: a data conversion toolbar is available in ArcGIS 10.3 for that purpose. Stream raster is converted into a vector file that is usually in a shapefile format.
2.6) Picking Pour Points: This was carried out by data management toolbox in ArcGIS 10.3 software. The point of confluence of networks is supposed to be the pour point of each sub watershed.
2.7) Watershed Delineation: This step needs pour point data and flow direction grid cells data as inputs.
Hydrology toolbar of the “spatial analyst” extension was used for that.
3) Drainage network density: it was generated by the hydrology tool box in ArcGIS 10.3 by the same method that
4) Urbanization: The urbanization of the study was digitized from Google earth with the file format of KMl and then converted to shapefile in order to insert in ArcGIS 10.3 software [17].
The product of the fuzzy logic overlaying of these layers would be a thematic map for the flash flood risk that would guide us to where must the urbanization extend [20, 21]. However, fuzzy logic with the operation sum is an increasing function that is used when the combination of multiple evidence is more important or larger than any of the inputs alone which is the case of the flash flood elements. Mathematically, the fuzzy logic operation could be expressed as follow [22]:
The degree of membership is between 0 to 1.
The membership function is µA(x) is associated with a fuzzy sets à such that the function maps every element of universe of discourse X to the interval [0,1].
The mapping is written as: $\mu \tilde{\mathrm{A}}(x): X->[0,1]$.
However, layers that represent the elements of flash flood were all generated by raster form and the concept of fuzzy logic above were applied for the sum of the cells of layers respectively as presented in the mechanism [14].
Figure 5. The mechanism of our evaluation for flash flood risk assessment
The catchment area size is a major factor that controls the flash flood. There is an inverse relationship between them which means that when the catchment area size becomes smaller the potential of a flash flood is increased [9]. The western side of the province has mostly small catchment areas not more than ten kilometers. However, the western side is the location of Jeddah and Mecca cities are within the zone of small catchments area and therefore these cities face flash events and risks more Taif, Ranyah and Dhlam cities that are allocated mostly with larger catchment area although they have more rainfall quantities and Drainage network densities are the second major effective factor in the process of flash flood [7]. However, when the density is increased the overland flow that generates the flash flood increase and hence the flash flood risk is increased too [8, 9, 19].
Figure 6. Drainage network destiny of the study area
Figure 7. Thematic map for the slope in the study area. The western part of the study area has a higher slope degree value than eastern part
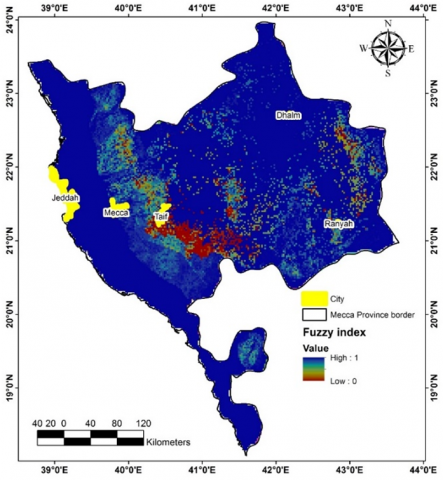
Figure 8. Fuzzy index map for the overlaid layers that generate the flash flood. Jeddah and Mecca are mostly threaten by flash floods from the east and south east directions
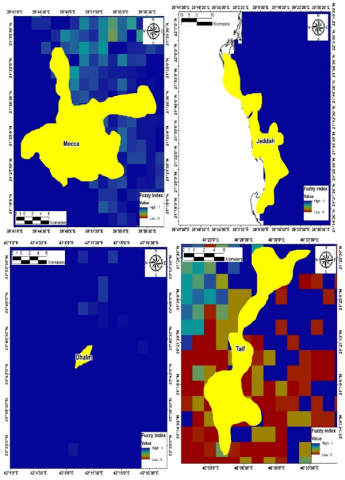
Figure 9. The directions of flash flood risk for Mecca provinces cities. Mecca city is mostly threatened by flash floods from the south
Figure 6 shows that the drainage network fortunately is relatively high in the eastern part of the province where the catchment areas are large relatively and could discharge the huge amount of water that is overland flowed. That distribution of drainage network density reduced its efficiency as a factor for flash flood risk [6, 7, 10, 16].
Slope degree controlled the overland flow and hence the flash flood by controlling gravity force that is the driving for the overland flow. When the slope is maximum, the influence of the gravity force would be maximum too and it decreases when the slope is decreased since the gravity force would have a component [8, 14, 19]. Figure 7 shows the thematic map of the slope degree. It shows that the highest degree of gradient mostly is in the western part of the study area that are allocated within the small catchment areas zones which increase the risk of the flash floods within this area.
The cities of Mecca province go toward further rapid urban expansion as results of the increased number of population and sacred tourism visitors. However, the urban expansion has to be in the areas that have minimum probability of flash flooding that is a major earth risk in the study area [12]. The fuzzy logic of overlaying these layers is presented in Figure 8 shows the areas that are most threaten by flash flooding. It shows that the western part of the province is more threatening than the eastern part. This is expected because the two major elements of the flash flood (catchment area size and slope degree) in the western part are greater than the eastern part. Therefore, the city of Jeddah and Mecca in general are more threaten by flash flood risk than the city Taif, Dhalm and Ranyah. However, if we make zoom in for both the cities in the western and eastern the flash flood risk and to where the urbanization must be toward in order to avoid the flash risk (Figure 9) would as follows:
1) Mecca: it is mostly threatened by floods form the Northeast and the Southeast and therefore the urbanization must be extended toward the west in order to avoid the flash flood risk.
2) Jeddah and Dhalm: they don’t have a serious flash flood risk therefore its urbanization could be extended toward all directions.
3) Taif: It is threatened by flash floods from all directions except the northeast where the flash flood is minimum therefore the urbanization extending must be toward this direction.
The urbanization in the holies areas such as Mecca province is rapidly extended. However, that urban expansion must have a spatial plan that guides it directional toward the areas that have less probability for a flash flood. Rainfall intensity is the driving force for flash flood events. Topography governs the spatial distributions of flash flood events. This is by controlling the size of the catchment area, drainage network density and slope degree distributions. However, simulating all these layers in a spatial model in order to investigate the areas that are most threatened by the flash flood could be done by fuzzy logic in a GIS approach. Thematic maps that produced by GIS is a useful tool for understanding the mechanism of flash flooding and carrying out a spatial for urban expansion accordingly. Urbanization must be oriented toward the areas that have less probability of flash flooding in order to protect the human life and the infrastructure from destroying especially if the city is a mega tourism city such as Mecca city. A hydrological numerical that estimate the exact values for the runoff is necessary for the study area in order to protect the urbanization area from flash flood risks. However, such a model needs climatic stations that provides accurate climatic data.
The authors extend their appreciation to the Deanship of Scientific Research at Imam Mohammad Ibn Saud Islamic University for funding this work through Research Group no. RG-21-09-81.
[1] Ascoura, I. (2013): Impact of pilgrimage (hajj) on the urban growth of the Mecca. Journal of Educational and Social Research, 3(2). https://doi.org/10.5901/jesr.2013.v3n2p255
[2] SADP. (2014). Saudi Arabia Demographic Profile 2014. http://www.indexmundi.com/saudi_arabia/demographics_profile.html, accessed on Apr. 5, 2016.
[3] Eerdmans' Handbook to the World's Religions. Grand Rapids, Mich.: William B. Eerdmans' Publishing Company, 1994. https://www.amazon.com/Eerdmans-Handbook-Worlds-Religions-Publishing/dp/0802808530, accessed on Jan. 6, 2022.
[4] Peters, F.E. (1996). The Hajj: The Muslim Pilgrimage to Mecca and the Holy Places. Princeton University Press
[5] Habeebullah, T.M. (2013). An analysis of air pollution in Makkah - a view point of source Identification. Environment Asia, 6(2): 11-17. https://doi.org/10.14456/ea.2013.12
[6] Palermo, P.C., Ponzini, D. (2010). Spatial Planning and Urban Development: Critical Perspectives. Dordrecht: Springer.
[7] Terti, G., Ruin, I., Anquetin, S., Gourley, J.J. (2015). Dynamic vulnerability factors for impact-based flash flood prediction. Natural Hazards, 79(3): 1481-1497. https://doi/org/10.1007/s11069-015-1910-8
[8] Rozalis, S., Morin, E., Yair, Y., Price, C. (2010). Flash flood prediction using an uncalibrated hydrological model and radar rainfall data in a Mediterranean watershed under changing hydrological conditions. Journal of Hydrology, 394(1-2): 245-255. https://doi.org/10.1016/j.jhydrol.2010.03.021
[9] El‐Hames, A.S., Richards, K.S. (1998). An integrated, physically based model for arid region flash flood prediction capable of simulating dynamic transmission loss. Hydrological Processes, 12(8): 1219-1232. https://doi.org/10.1002/(SICI)1099-1085(19980630)12:8<1219::AID-HYP613>3.0.CO;2-Q
[10] Akbari, M., Neamatollahi, E., Neamatollahi, P. (2019). Evaluating land suitability for spatial planning in arid regions of eastern Iran using fuzzy logic and multi-criteria analysis. Ecological indicators, 98: 587-598. https://doi.org/10.1016/j.ecolind.2018.11.035
[11] Li, J. (2020). A data-driven improved fuzzy logic control optimization-simulation tool for reducing flooding volume at downstream urban drainage systems. Science of the Total Environment, 732: 138931 https://doi.org/10.1016/j.scitotenv.2020.138931
[12] Schiavon, E., Taramelli, A., Tornato, A. (2021). Modelling stakeholder perceptions to assess Green Infrastructures potential in agriculture through fuzzy logic: A tool for participatory governance. Environmental Development, 40: 100671. https://doi.org/10.1016/j.envdev.2021.100671
[13] Beydoun, Z.R. (1988). The Middle East: Regional Geology and Petroleum Resource.: Scientific Press Ltd., Beaconsfield, Bucks, U.K., 292. https://www.worldcat.org/title/middle-east-regional-geology-and-petroleum-resources/oclc/463626500.
[14] Bonham-Carter, G.F. (1994). Geographic Information Systems for Geoscientists—Modelling with GIS. New York: Elsevier Science, pp. 291-302. https://www.elsevier.com/books/geographic-information-systems-for-geoscientists/bonham-carter/978-0-08-041867-4.
[15] Harpur, J. (1994). The Atlas of Sacred Places. Old Say-brook, Conn.: Konecky & Konecky. https://www.amazon.com/Atlas-Sacred-Places-James-Harpur/dp/1568523564.
[16] Hong, H., Tsangaratos, P., Ilia, I., Liu, J., Zhu, A.X., Chen, W. (2018). Application of fuzzy weight of evidence and data mining techniques in construction of flood susceptibility map of Poyang County, China. Science of the Total Environment, 625: 575-588. https://doi.org/10.1016/j.scitotenv.2017.12.256
[17] Hillier, J., Healey, P. (eds.). (2010). The Ashgate Research Companion to Planning Theory: Conceptual Challenges for Spatial Planning. Ashgate Publishing, Ltd. https://www.routledge.com/The-Ashgate-Research-Companion-to-Planning-Theory-Conceptual-Challenges/Healey-Hillier/p/book/9780754672548.
[18] De Roo, G., Hillier, J. (2016). Spatial Planning, Complexity and a World ‘Out of Equilibrium’: Outline of a Non-Linear Approach to Planning. In Complexity and Planning, Routledge, 159-194.
[19] Rai, S., Srinivas, R., Magner, J. (2022). Using fuzzy logic-based hybrid modeling to guide riparian best management practices selection in tributaries of the Minnesota River Basin. Journal of Hydrology, 608: 127628. https://doi.org/10.1016/j.jhydrol.2022.127628
[20] An, P., Moon, W.M, Rencz, A.N. (1991). Application of fuzzy set theory for integration of geological, geophysical and remote sensing data. Canadian Journal of Exploration Geophysics, 27(1): 1-11. https://doi.org/10.13140/2.1.5054.5440
[21] Godschalk, D.R. (2003). Urban hazard mitigation: Creating resilient cities. Natural Hazards Review, 4(3). https://doi.org/10.1061/(ASCE)1527-6988(2003)4:3(136)
[22] Eddy, B.G., Bonham-Carter, G.F., Jefferson, C.W. (2006). Mineral potential analyzed and mapped at multiple scales—a modified fuzzy logic method using digital geology. GIS applications in the earth sciences. Special Publication, 44: 1-39. https://geoscan.nrcan.gc.ca/starweb/geoscan/servlet.starweb?path=geoscan/fulle.web&search1=R=224115.