Majeed Mattar Ramal* | Arkan Dhari Jalal | Uday Hatem Abdulhameed
© 2021 IIETA. This article is published by IIETA and is licensed under the CC BY 4.0 license (http://creativecommons.org/licenses/by/4.0/).
OPEN ACCESS
This study goals to assess the concentrations of specified Heavy Metals (HMs) and quality of taps drinking water of Ramadi city, western Iraq. Heavy Metal Pollution Indices like heavy metal pollution index (HMPI ), heavy metal evaluation index (HMEI) and contamination degree (CD) were applied to assess the supplied water. The average concentrations of Lead (Pb), Nickel (Ni), Chromium (Cr), Arsenic (As) and Cadmium (Cd) in most stations exceed the maximum admissible concentration, while Iron (Fe) in most of stations was within the maximum admissible concentration according to local and global guidelines. (HMPI ) values of most stations were exceed the maximum critical value of 100. (HMEI) values of most stations were exceed the value of 10 recommended for drinking water. (CD) values of most stations were exceed the value of 1 recommended for drinking water. The pollution origins were assessed using principal component analysis (PCA) and clustering analysis (CA). The results indicate that contamination comes from anthropogenic causes being the most common and lithogenic sources being the least common. The present concentration of (HMs) in taps water is causing health and environmental problems, water with high (HMs) concentrations would need to be treated before being supplied to consumers.
heavy metals, water quality index, (CD), HMEI, HPMI
World is facing a serious water crisis, with extreme shortages, shrinking supplies, and rapidly deteriorating water quality. For decades, the country's water sector has been troubled by poor water management, infrastructure negligence and destruction, failed water policies. Over the last three decades, wars and Violent conflicts significantly have increased the water crisis. Furthermore, Iraq is among many countries that most impacted by climate change; the effects of climate change, like shifting precipitation, are already being felt in Iraq [1].
The average daily water consumption is approximately 350 liters per capita. In 1991, clean drinking water was available to 100% of urban residential communities and 54% of rural communities. Following that, the conditions worsened in quality, with 33% of the peoples losing access to clean water and hygiene.
According to current estimations, urban areas receive 73 percent of their water demands, while rural areas receive 40 percent to 45 percent of their demands. Water is available for some hours per day with low quality [2, 3].
The supplied drinking water quality does not satisfy World Health Organization (WHO) or Iraq's drinking water requirements [4]. Due to leakages, the existing water distribution pipeline have significant levels of contamination. As a result of this condition, a considerable portion of the population is infected with variety diseases [5-7].
Drinking water polluted due to the exists the chemicals that originate from activities such as, industrial, wastewater discharge or fittings and plumbing products, agriculture processes, naturally exist and pesticides.
Table 1. Sources, health risks and guideline of common heavy metals in drinking water
|
Heavy Metals |
Main sources |
Health risks |
Guideline (mg/L) [8] |
|
Lead (Pb) |
Plumbing and Fittings |
Possibility Carcinogenic Neurotoxic impacts |
0.01 |
|
Nickel (Ni) |
Naturally Occuring Plumbing and Fittings |
Allergic contact dermatitis. Possibly carcinogenic |
0.07 |
|
Iron (Fe) |
Plumbing and Fittings |
Taste and appearance |
1-3 |
|
Chromium (Cr) |
Naturally Occuring |
Cr+6 (Human Carcinogen) |
0.05 |
|
Arsenic (As) |
Naturally Occuring |
Carcinogenic |
0.01 |
|
Cadmium (Cd) |
Plumbing and Fittings Industrial |
Possibility Carcinogenic |
0.003 |
|
Barium (Ba) |
Naturally Occuring |
Hypertension |
1.3 |
|
Antimony |
Naturally Occuring |
Possibility Carcinogenic |
0.02 |
|
Manganese (Mn) |
Naturally Occuring |
Possibility neurological impact |
0.4 |
|
Mercury (Hg) (Inorganic) |
Industrial |
Hemorrhagic gastritis and colitis. kidney injury. carcinogenic |
0.006 |
Chemical materials applied for water treatment include ions that are commonly contained in drinking water, such as aluminum, sulfate, and sodium, most of these substances do not cause significance health risks, and the concentration levels in the guidelines are greater than 0.1 mg per Liter. Other metals present in plumbing and fittings such as, antimony, lead, copper, cadmium, nickel, zinc, or iron, while manganese, barium, chromium, and arsenic are found in water bodies [8].
Several heavy metals have been found in Iraqi environment, including water, sediments, soils, fishes, crops, and particulate matter, among others. According to (WHO, 2017) Table 1 lists the most commonly Heavy Metals (HMs) found in supplied potable water, their origins, WHO limis and related risks to human health [9-11]. According to the World Health Organization, Iraq recorded increasing in the number of mortality. The numbers of deaths by malignant neoplasm at (2017, 2018 and 2019) were (2738, 21766 and 22737) respectively [12].
HMs are of great concern on this list because of their health and environmental effects. HMs have high solubility, they combine with anions to yields complexes, these complexes are easier to arrive and distribute to many parts of the environment, like plants, soils, surfacewater, and groundwater, resulting in bioaccumulation in a variety of species, especially in the aquatic biomass, this one of reasons contribute to their toxicity [13, 14].
The occurrence of HMs in drinking water, such as chromium or arsenic, is high as a result of its sources (groundwater or wells). The stagnation of water in the network pipes and fitting may raise copper, cadmium, zinc, iron, or lead concentrations [15, 16].
EI-Rehaili and Misbahuddin study the Tap drinking water of Riyadh city, they found that iron concentration was exceeded in 34% the Saudi Arabian Standards Organization ((SASO). Also copper concentration was exceeded in 23% (SASO) limits, just 3% of the measurements reached over the limit of lead concentration limit, but none of any measurements over the optimum/maximum standards for chromium, zinc and cadmium [17].
This study goals to assess the concentrations of specified heavy metals and quality of taps drinking water of Ramadi city, Iraq's Anbar province. Developing Heavy Metal Pollution Indices like (CD, HMPI, and HMEI) are used to assess the taps drinking water quality by heavy metals.
The goals of this study were to assess the concentrations of specified heavy metals and quality of taps drinking water of Ramadi city, Iraq's Anbar province. Total of 216 taps drinkable water samples were collected from thirty six stations within Ramadi city. Two sample were taken from each sample station, three samples were mixed to represent one sample. Heavy Metal Pollution Indices like heavy metal pollution index (HMPI), heavy metal evaluation index (HMEI) and contamination degree (CD) were applied to assess the quality of taps drinkable water by heavy metals. Heavy Metal Pollution Indices were compared with critical values to determine the suitability for drinking use.
The HMPI, HMEI, and CD indices were applied for water quality classification because each index depends on different parameters, so these indices were taken to take different parameters into account. HMPI examined the maximum acceptable limit and maximum allowable level of each HMs. Many HMs were already classified as non-relaxation substances, according to existing regulatory guidelines [18, 19]. As a result, the most recent regulatory rules cannot be used to calculate HMPI. Though, heavy metal pollution index (HMPI) technique solves these and other limitations of previous methods, HMPI index is based on the maximum desired concentration but does not take into account the maximum allowable concentration (Si) [20]. The (HMEI) depends on ultimate allowable concentration of HMs. The (CD) is also related index depends on maximum allowable concentration.
2.1 Study area
Ramadi, is the capital of Anbar province, it is located in the arid regions of Iraq, close to the border with Jordan, Syria, and Saudi Arabia Figure 1 showing the geographical Location of Ramadi City. Ramadi City is a moderately urbanized area with many minor industries, with a community of more than 270,000 person. The study area of the city is about (6605) hectares [21].
The estimated future drinking water demand of Anbar province, expected that will increase about 32% in 2035 [22].
Figure 1. Geographical location of Ramadi city
The drinking water supply in the city suffers from many obstacles and problems, including: old and broken water distribution network, lack of supply, high demand and increasing population growth. Therefore, this research was conducted to assess the heavy metals concentration in taps drinking water that is supplied by Large Ramadi drinking water treatment plant in Ramadi city.
2.2 Ramadi water supply
The Euphrates river is the main source of water supply for the city of Ramadi. The Large Ramadi drinking water treatment plant (LRDWTP) supplies Ramadi city with the drinking water, (LRDWTP) depends on conventional treatment (sedimentation, filtration, and chlorination). (LRDWTP) supply drinking water to Ramadi districts, which averaged about 0.25 million m3/day. the potable water is then pumped into the Ramadi water network, which consists of old iron feeder pipes (diameter > 600 mm), Poly Vinyl Chloride (PVC) main pipes (100-150 mm diameter), and high-density polyethylene (HDPE) consumer connections.
2.3 Sampling
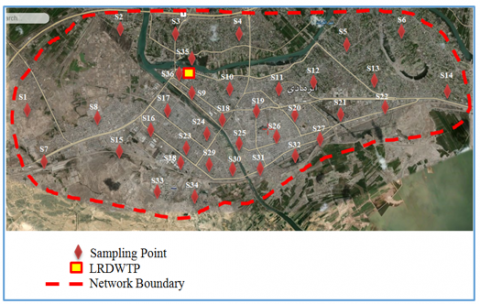
The sampling has been taken in the periods of December 2020 to June 2021, A total of 36 station were selected randomly, the city was divided into sections, the number of samples were according to the water distribution system and population distribution and density to cover the city area, samples were collected each two months frequency, a total of 216 drinking water samples from the tap were then taken during study periods. The study area of the city is about (6605) hectares, geographic information systems technology (ARC GIS.V 10.33) in research mapping and determination of water samples by using (GPS). The study area boundary and sampling station shown in Figure 2.
Figure 2. Study area boundary and sampling stations
Sampling points were chosen in a way that covers the entire city. The samples were taken from each station three times and then mixed. Two samples were taken from each sampling point and then contained in 1 L vessel of clean polyethylene used for collection of all samples.
Vessels of samples were placed in nitric acid in a ratio of 1:1 for 24 hours and washed with deionized water in advance. Since the pH values of the samples should be reduced to be less than 2, pure nitric acid was also added to each sample to decrease the possibility of absorption of trace elements in sampling bottles [23]. The acidified samples were placed in the cooling (incubator) at 4℃. Then, water samples were digested using an acid mixture (2.5 ml of Perchloric acid (HClO4) and 5 ml of Nitric acid (HNO3) on a hot plate. After filtration of digested samples, the final volume was taken to 50 ml with deionized water. The different levels of As, Cd, Cr, Ni, Pb, and Fe elements were found and analyzed using the Atomic Absorption Spectrophotometer instrument (AAS), (Phoinex-986) calibrated with a certified standard solution. The AAS, the instrument calibration state was checked for every 10 analyzed samples using a standard solution. The recalibration for the device should be done in case the standard deviation values were higher than 10%. The pretreatment and measurements of samples were carried out in college of engineering and college of sciences laboratories, university of Anbar.
2.4 Heavy Metal Pollution Index (HMPI)
Water quality Indexing displays total water quality in term of relation to select factors. The suggested indexing process relies on weighted arithmetic mean quality technique, is classified into two main stages. These stages refer to as the construction of a rating scale method (RSM) of every specified quality characteristics, the weighting of the specified parameters, as well as the contamination parameters to be applied for the index [24].
The (RSM) is an arbitrary measurement (between 0 and 1), It is chosen in accordance with individually weighed quality requirements in a comparison analysis or calculated via using values that have inverse relationships with the specified limitations for the specified factor [25-27].
In the current study, the unit weight (Wi) is inversely related to the proposed limitations value (Si) of the associated factor. After determining the heavy metals concentrations, the indices of water quality contamination were calculated. The (HMPI) assesses the taps drinkable water quality. This index is determined in terms of following Eqns. (1) and (2) [26]:
$H M P I=\frac{\sum_{\mathrm{i}=1}^{\mathrm{n}} \mathrm{W}_{\mathrm{i}} \cdot \mathrm{Q}_{\mathrm{i}}}{\sum_{\mathrm{i}=1}^{\mathrm{n}} \mathrm{W}_{\mathrm{i}}}$ (1)
$\mathbf{Q}_{\mathbf{i}}=\sum_{i=1}^{\mathrm{n}}\left|\frac{\mathrm{M}_{\mathrm{i}}-\mathrm{I}_{\mathrm{i}}}{\mathrm{S}_{\mathrm{i}}-\mathrm{I}_{\mathrm{i}}}\right| \times 100$ (2)
where, Qi: is sub-index of ith HMs,
Wi: is unit weight of ith HMs,
n: is total number of HMs,
Mi: is measured concentration of ith HMs,
Ii: is ideal value of ith HMs,
Si: is standard of ith HMs.
We utilized absolute values to express the numerical differences between the two integers, ignoring the algebraic sign. It is possible to classify water quality based on HMPI into three classes, which include: low risk (less than 100), threshold risk (equal to 100) and high risk (more than 100). If the HMPI is above 100, it is not safe to use water for drinking [28]. The maximum concentration level (MCL) was determined according to WHO guidelines. Heavy metals parameters applied for WQIs calculations are shown in Table 2 [29].
Table 2. Heavy metals parameters applied for WQIs calculations
|
Metal |
MC (µg / L) [8] |
Wi |
Ii |
Si |
Hmax |
|
Pb |
1.5 |
0.70 |
10 |
100 |
1.5 |
|
Ni |
20 |
0.050 |
70 |
50 |
20 |
|
Fe |
300 |
0.003 |
200 |
300 |
1000 |
|
Cr |
50 |
0.020 |
50 |
1 |
50 |
|
As |
50 |
0.020 |
10 |
50 |
50 |
|
Cd |
5 |
0.20 |
3 |
5 |
3 |
2.5 Heavy metal evaluation index (HMEI)
The Heavy Metal Evaluation Index (HMEI) is a water quality estimation method which focus on Hms in drinking water [30]. This index is determined in accordance with Eq. (3), as follow:
$H M E I=\sum_{i=1}^{n} \frac{H_{c}}{H_{\max }}$ (3)
where, Hc: is measured concentration of ith HMs.
Hmax: ultimate allowable concentration of ith HMs.
HMEI can be classified into three classes:
low (HMEI value <10), medium (HMEI value between 10 - 20), and high (HMEI value >20) [31-33].
2.6 Contamination degree (CD)
The contamination degree (CD) summarizes the mutual impacts of some quality factors considered unsafe for home drinking water [34], and is measured as follows:
$C D=\sum_{i=1}^{n} C_{f i}$ (4)
$\mathrm{C}_{\mathrm{fi}}=\sum_{\mathrm{i}=1}^{\mathrm{n}} \frac{\mathrm{C}_{\mathrm{Ai}}}{\mathrm{C}_{\mathrm{Mi}}}-1$ (5)
where, Cfi, CAi, and CMi are denoted as pollution parameter, analytical value and upper allowable level of the composition, respectively. M refers to the ‘value of normative’ and CMi is considered as maximum level of concentration (MAX).
The value of resultant CD detects areas of varying pollution concentrations gathered into three groups, including high (CD > 3), medium (CD = 1–3), and low (CD < 1) [34].
2.7 Statistical analysis
The multivariate technique provides quantitative and qualitative information regarding the sources of pollutants [35]. When a single Multivariate approach is used to water quality data, it can produce extremely valuable information [36, 37]. In this work, we use two multivariate methods: Cluster Analysis (CA and Principal Component Analysis (PCA). The purpose of PCA is to obtain background information from multivariable input information in the form of a group of uncorrelated values. (PCA) looks at a group of measurements that are defined by a set of indicated variables that are typically correlated. Principal components, singular vectors, eigenvectors, and loadings are all terms for these variables.
Each unit will also generate a score list based on its estimations of the components. Every component's relevance is reflected by the deviation of its projection or by the deviation presented [38].
The vertical rotation was employed to limit the number of variables associated with a high loading on each component and to better the knowledge of relationships and likely metal origins [39, 40].
The multivariate statistic technique of a limited collection of data paired with extra information could provide valuable insight into contaminant origins in the context of water pollutants [41, 42].
Cluster analysis (CA) is a predictive data analysis technique for resolving categorization problems. Its goal is to organize circumstances, data, or objects into groups or clusters. External (between-cluster) heterogeneity and internal (within-cluster) homogenization should be significant in the clusters [43].
The most widely used method, hierarchical CA, starts with every issue in a distinct cluster and gradually connects clusters until just one cluster generates [44].
The best way to portray the findings of cluster analysis is with a dendogram or binary tree [45].
To study the heavy metals source in HL water, IBM SPSS Statistic 26 software was used to perform Pearson's correlation, PCA, and CA.
3.1 Concentration of heavy metals
Tables 3 and 4 provide the results of the heavy metal analysis and descriptive statistics, in respectively. the heavy metals concentrations of Pb, Ni, Fe, Cr, As and Cd are, respectively, listed in Figures 3, 4, 5, 6, 7 and 8. According to the previous data, the levels of heavy metals including, Pb, Ni, Fe, Cr, As, and Cd are not complying with the desired levels for potable water at most sites, while the average levels of Pb were much higher than the required limits of the [8, 45, 46].
The data regarding heavy metals levels exited the water samples taken from the research area are in Table 3. The average concentration of analyzed metals in water was as As > Cr > Fe > Pb > Cd > Ni, following a decreasing order. Concentrations of As are ranged between (0.2240-0.7480 mg/L) with average ± standard deviation (SD) of (0.4358 ± 0.1245 mg/L) at all stations exceeded the World Health Organization (WHO), (USEPA) and (Iraqi standards (IQS)) guidelines.
Table 3. Average heavy metals (mg/ L) and WQIs (HMPI, HMEI and CD)
|
Stations |
Average HMs Concentration (mg/L) |
Water Quality Index (WQI) |
|||||||
|
Pb |
Ni |
Fe |
Cr |
As |
Cd |
HMPI |
HMEI |
CD |
|
|
S1 |
0.041 |
0.017 |
0.0711 |
0.45 |
0.389 |
0.025 |
323 |
97 |
122 |
|
S2 |
0.038 |
0.021 |
0.0694 |
0.392 |
0.452 |
0.031 |
403 |
100 |
121 |
|
S3 |
0.037 |
0.015 |
0.0746 |
0.372 |
0.485 |
0.028 |
370 |
100 |
121 |
|
S4 |
0.038 |
0.018 |
0.0576 |
0.361 |
0.357 |
0.027 |
332 |
86 |
108 |
|
S5 |
0.04 |
0.013 |
0.0782 |
0.368 |
0.289 |
0.032 |
392 |
81 |
104 |
|
S6 |
0.039 |
0.014 |
0.0731 |
0.416 |
0.356 |
0.032 |
408 |
93 |
114 |
|
S7 |
0.029 |
0.007 |
0.0458 |
0.445 |
0.346 |
0.012 |
152 |
87 |
104 |
|
S8 |
0.031 |
0.009 |
0.0477 |
0.426 |
0.312 |
0.013 |
156 |
82 |
101 |
|
S9 |
0.047 |
0.008 |
0.0723 |
0.437 |
0.456 |
0.045 |
604 |
110 |
135 |
|
S10 |
0.045 |
0.01 |
0.0747 |
0.424 |
0.352 |
0.041 |
531 |
97 |
121 |
|
S11 |
0.041 |
0.011 |
0.0794 |
0.426 |
0.491 |
0.021 |
289 |
104 |
130 |
|
S12 |
0.035 |
0.014 |
0.0772 |
0.432 |
0.458 |
0.033 |
440 |
104 |
122 |
|
S13 |
0.037 |
0.014 |
0.0763 |
0.43 |
0.658 |
0.03 |
433 |
123 |
144 |
|
S14 |
0.032 |
0.017 |
0.0752 |
0.431 |
0.547 |
0.031 |
426 |
112 |
128 |
|
S15 |
0.031 |
0.007 |
0.0545 |
0.461 |
0.324 |
0.01 |
124 |
85 |
105 |
|
S16 |
0.038 |
0.027 |
0.071 |
0.037 |
0.657 |
0.021 |
264 |
82 |
105 |
|
S17 |
0.037 |
0.005 |
0.0357 |
0.025 |
0.388 |
0.018 |
185 |
51 |
74 |
|
S18 |
0.035 |
0.021 |
0.0532 |
0.431 |
0.574 |
0.034 |
468 |
117 |
134 |
|
S19 |
0.041 |
0.009 |
0.0487 |
0.437 |
0.387 |
0.02 |
262 |
94 |
120 |
|
S20 |
0.042 |
0.02 |
0.0713 |
0.426 |
0.457 |
0.034 |
448 |
105 |
129 |
|
S21 |
0.037 |
0.009 |
0.0424 |
0.453 |
0.258 |
0.011 |
124 |
79 |
104 |
|
S22 |
0.035 |
0.011 |
0.0521 |
0.448 |
0.245 |
0.017 |
199 |
79 |
101 |
|
S23 |
0.031 |
0.021 |
0.0681 |
0.462 |
0.549 |
0.041 |
560 |
119 |
131 |
|
S24 |
0.04 |
0.024 |
0.0425 |
0.458 |
0.278 |
0.014 |
162 |
84 |
110 |
|
S25 |
0.035 |
0.022 |
0.0408 |
0.434 |
0.351 |
0.015 |
182 |
88 |
110 |
|
S26 |
0.037 |
0.029 |
0.057 |
0.421 |
0.545 |
0.034 |
469 |
113 |
133 |
|
S27 |
0.029 |
0.015 |
0.0614 |
0.422 |
0.541 |
0.021 |
333 |
108 |
123 |
|
S28 |
0.028 |
0.031 |
0.069 |
0.443 |
0.472 |
0.031 |
421 |
106 |
118 |
|
S29 |
0.039 |
0.019 |
0.0751 |
0.438 |
0.547 |
0.028 |
386 |
113 |
136 |
|
S30 |
0.033 |
0.023 |
0.0722 |
0.44 |
0.551 |
0.041 |
559 |
117 |
132 |
|
S31 |
0.038 |
0.018 |
0.0532 |
0.439 |
0.353 |
0.014 |
170 |
89 |
114 |
|
S32 |
0.036 |
0.015 |
0.0645 |
0.435 |
0.361 |
0.011 |
160 |
88 |
112 |
|
S33 |
0.033 |
0.02 |
0.0558 |
0.025 |
0.428 |
0.011 |
86 |
53 |
75 |
|
S34 |
0.035 |
0.024 |
0.0662 |
0.027 |
0.501 |
0.015 |
155 |
63 |
85 |
|
S35 |
0.033 |
0.02 |
0.0547 |
0.039 |
0.748 |
0.015 |
134 |
51 |
63 |
|
S36 |
0.019 |
0.0184 |
0.024 |
0.011 |
0.224 |
0.038 |
408 |
39 |
41 |
|
Min. |
0.019 |
0.005 |
0.024 |
0.011 |
0.224 |
0.01 |
86 |
39 |
41 |
|
Max. |
0.047 |
0.031 |
0.0794 |
0.462 |
0.748 |
0.045 |
604 |
123 |
144 |
|
Avg. |
0.0359 |
0.0166 |
0.0613 |
0.361 |
0.4358 |
0.0249 |
320 |
92 |
112 |
|
S.D |
0.0052 |
0.0065 |
0.014 |
0.1535 |
0.124 |
0.0104 |
148 |
21 |
22 |
|
Guideline |
0.01 |
0.05 |
0.3 |
0.05 |
0.01 |
0.003 |
100 |
10 |
1 |
Table 4. Descriptive statistics for HMs value (mg/l) compared with the guidelines
|
HMs &WQI |
.Min |
.Max |
Average±S.D. |
Drinking [46] |
Drinking [8, 47] |
|
Pb |
0.019 |
0.047 |
0.0052 ±0.0359 |
0.015 |
0.01 |
|
Fe |
0.024 |
0.0794 |
0.0613 ± 0.0140 |
0.3 |
0.1 |
|
Cr |
0.011 |
0.462 |
0.3617 ± 0.1535 |
0.05 |
0.05 |
|
Cd |
0.01 |
0.045 |
0.0249 ± 0.0104 |
0.005 |
0.005 |
|
Ni |
0.005 |
0.031 |
0.0166 ± 0.0065 |
0.02 |
0.02 |
|
As |
0.224 |
0.748 |
0.4358 ± 0.1245 |
0.01 |
0.01 |
|
HMPI |
86 |
604 |
640 ± 148 |
- |
- |
|
HMEI |
39 |
123 |
92 ± 21 |
- |
- |
|
CD |
41 |
144 |
112 ± 22 |
- |
- |
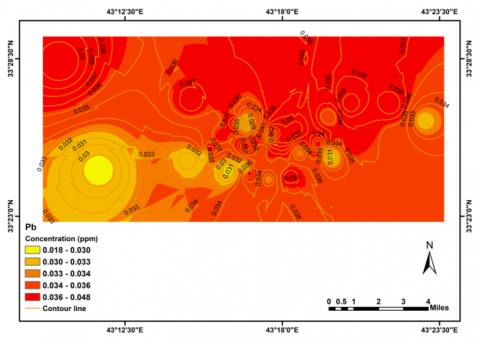
Figure 3. Average concentrations of Pb
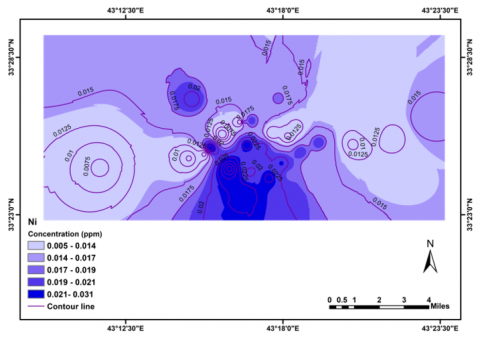
Figure 4. Average concentrations of Ni
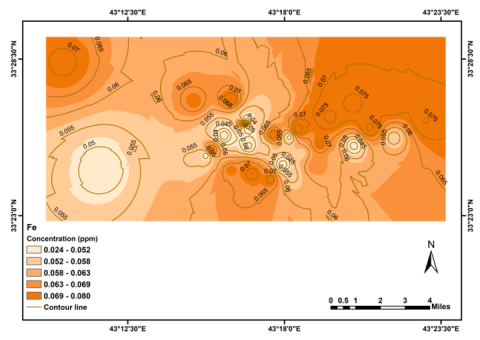
Figure 5. Average concentrations of Fe
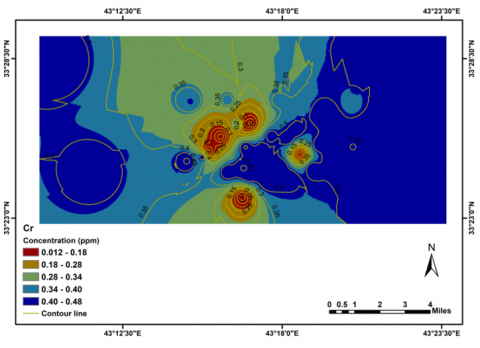
Figure 6. Average concentrations of Cr
Figure 7. Average concentrations of As
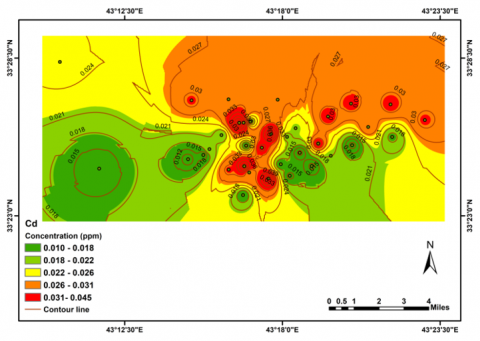
Figure 8. Average concentrations of Cd
Figure 9. HMPI-Index values
Figure 10. HMEI-Index values
Figure 11. CD-Index values
The mean value of Cr range between (0.0110-0.4620 mg/L) with average ± SD of (0.3617 ± 0.1513 mg/L) 30 of 36 stations (83.3%) exceeded the World Health Organization (WHO), (USEPA) and (Iraqi standards (IQS) guidelines. The mean value of Fe Concentration range between (0.0240-0.0794 mg/L) with average ± SD) (0.0613 ± 0.0140 mg/L) were with the permissible limit World Health Organization (WHO), (USEPA) and Iraqi standards (IQS)) guidelines. The mean value of Pb Concentration range between (0.019-0.0470 mg/L) with average ± SD) (0.0359 ± 0.0052 mg/L) were also more than the (WHO), (USEPA) and Iraqi standards (IQS) guidelines. In addition, the mean value of Cd ranged between (0.010-0.0450 mg/L) with average ± SD) (0.0249 ± 0.0104 mg/L) were bigger than the (WHO), (USEPA) and ( Iraqi standards (IQS) ) guidelines. The mean value of Ni range between (0.0050-0.0310 mg/L) with (average ± SD) (0.0166 ± 0.0065 mg/L) 26 of 36 stations (72.3%) were comply with World Health Organization (WHO), (USEPA) and Iraqi standards (IQS) requirements.
Depending on the comparison between the (WHO), (USEPA) and Iraqi standards (IQS) ) potable water guidelines described above and the mean values of the heavy metals, the drinking water was contaminated by As, Cr, Fe, Pb, Cd and Ni, and the drinking water were unsafe for drinking purposes.
This pollution may be due to the old and damaged network. Descriptive statistics for HMs value (mg/l) Compared with the guidelines are listed in the Table 4.
Table 5 demonstrates the results of the Water Quality Indices WQIs (HMPI, HMEI and CD). Figures 9, 10, and 11 show the results of the HMPI, HMEI and CD respectively. WQIs of all the sampling stations were determined independently using the global guidelines [29], and is described by HMPI, HMEI and CD, respectively. The values of HMPI were ranged from 86 to 604 with (average ± SD) values of (320 ± 148), respectively.
Based on the results of WQIs, the HMPI of most stations have exceeded the dangerous value of 100 recommended for potable water by Prasad and Bose [47]. Station (S33) have HMPI value of 86, which lower than the critical value of 100. The HMPI computed using average concentration values of all HMs and all stations is 320, which is greater than the critical limit of 100. The measured HMs have different contribution percentage in HMPIs values, Pb, Ni, Fe, Cr, As and Cd have the contribution percentage of 0.2%, 1.2%, 0.3%, 11.3%, 16.6 and 70.4% respectively. Cr and As have the most contribution percentage in pollutant indices values about 85.9%, while Pb, Ni, Fe and Cd have 14.1% contribution percentage in HMPIs values.
Table 5. Water quality assessment classifications using HMPI, HMEI and CD
|
Index |
Class |
Degree of Pollution |
No. of Samples |
% |
Stations |
|
HMPI |
76-100 |
Very Poor |
1 |
3 |
S33 |
|
>100 |
Unsuitable for drinking |
35 |
97 |
All except S33 |
|
|
HMEI |
>20 |
High |
36 |
100 |
All Stations |
|
CD |
>3 |
High |
36 |
100 |
All Stations |
3.2 Water Quality Indices (WQI)
HMEI was applied for a good understanding of the water quality indices [29]. The HMEI values ranged from 39 to 123 with (average ± SD) value of (92 ± 21), respectively.
The results showed that the HMEI for most stations were larger than the recommended low value of 10 and the high value of 20 for pure water by Prasad and Bose [47].
Station (S36) has minimum HMEI value of 39, which also greater than the recommended value of 10. The HMEI calculated using average concentration values of all HMs and all stations is 92, which is greater than the critical limit. of 10. The measured HMs have different contribution percentage to HMEIs values, Pb, Ni, Fe, Cr, As and Cd have the contribution percentage of 3.0%, -0.2%, -0.9%, 41.1%, 48.5, and 8.6%, respectively. Cr and As have the most contribution percentage to pollutant indices values about 85.9%, while Pb, Ni, Fe and Cd have 14.1% contribution percentage in HMEIs values.
The contamination degree (CD) was applied as reference of assessing the degree of heavy metal pollution [31] the range with (average ± SD) values of CD were (41–144) and (112 ± 22). All the samples have a CD value of more than 3, accordingly water classified into highly polluted [29, 34].
Though, there were differences among the results of HMPI, HMEI and CD related on the water quality of examined samples. However, at all stations, concentrations of Pb, Ni, Fe Cr, As and Cd concentration were exceed the recommended of the WHO, USEPA and Iraqi drinking water standard, Also have high (HMPI), (HMEI) and (CD) values. The present concentration of heavy metal existed in potable water is causing health and environmental problems, and it needs to be solved. Water with high HMs concentrations would need to be treated before being supplied to consumers.
3.3 Pollution source
The relationship between the five metals studied was investigated using principal component analysis (PCA). Table 6 shows the Pearson correlation coefficients(PCCs) and the corresponding matrix established in the research.
Table 6. PCA matrix of heavy metals
|
HMs |
Pb |
Ni |
Fe |
Cr |
As |
Cd |
|
Pb |
1.00 |
-0.179 |
0.450* |
0.273 |
0.032 |
0.150 |
|
Ni |
|
1.000 |
0.132 |
-0.173 |
0.425* |
0.203 |
|
Fe |
|
|
1.000 |
0.291 |
0.481* |
0.465* |
|
Cr |
|
|
|
1.000 |
-0.188 |
0.185 |
|
As |
|
|
|
|
1.000 |
0.259 |
|
Cd |
|
|
|
|
|
1.000 |
Table 7. PCA (Rotated matrix) of heavy metals
|
Element |
Component 1 |
Component 2 |
|
As |
0.845 |
- |
|
Ni |
0.733 |
-0.293 |
|
Cd |
0.526 |
0.454 |
|
Pb |
- |
0.751 |
|
Cr |
-0.229 |
0.708 |
|
Fe |
0.559 |
0.696 |
|
Eigen value |
1.734 |
1.542 |
|
Variance explained % |
44.551 |
37.182 |
|
Cumulative variance % |
44.551 |
81.733 |
The highest variance and a rotated matrix of HMs were used to obtain the major components with eigenvalues larger than 1.0. Table 7 shows the extraction of two components (C1 and C2). (C1 and C2) were taken out with an eigenvalue greater than 1. Table 6 shows the numerical representations of the relationships between the HMs and the two components. The results demonstrate a strong relationship between As and Ni with C1, as well as a moderate relationship between Fe and Cd with C1. There is no relation between Pb and Cr with C1.
In addition, results show good relation between Cr, Fe and Pb with C2, and as well as medium relationship between Cd and C2, and there is no relation between As and Ni with C2. This suggests that HMs came from multi sourcec (lithogenic and anthropogenic). Results confirmed the estimation provided by Table 6, that the relation between HMs are either insignificance or moderately, and the possible source from the component is moderately significant, As a result the main conamintion source could be anthropogenic source, which is largely due to sewage effluents from underground due to pipes leakages, and the minor source is lithogenic. These result indicate the exist of multi sources of HMs in tap drinking water of Ramaadi city.
The measured data indicated that there is a severe effect of HMs due to their high concentration in drinking water. On the other hand, HMPI, HMEI and CD have different results, affecting on the quality of water in the examined samples. However, at all stations, concentrations of Ni, Pb, Fe, Cd, As, and Cr have exceed the recommended of the WHO, USEPA and Iraqi potable water requirements. They also have high (HMPI), (HMEI) and (CD) values, Therefore, water classified as highly risk. The current levels of heavy metal in drinking water are causing health and environmental problems, and it needs to be solved. Water with high HMs concentrations would need to be treated before being supplied to consumers.
Results confirmed the optimal origin of pollution source may be contributed from anthropogenic origin, which mostly due to the wastewater sources from underground due to pipes leakages, and the minor source is lithogenic. These result indicate the exist of multi sources of HMs in tap drinking water of Ramadi city.
This research did not receive any specific grant from funding agencies in the public, commercial, or not-for-profit sectors.
[1] Medany, M. (2008). Impact of climate change on Arab countries. In Arab Environment: Future Challenges. Beirut: Arab Forum for Environment and Development 127-136.
[2] Al-Ansari, N., Ali, A., Knutsson, S. (2014). Present conditions and future challenges of water resources problems in Iraq. Journal of Water Resource and Protection, 6(12): 1066-1098. https://doi.org/10.4236/jwarp.2014.612102
[3] Al-Ansari, N.A., Knutsson, S. (2011). Toward prudent management of water resources in Iraq. Journal of Advanced Science and Engineering Research, 1: 53-67. https://www.diva-portal.org/smash/get/diva2:983999/FULLTEXT01.pdf.
[4] Inter-Agency Information and Analysis Unit. (2011). Water in Iraq Factsheet. http://www.iauiraq.org/documents/1319/Water%20Fact%20Sheet%20March%202011.pdf.
[5] United Nations. (2010). Water resources management white paper. United Nations Assistance Mission for Iraq, United Nations Country Team in Iraq. http://iq.one.un.org/documents/100/white%20paper-eng_Small.pdf.
[6] White, R.P., Nackoney, J. (2003). Drylands, people, and ecosystem goods and services. A Web-Based Geospatial Analysis. https://www.wri.org/drylands-people-and-ecosystem-goods-and-services.
[7] Al-Ansari, N. (2013). Management of water resources in Iraq: Perspectives and prognoses. Engineering, 5(8): 667-684. https://doi.org/10.4236/eng.2013.58080
[8] WHO Library Cataloguing-in-Publication Data, Geneva. WHO (World Health Organization) 2017. Guidelines for Drinking- Water Quality: Fourth Edition Incorporating First Addendum. WHO Library Cataloguing-in-Publication Data. World Health Organization, Geneva, Switzerland. https://apps.who.int/iris/bitstream/handle/10665/254637/9789241549950-eng.pdf?sequence=1.
[9] Al-Hussaini, S.N.H., Al-Obaidy, A.H.M.J., Al-Mashhady, A.A.M. (2018). Environmental assessment of heavy metal pollution of Diyala River within Baghdad City. Applied Water Science, 8(3): 1-6. https://doi.org/10.1007/s13201-018-0707-9
[10] Al-Heety, E.A., Turki, A., Noori, S. (2013). Heavy metals concentration in urban soils of Fallujah city, Iraq. Journal of Environment and Earth Science, 3(11). https://www.researchgate.net/publication/267507059_Heavy_Metals_Concentration_in_Urban_Soils_of_Fallujah_City_Iraq.
[11] Hassoon, H.A. (2018). Heavy metals contaminationassessment for some imported and local vegetables. Iraqi Journal of Agricultural Sciences, 49(5): 794-802. https://doi.org/10.36103/ijas.v49i5.39
[12] Ahmed, S.S., Hasan, M.A. (2019). Determination of HeaDetermination of some heavy metals in three fish species from Duhok City Markets in Kurdistan of Iraq. Science Journal of University of Zakho, 7(4): 152-157. https://doi.org/10.25271/sjuoz.2019.7.4.621
[13] Jaishankar, M., Tseten, T., Anbalagan, N., Mathew, B.B., Beeregowda, K.N. (2014). Toxicity, mechanism and health effects of some heavy metals. Interdisciplinary Toxicology, 7(2): 60-72. https://doi.org/10.2478/intox-2014-0009
[14] Pernía, B., Mero, M., Cornejo, X., Ramírez, N., Ramírez, L., Bravo, K., Zambrano, J. (2018). Determination of cadmium and lead in water, sediment and bioindicator organisms in Estero Salado, Ecuador. Enfoque UTE, 9(2): 89-105. https://doi.org/10.29019/enfoqueute.v9n2.246
[15] Chowdhury, S., Mazumder, M.J., Al-Attas, O., Husain, T. (2016). Heavy metals in drinking water: Occurrences, implications, and future needs in developing countries. Science of the Total Environment, 569: 476-488. https://doi.org/10.1016/j.scitotenv.2016.06.166
[16] Cipriani-Avila, I., Molinero, J., Jara-Negrete, E., Barrado, M., Arcos, C., Mafla, S., Ochoa-Herrera, V. (2020). Heavy metal assessment in drinking waters of Ecuador: Quito, Ibarra and Guayaquil. Journal of Water and Health, 18(6): 1050-1064. https://doi.org/10.2166/wh.2020.093
[17] Ei-Rehaili, A., Misbahuddin, M. (1995). Levels of trace metals in Riyadh drinking water at the consumer taps. Journal of King Saud University-Engineering Sciences, 7(1): 1-22. https://doi.org/10.1016/S1018-3639(18)30614-7
[18] Islam, M.S., Mostafa, M.G. (2021). Groundwater quality and risk assessment of heavy metal pollution in middle-west part of Bangladesh. Journal of Earth and Environmental Science Research. SRC/JEESR-158. https://doi. org/10.47363/JEESR/2021(3)143
[19] Mukherjee, I., Singh, U.K., Singh, R.P., Kumari, D., Jha, P.K., Mehta, P. (2020). Characterization of heavy metal pollution in an anthropogenically and geologically influenced semi-arid region of east India and assessment of ecological and human health risks. Science of the Total Environment, 705: 135801. https://doi.org/10.1016/j.scitotenv.2019.135801
[20] Bodrud-Doza, M.D., Islam, A.T., Ahmed, F., Das, S., Saha, N., Rahman, M.S. (2016). Characterization of groundwater quality using water evaluation indices, multivariate statistics and geostatistics in central Bangladesh. Water Science, 30(1): 19-40. https://doi.org/10.1016/j.wsj.2016.05.001
[21] Sulaiman, S.O., Najm, A.B.A., Kamel, A.H., Al-Ansari, N. (2021). Evaluate the optimal future demand of water consumption in Al-Anbar province in the west of Iraq. Planning, 16(3): 457-462. https://doi.org/10.18280/ijsdp.160306
[22] Ahmed, N.A., Mahmood, T.S. (2020). Change in land-uses of Ramadi city and its influence on public transportation sustainability. IOP Conference Series: Materials Science and Engineering, 881: 012175. https://doi.org/10.1088/1757-899x/881/1/012175
[23] APHA. (2012). Standard Methods for the Examination of Water and Wastewater, 22nd edn. American Public Health Association, Washington, DC. http://srjcstaff.santarosa.edu/~oraola/Assets/APHA_SM_20.pdf.
[24] Prasanna, M.V., Praveena, S.M., Chidambaram, S., Nagarajan, R., Elayaraja, A. (2012). Evaluation of water quality pollution indices for heavy metal contamination monitoring: A case study from Curtin Lake, Miri City, East Malaysia. Environmental Earth Sciences, 67(7): 1987-2001. https://doi.org/10.1007/s12665-012-1639-6
[25] Jacobs, H.L., Gabrielson, I.N., Horton, R.K., Lyon, W.A., Hubbard, E.C., McCallum, G.E. (1965). Water quality criteria-stream vs. effluent standards. Journal (Water Pollution Control Federation), 37(3): 292-315. http://www.jstor.org/stable/25035251
[26] Mohan, S.V., Nithila, P., Reddy, S.J. (1996). Estimation of heavy metals in drinking water and development of heavy metal pollution index. Journal of Environmental Science & Health Part A, 31(2): 283-289. https://doi.org/10.1080/10934529609376357
[27] Ghalib, H.S., Ramal, M.M. (2021). Spatial and temporal water quality evaluation of heavy metals of Habbaniyah Lake, Iraq. International Journal of Design & Nature and Ecodynamics, 16(4): 467-475. https://doi.org/10.18280/ijdne.160414
[28] Sobhanardakani, S. (2016). Evaluation of the water quality pollution indices for groundwater resources of Ghahavand Plain Hamadan Province, Western Iran, Iran. J. Toxicol., 10(2016): 35-40. http://ijt.arakmu.ac.ir/article-1-463-en.html.
[29] Edet, A.E., Offiong, O.E. (2002). Evaluation of water quality pollution indices for heavy metal contamination monitoring. A study case from Akpabuyo-Odukpani area, Lower Cross River Basin (southeastern Nigeria). GeoJournal, 57(4): 295-304. https://doi.org/10.1023/B:GEJO.0000007250.92458.de
[30] Al-Ani, M.Y., Al-Nakib, S.M., Ritha, N.M., Nouri, A.H. (1987). Water quality index applied to the classification and zoning of Al-Jaysh canal, Baghdad-Iraq. Journal of Environmental Science & Health Part A, 22(4): 305-319. https://doi.org/10.1080/10934528709375351
[31] Ashraf, M.A., Maah, M.J., Yusoff, I. (2010). Water quality characterization of varsity lake, University of Malaya, Kuala Lumpur, Malaysia. Journal of Chemistry, 7: S245-S254. https://doi.org/10.1155/2010/396215
[32] Khaniki, G.J., Ghaderpoori, M., Dehghani, M.H., Nazmara, S. (2017). Analysis of toxic and trace metal contaminants in bottled water by using atomic absorption spectrometry. Food and Environment Safety Journal, 10(2). http://fens.usv.ro/index.php/FENS/article/view/367.
[33] Backman, B., Bodiš, D., Lahermo, P., Rapant, S., Tarvainen, T. (1998). Application of a groundwater contamination index in Finland and Slovakia. Environmental Geology, 36(1): 55-64. https://doi.org/10.1007/s002540050320
[34] Zhou, F., Guo, H., Liu, L. (2007). Quantitative identification and source apportionment of anthropogenic heavy metals in marine sediment of Hong Kong. Environmental Geology, 53(2): 295-305. http://dx.doi.org/10.1007/s00254-007-0644-7
[35] Chen, T., Wang, J., Zhou, H., Wong, M. (1996). Assessment of trace metal distribution and contamination in surface soils of Hong Kong. Environmental Pollution, 96: 61-68. http://dx.doi.org/10.1016/S0269-7491(97)00003-1
[36] Heinrich, A. (2007). The application of multivariate statistical methods for evaluation of soil profiles. Journal of Soil and Sediments, 7: 45-52. http://dx.doi.org/10.1065/jss2006.11.193
[37] Abdi, H. (2003). Multivariate Analysis. In: Lewis-Beck, M., Bryman, A. and Futing, T., Eds., Encyclopedia of Social Sciences Research Methods, Sage, Thousand Oaks. https://personal.utdallas.edu/~herve/Abdi-MultivariateAnalysis-pretty.pdf.
[38] Acosta, J.A., Faz, A., Martínez-Martínez, S., Zornoza, R., Carmona, D.M., Kabas, S. (2011). Multivariate statistical and GIS-based approach to evaluate heavy metals behavior in mine sites for future reclamation. Journal of Geochemical Exploration, 109(1-3): 8-17. http://dx.doi.org/10.1016/j.gexplo.2011.01.004
[39] Bini, C., Sartori, G., Wahsha, M., Fontana, S. (2011). Background levels of trace elements and soil geochemistry at regional level in NE Italy. Journal of Geochemical Exploration, 109: 125-133 http://dx.doi.org/10.1016/j.gexplo.2010.07.008
[40] Zhou, J., Ma, D., Pan, J., Nie, W., Wu, K. (2008). Application of multivariate statistical approach to identify heavy metals sources in sediments and waters: A case study in Yangzhong, China. Environmental Geology, 54: 373-380. http://dx.doi.org/10.1007/s00254-007-0824-5
[41] Borůvka, L., Vacek, O., Jehlička, J. (2005). Principal component analysis as a tool to indicate the origin of potentially toxic elements in soils. Geoderma, 128(3-4): 289-300. http://dx.doi.org/10.1016/j.geoderma.2005.04.010
[42] McGarigal, K., Cushman, S.A., Stafford, S. (2013). Multivariate statistics for wildlife and ecology research. Springer Science & Business Media. http://dx.doi.org/10.1007/978-1-4612-1288-1
[43] McKenna Jr, J.E. (2003). An enhanced cluster analysis program with bootstrap significance testing for ecological community analysis. Environmental Modelling & Software, 18(3): 205-220. http://dx.doi.org/10.1016/S1364-8152(02)00094-4
[44] Salah, E., Turki, A., Al-Othman, E. (2012). Assessment of water quality of euphrates river using cluster analysis. Journal of Environmental Protection, 3: 1269-1273. http://dx.doi.org/10.4236/jep.2012.312180
[45] USEPA. (2012). 2012 Edition of the drinking water standards and health advisories. EPA 822-S-12-001. https://www.epa.gov/sites/production/files/2018-03/documents/dwtable2018.pdf.
[46] Drinking-Water Standard IQS: 417, Central Organization for Quality Control and Standardization, Council of Ministers, Republic of Iraq, 2001. https://pdfcoffee.com/-447--pdf-free.html.
[47] Prasad, B., Bose, J. (2001). Evaluation of the heavy metal pollution index for surface and spring water near a limestone mining area of the lower Himalayas. Environmental Geology, 41(1): 183-188. https://doi.org/10.1007/s002540100380